Drawing maps with conditional coordinates
I continue to study JS, while at the same time solving practical problems, and with some solutions there is an overwhelming desire to share with the community, as they say - at least a little bit but it should be returned.
In my last article, I talked about building simple graphs with the help of the d3 library, I also planned to draw maps with it, but after experimenting with d3, Raphael and paper.js realized that cycling could not be avoided and redone the rendering into HTML Canvas, and the I want to tell in this article.
In fact, the cards are certainly too loud, because there are no cards as such. The task is to draw point objects and contours by coordinates. Drawing contours I leave outside the scope of this article and talk about the banal in general (as it seemed to me before) the task - the derivation of points along the coordinates.
The first thought was - of course, to use the finished cartographic library (even before a close acquaintance with d3 he had experiments with them). There were two difficulties, the first - conditional coordinates and the second - a large number of objects (up to 10 thousand points per map). And if leaflet.js copes with the conditional coordinates, then the display on it of a huge number of points within one map showed that you need to look the other way.
The next library was d3, but once again, after studying the examples related to cartography, I realized that the first thing I’ll know is speed.
Next was Raphael.js - a great graphic library and in comparison with the same d3 is very simple and clear (simple in the sense of ease of use). On Rafael, I implemented almost everything I needed, plus the library itself provided a huge amount of buns and amenities, and if I had a few other tasks I would use Rafael and rejoice. But again, buried in limitations and trying to catch a glimpse of paper.js turned to pure HTML canvas. True, by this time I had already copied almost everything, and in order to switch from Raphael to the canvas, I had to replace a maximum of ten lines in the code.
Well, enough with the introductions, turn to the implementation. The first thing we need to effectively display a map is to have our own Viewport ( Wikipedia translates this term as a Viewport, which seems clumsy to me, so I will write further as a viewport). This term came from 3D, and is also actively used in 2D games and in our case it means only the part of the map that we want to see.
Again, I decided not to reinvent the wheel and take some ready-made abstract viewport implementation for 2D and fasten it to my maps. I spent half a day on active searches and found nothing suitable, which still surprises me a little. But now I have my own completely abstract implementation of the 2D viewport - it will start where I suddenly write my own toy without using frameworks.
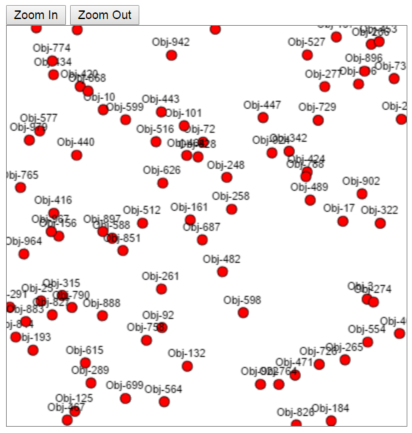
This is what the viewport looks like (In order not to overload the article, I give a squeeze of the code, which can be viewed in its entirety at GitHub by the link at the end of the article).
class Viewport { constructor(param) { this.updateCallback = param.update; this.size = param.size; this.map = param.map; ... }; set Center(koordXY) { ... }; get Center() { ... }; set Zoom(zoomXY) { ... }; get Zoom() { ... }; set Size(sizeWH) { ... }; get Size() { ... }; show() { this.vp = { x1: this.vX, x2: this.vX + this.size.w / this.zoom.x, y1: this.vY, y2: this.vY + this.size.h / this.zoom.y, zX: this.zoom.x, zY: this.zoom.y }; this.updateCallback(this.vp); }; caclViewPort() { ... }; calcCenter() { ... }; calcMaxZoom() { ... }; }; In principle, the implementation is perfect simple - an instance of the Viewport class is created, to which its sizes, border coordinates of the map and callback function are transferred, which will be called to draw the viewport. Border coordinates are transferred to this function, within which you need to display objects and a factor on each axis for coordinate transformation. In the case of a map, the axes are the same and these factors are equal.
Well, the most important and difficult is implemented - but otherwise everything is already simple:
class XyMap { constructor(container) { this.container = (typeof container === 'string') ? document.getElementById(container) : container; ... this.objects = []; //{ id: 1, caption: 'Obj1', type: 'circe', x: 0, y: 0, r: 5, color: 'red' } this.viewPort = null; }; //add object for draw to array add(obj) { ... }; init() { let id = this.container.id +'_canvas'; this.container.innerHTML = `<canvas id="${id}" width="${this.container.offsetWidth-1}" height="${this.container.offsetHeight-1}"></canvas>`; this.canvas = document.getElementById(id); this.viewPort = new Viewport({ update: (vp) => { this.drawViewport(vp); }, size: { w: this.container.offsetWidth-1, h: this.container.offsetHeight-1}, map: this.limit, oneZoom: true }); this.handleEvent = function(ev) { switch(ev.type) { case 'mousedown': ... case 'mousemove': ... case 'mouseup': ... case 'wheel': ... } }; ... }; scroll(x, y) { ... }; show() { this.viewPort.show(); }; zoomIn(value) { ... this.viewPort.Zoom = z; this.viewPort.show(); }; zoomOut(value) { ... this.viewPort.Zoom = z; this.viewPort.show(); }; //callback for viewport vp = { x1, x2, y1, y2, zX, zY } drawViewport(vp) { let x,y,obj,objT; let other = this; let ctx = this.canvas.getContext('2d'); let pi2 = Math.PI*2; ctx.clearRect(0, 0, this.canvas.width, this.canvas.height); this.objects.filter(d => dx>=vp.x1 && dx<=vp.x2 && dy>=vp.y1 && dy<=vp.y2).forEach(function(d) { x = (dx - vp.x1) * vp.zX; y = (dy - vp.y1) * vp.zY; if (d.type === 'circe') { ctx.beginPath(); ctx.arc(x,y,dr,0,pi2); ctx.fillStyle = d.color; ctx.fill(); ctx.lineWidth = 0.5; ctx.strokeStyle = 'black'; ctx.stroke(); ctx.fillStyle = 'black'; ctx.font = '8pt arial'; ctx.fillText(d.caption, x-20, y-9); }; }); }; }; Create an instance of the XyMap class, use the add method to pass objects to it for drawing, after which we call initialization during which a viewport is created. After that we call the show method - and voila, the map is on the screen.
That's all, I apologize for the lengthy introduction and the crumpled main part of the article - I told you how I could. One hope that the resulting code is still read and speaks for itself.
The program itself and an example of use can be viewed at Github .
UPD. : Online example in JS-sandbox .
UPD 2 .: Improved component: layers appeared, objects can now be selected both by click and from outside the component by Id, R-trees are used for spatial search (JS RBush library).
')
Source: https://habr.com/ru/post/317024/
All Articles