Monitoring driven operation

Nikolay Sivko ( NikolaySivko , okmeter.io )
The story of how the operation is arranged in the company HeadHunter, and how monitoring is used to monitor the quality of operation.
My name is Nikolai Sivko, I manage the operation in hh.ru. The report is called strange, but, in fact, we will talk about the following:
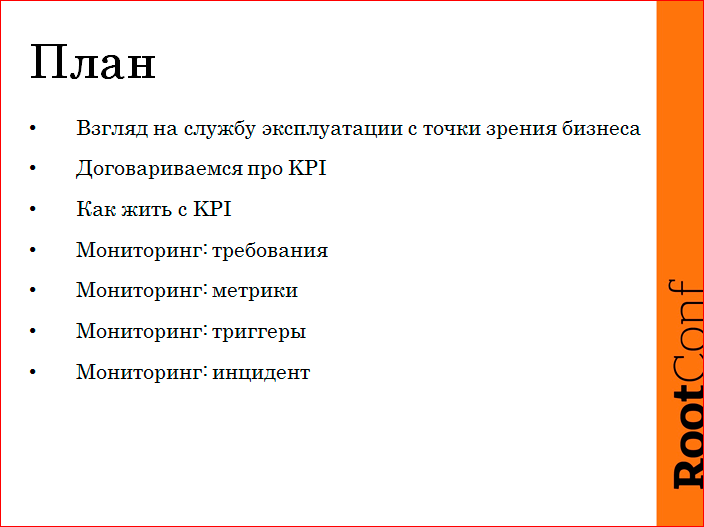
')
At this conference, they talk about monitoring on each report, I would like to highlight the other side - not how to store metrics, but what to store, why to store, and what profit to get from this?
Let's start from afar - why, in general, the company employs admins, and what task for the business they solve. Then I will try to highlight the question: how to understand business, admins work well or not well? We have implemented KPI, and I will tell you a little about it. How do we motivate admins to work well, and have tried to link this with profit for business. Let's talk about how all admins see it, i.e. from the inside. The bias is directly placed on monitoring, so that it will be interesting both for managers and technicians. Let's start.
In our situation, the company's business is connected with the fact that we introduce the applicant and the employer. This happens on the site. Accordingly, a necessary, but, naturally, not sufficient condition for a business to earn money is that the site works.

The business also needs someone to be responsible for the fact that the site is running. Group responsibility does not exist, we need a specific person in a particular position, from whom to ask the forecast, demand a decision, demand, in general, drastically correct the situation.
And there are still business requirements such that the speed of the site affects the money. And the budget, all within the budget, without this in any way.

Then we began to negotiate about what the “site works”, in general, because it is not clear.
In the first version, we agreed that we, our director, or someone else there, believe that the site works if certain scenarios take place once a minute. Those. the applicant comes, he loads the home page of the site, he does a search, the search finds at least one vacancy, the vacancy opens. A similar case for the employment scenario. And all this there is a framework for the response time - some seconds.
This approach worked for us, this is something that can be come and done immediately. To come to some site that makes external checks, program a script there, it will be processed. If something goes wrong, you will receive an SMS. This approach works, but there are problems. The problem is that he does not catch all the cases, he does not catch all the functionality that these tests do not affect the checks. Accordingly, we went a little further.

This is not the ideal option, this is how I had to explain to the business, which roughly means "the site is working." In this case, the number of errors on the site is less than 20 per second. The number 20 is taken from the head, because we know that when there are more, then, as a rule, everything explodes in us. When there are fewer, we assume that there are bugs, and on some rare pages, perhaps, the site is five hundred - we call them “background errors”, and with them the operation does nothing, they are separately viewed by the developers, but we are using SMS ' Kam do not wake up, if on the site 1 RPS pyatisotok.
Then we have a response time criterion, it is taken sufficiently with a margin, because modern sites work quickly. We have roughly 500 ms there, in fact the main pages are 100 ms, and external checks in case of problems.
We are now exploiting this scenario, i.e. we now have real-time monitoring, reading logs, watching these indicators, and triggering, i.e. if the site starts working beyond the scope of this SLA, then we receive SMS'ki and forth.

This business value, in fact, reflects indirectly. And, generally speaking, we must look at business performance. In our case, this is an activity on resumes, vacancies and responses. But in fact, this can be indirectly understood from the access log of nginx. There are cases when some error occurs on the client side, the banner overlaps the form of sending a response or something else, and from the side of nginx everything is good, but in fact everything is bad, users suffer, and the business does not get any benefit.

In fact, two departments can be fully responsible for working. In our case, this is a maintenance service and a development department. This is no good and we will continue to figure out how to decide. For incidents, SMS'ki developers never subscribe. Admins get a surcharge for being harmful because they receive SMS at night. We will try to decide how, in general, to solve this, so that it is understandable both for business and for exploitation and for developers, what is happening.
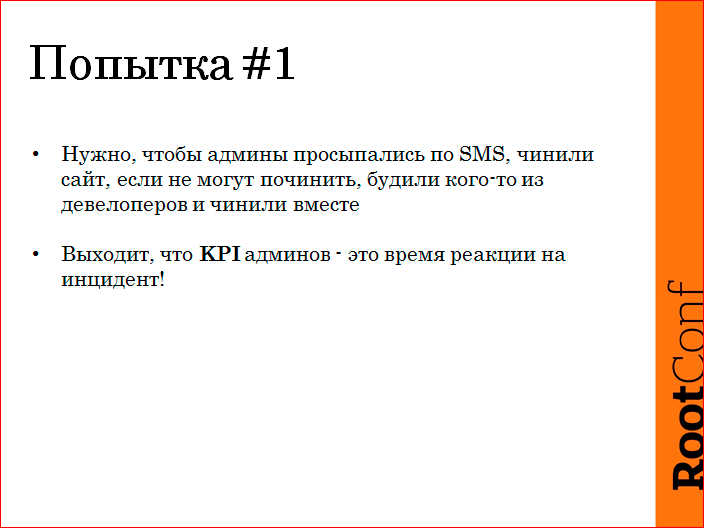
The first idea we had was that the admins get an SMS, they go to fix it. They have the coolest developer phones. In case they do not understand what is happening, they call them, repairing them together. But in this case, the KPI indicators are the work of the admins themselves - here you can isolate only the reaction time to the incident. We lived like this, it was like this in the years when there were few problems, when we spent a little more time on infrastructure, we lived normally.

Then he stopped arranging, we came to the situation that the business does not receive real profit, and the admins have completed their KPI, i.e. woke up quickly, pressed on “OK” quickly - like, we started to deal with the problem. In fact, the site lay for a long time, because they were not motivated in any way on how much they would repair.
Attempt # 2, which we did not even try:
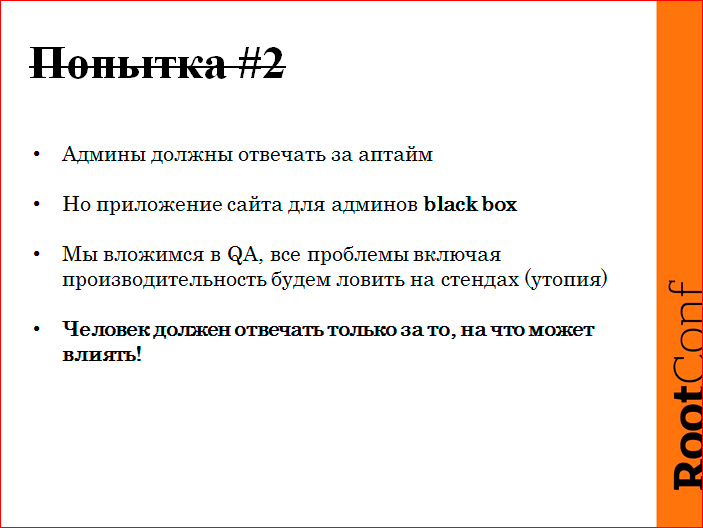
There was an idea from above, from the side, I do not remember where she came from, that admins should be responsible, in general, for the entire uptime. But my objections that: “Guys, well, there is a big complex application, it falls, flows ... Admins cannot respond, they cannot influence it, this is for them a black box”. They answered me: “Give you a whole QA department in the service department of shoving. Everything that they tested is your responsibility with them. ” In fact, a good QA, in general, is difficult, expensive, and weakly real. In the end, we decided that we would not do this. I insisted that a good KPI can be done when a person can influence it. Those. if he realized that "here I was adjusting, then I was corrected, I was good, I would get a bonus."
That's what we came to:

We divided the whole uptime into classes, into areas of responsibility. Identified some classes of problems. Admins are responsible for what is real in their area of responsibility, what is really possible to take and fix. What to do with everything else, was not solved, now it is such a hanging question. I will not touch, but there you will understand, approximately.
So what needs to be done?
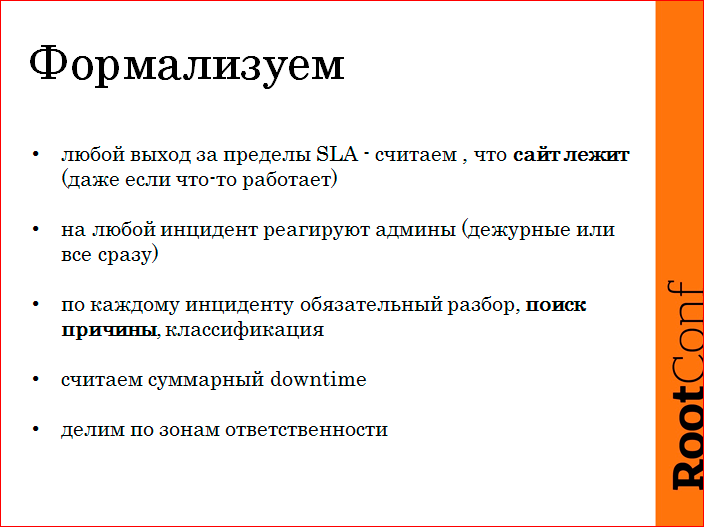
It is necessary to set some framework, conditions so that everything is clear and transparent to everyone. We agreed on the SLA, that such a “site works”. If the indicators are met, everything is fine; if not, the incident. If the site is not completely in order, although some functionality still works, then we believe that it is still a problem, downtime, and the site is not fully alive.
Administrators are still responding to any incident. For obvious reasons. We do not single out those on duty, we are too few, everyone wakes up, but whoever is first is the one who starts. If necessary, then tightens the rest.
For each incident necessarily analysis. We must, we must get to the bottom of the cause, we cannot say that, like, it was an underground knock, etc., everything, we know nothing. We have to do this. Further I will show how we ran into.
We have a reporting period - a quarter, we fix the entire downtime for the quarter, divided into classes. We divide by areas of responsibility. Admin downtime - classes of problems that we have identified are tied to it:

- The first is the problem during the release. This is either a bad code goes into production, and everything explodes. Either this calculation procedure is wrong, and at the time of the calculation of something there is five hundred, or something tupit. We classify such things as release issues.
- Error in the application - this is the case when the application worked, worked, then exploded and stopped working. The reasons can be very diverse, ranging from leaks, to the fact that a request came to some evil URL with some evil parameters and put everything. Somewhere there was a remote resource frozen, timeouts did not work, and so on ...
- Iron, network, channels, DC - this is what is associated with hosting, we are responsible for this, admins. The human error here is only admin's, because the developers for the prod, where you can mess up, do not have access.
- We have identified the problems with the database separately because we outsource the DBA. This is an interesting class of problems for us; we want to consider it separately, so that we can draw some conclusions.
- We did a planned downtime, because without this we can. Nobody guarantees 100% availability to anyone, but the planned downtime has limitations and must be announced in advance. This should be done during the hours when the load is very weak, as a rule, at night.
- Monitoring error is a necessary measure, sometimes it happens that a bot came, 50 errors per second were sent, users were not affected, this is not a problem at all, it didn’t affect anyone, but we have to confirm this by logs. And in order not to remove false positives, incidents, never, we have made such a class, it does not in fact count downtime, but it is.
Admins. Their areas of responsibility include these three classes:

This is all that is connected with hosting, all that is connected with a human error, and problems with databases, because this is almost hosting, this is an infrastructure thing, developers are not responsible for this.

Here, we really made KPI motivation. The premium that a person will receive at the end of a quarter is actually a function of uptime, but in his area of responsibility. Everything is fair. The tablet was made up of about such messages that it is embarrassing to lie more than three hours a quarter, so we won’t get the bonus. If we provide 4 nines per quarter in terms of performance, we are great and we get an increased bonus. And then the middle was somehow proportionally divided. That's the way we really live since January 2013.
What, in general, to do with it? How did the deployment happen, and what did we learn? We are in December, before leaving for the New Year, for a long, long time, we monitored the monitoring, turned it on and started raking it. If we consider everything, everything, everything, we have set ourselves thresholds, we have to cope with it, we really had to work, and before that we did not understand what.
In the very first weeks, we realized that we are very messy in terms of what we are doing at all, without thinking, and this will affect the site. All pyatisotochka counted, so there will not be fooled. Learned to think, learned, if in doubt, take a planned downtime and do something at night. This really removed a lot of problems, noticeably. We also began to doubt that we have done everything correctly, we began to conduct real exercises. Those. we declare downtime, we nail the master of postgres. And notice how much we can handle to expand everything. There are replicas, everything is extinguished in a godly way, but real combat exercises with a case.
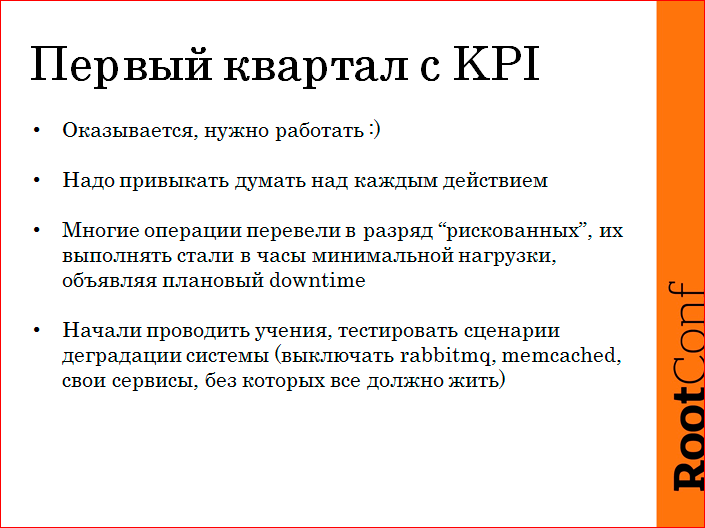
Turning off various services, without which the site should work, because we once got involved in Service-oriented architecture and divided into services, some basic, some non-basic. They began to cut down non-essential ones, and the site’s timeouts were incorrectly made, so everything lays down. In general, the horror, how much we just fixed for the first quarter.

Logrotate gave five hundred, because they started at the same time. Crony pyatisotili ... Ie what we just do not rake. In nginx, retracts were set up at half-defaults, timeouts - all this had to be removed and repaired. We have greatly redone the warmth. We even forced the developers to redo all the work with queues, i.e. so that any queue can be normally repaid, and this does not affect anyone.
The most difficult thing is to find out the cause of all fakaps. Those. whatever happens, you need to get to the bottom. Of course, at first it was not possible, the logs are not written in such detail as we would like, it was necessary to somehow try, to test some hypotheses on the stand, to do some load cases. Then, somehow, in the first quarter, everything settled down, and we started to cope about the task successfully.
In particular, we have ceased to arrange current monitoring. Our requirement was to find out that the problem had happened. The most important requirement. This should always work reliably, i.e. if outside of the SLA are out, everything, alert, SMS, all that.

To see what is happening, literally in half a minute to understand how much the problem affects all or not all, what kind of service ... Because the infrastructure is large, we don’t have time to row the logs. Having enough metrics to backdate is what played the last drop. We lacked metrics. We see - the CPU jumped, but what was it, who came, which one launched the script, or what was happening on the server, which process ate this CPU? This had to be done retroactively, because it happens that there is a problem, at the time of its repair we restart something, we understand that it hurts somewhere, we restart it, fix it, we don’t know the reason, but then we have to find her. Accelerate problem solving, because time depends on uptime, we want more money. We put some typical things out of the logs on charts in order to speed up stupidly. And the simplicity of expansion, because someone offers, like, raked up some incident, realized that this metric will help next time, this metric, for example, is written in the logs - you need to be able to quickly hook it up on the chart.
I, probably, have been working in the company for the seventh year ... What we have in the whole history has been:
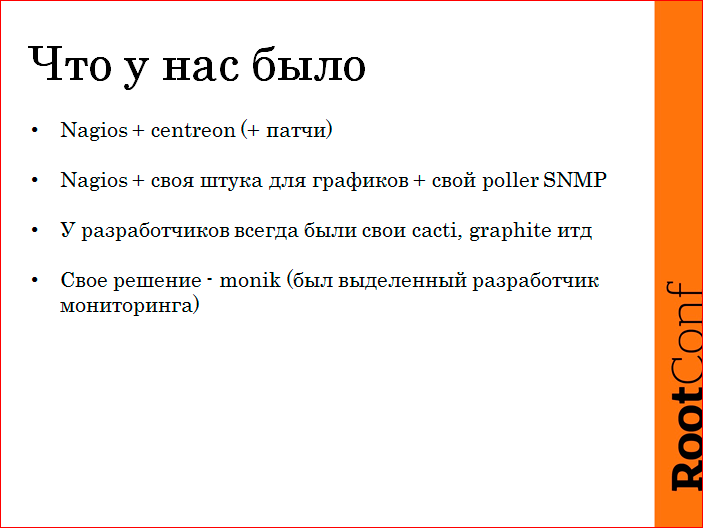
We had Nagios, there was such a thing, a French fake, I don’t know, it is still alive, centreon is called, these are the graphs that are drawn on Nagios. We patched it, then we threw it out and wrote ours. Then Nagios bent at us, we wrote our poller SNMP. At this time, the developers, when they need to draw some specific metric, they are sawing some script that cacti, graphite sends something ... Because our monitoring, we have to ask us for a long time to include something there ...
Your decision. We had a developer, he sawed the monitoring year. Everything was good, he met our requirements, then they changed, we realized that we need to throw out all the nafig.
And they understood that it is necessary to write anew, because the whole concept has changed, our requirements have changed, everything has changed, the world has changed.
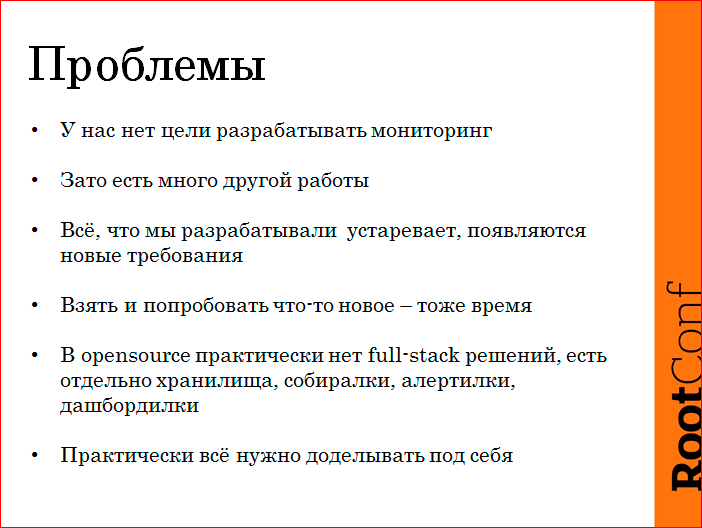
Moreover, we didn’t have time to spend time on developing monitoring, and we didn’t want to do it. This is quite an interesting work for those who like tsiferki, in the store to put-get, all this here. In fact, we have a lot of other work, we need to repair, we need to optimize something somewhere, we have a lot more buzz when the histogram of response time turns green, rather than the fact that we have a new beautiful schedule. We wanted full stack, i.e. to collect from graphite, etc., from plasticine and toothpicks, some solution can be collected, I have no doubt. But it is necessary to put the person to take and collect it all. Moreover, we had such solutions, we collected them, but then, when it broke, the dude was no longer so interested to fix it. Because he collected, he drew a graph, but, in fact, when there half of the data moved out, he had to go to some logs to see, agents to check. In general, horror.
And we have higher than average requirements, we want to watch a lot of things, we had to finish by ourselves.
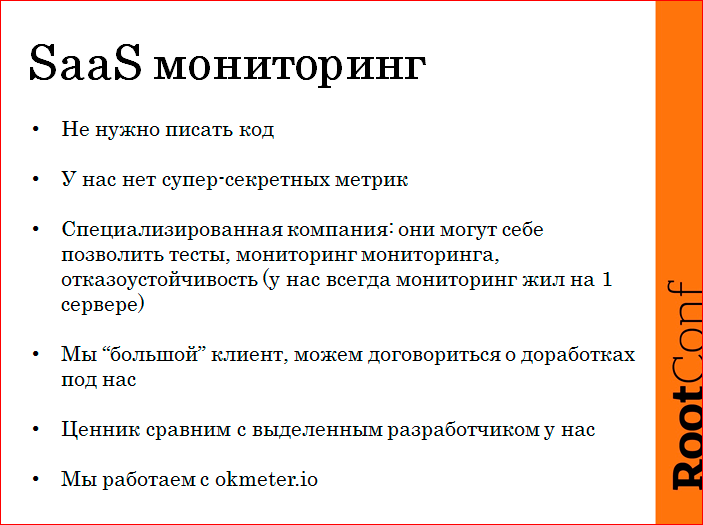
We decided that we would not do this anymore. And we live well for half a year. We took SaaS. First, do not need to program - it's a thrill.
Secondly, we are not constrained by any laws on banking secrecy, there is no personal data in the monitoring, we send impersonal metrics there, and we are not averse to releasing them beyond our perimeter. Well, RPS, so what? Even competitors are, in principle, uninteresting.
We have never been able to afford reliable monitoring. In particular, monitoring monitoring is needed, because everything is tied to this. If we learn about the problem not from SMS, but from the support call, this is shame and disgrace.
Monitoring requires tests, this is software. Releasing, breaking, rolling back is also a task. We can bend a contractor or service, because we are not a small client, we have interesting tasks, we have an interesting expertise, we give interesting feedback. In fact, as a result, the price tag is comparable with the dedicated developer, given that this developer had me a project manager, I was QA, I was a monitoring exploiter. Those. total service costs almost cheaper.
We use okmeter.io. And everything suits us.
Next, I would like to talk about, not how to store metrics, but what needs to be removed, what to look at to solve problems. What are the problems with metrics? People come and say: "We are now crowding our core." They monitor the main services, the main backends, everything else is forgotten, until the end it is very difficult for people to finish some task. Therefore, we need some kind of approach.
We tried to include monitoring in the regulations, it does not work, because the dude is watching: “Yeah, in order for me to release the service, I need to cover it with monitoring. What is a monitored web service? Probably, to check that his port is open and that's all. ” Those. formally, the requirement is fulfilled, but, in fact, no one included the head. This, of course, can be solved by the fact that people need to slap or something else, but it is better to somehow systematically solve it.
Often, not all are removed, because some subsystems need to separately configure the removal of metrics from them. In particular, jmx should be enabled in Java, a monitoring user should be started up in postgres, etc.
The infrastructure is constantly changing. Those. services are started, something perekolbasili, new virtuals, new services, somewhere backend covered nginx, somewhere HAproxy set, many operations occur in emergency mode, so keep track of everything - the problem. It so happens that the metrics seem to be collected, but you can't understand them a damn retroactively, because they are common. Those. there someone gobbled up the IO disk, well, who, I can't go back, the linux log does not write who the CPU was eating ...

We have this approach.
Everything that we can remove without a config, we always remove. Here I am talking about what we asked our service to do for us. This concept came from us, the implementation is not ours. I will tell you, maybe you just take an approach on your decisions. All that can be removed without a config, we remove from all machines. Whether it is necessary or not, let it be.
If the agent sees that he needs a donation, or he needs access, this is an alert in monitoring. Admins cool alert alerts, this is what they do well. There is a light bulb, he did something, the light went out - the buzz. Those. admin performs such work well. Those. how test driven development, the test fell, the test was repaired, everything, the problem is solved. In this case, about the same.
We remove metrics as detailed as possible, within reason, i.e. if it is a question of removing the response time, the total is good, but we want by URLs. There are a lot of URLs, we thought and thought and asked to make a top. We remove the timings of the URL, but those that are more than 1%. That's good. But we can get to the bottom, where tupil, where not stupid in hindsight.
We are also waiting for autodiscovery to be, but not in terms of what is accepted, and we are shooting a lot about TCP, we see where the services are with whom we interact. If we caught some IP that is not in monitoring, the agent is not there, there are no metrics from it - an alert. Monitoring will light a bunch of light bulbs for us, we will fix it all, and he will check it every minute, it's cool.
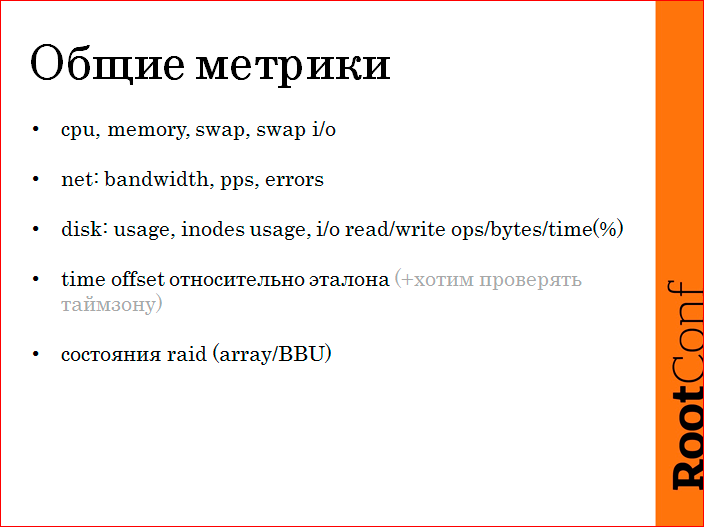
What are we shooting? I constantly ask the admins at the interviews what needs to be removed so that something is clear. It was my turn to answer this question. Standard metrics that remove everything. CPU as a percentage, all sorts of memory, shared, cache, and more. Swap, swap i / o (required). Over the network - packet rate, errors. By disk - disk in capacity, use inodes, i / o operation per second read / write. In traffic - read / write, and the time that the disk was occupied by i / o, i.e. It can be said that this is a percentage of i / o. With all the machines, the time offset is required relative to the standard, because it can even cause a business to lose if time is running out. It's easier just to shoot it everywhere once, set up a trigger, and make everything good. The states of raid arrays, batteries, and operations that go there.
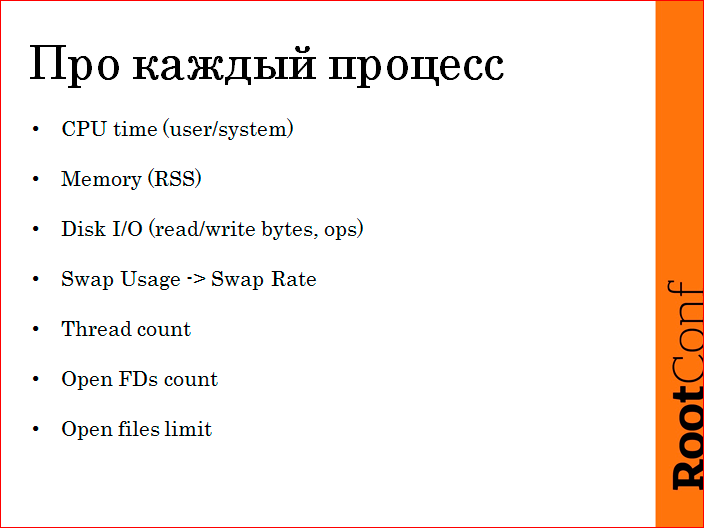
Further more interesting. About every process. Rather, about each process, specifically grouped by executable and user. We measure CPU time, i.e. time spent by the processor in the context of user / system; memory, disk i / o for each process, how many write / read operations, how much traffic per disk, swap for each process, swap rate for each process - this, in general, helps us a lot. The number of threads, the number of open file descriptors and the limit on file descriptors.
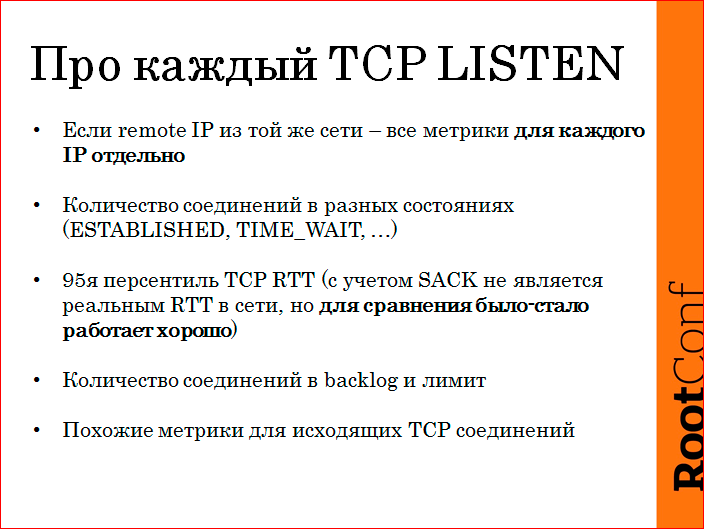
About TCP. If we look after all listen socket, if we see that its connections on that side have IP from our local computer, we remove about each IP separately. We remove the number of connections in different statuses: ESTABLISHED, TIME_WAIT, CLOSE_WAIT for each IP, again. We measure RTT. We need RTT, because, in fact, it says absolutely nothing about the speed of your network, because there is only a selective TCP window, but to compare that the network worked well here, and the network works poorly, it is quite normal for it . Moreover, having good detailing of metrics, we can judge how the network worked between two nodes in the network. Not abstractly, “we have ethernet connected there well,” namely, “this machine interacted with this one before the fax like this, during the backup — as such, after the backup — like this.” Also for all listen we take backlog size downbut on accept and its limit. Similar metrics for outbound connections.
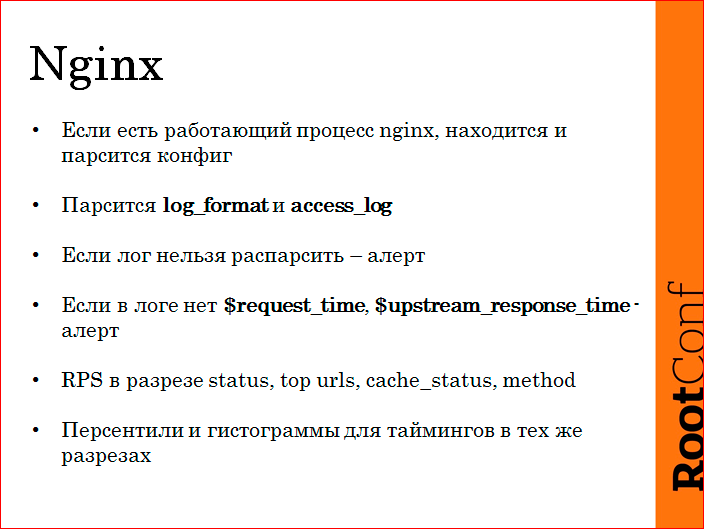
Nginx We have nginx not only on the frontend, but also inside, we have internal balancing on it. And there is a repository of any custom photos, the portfolio is made on nginx. Often there was a situation when we forgot to parse the logs, so we parsed the logs automatically. If nginx is working on the machine, the agent finds its config, reads access_log, understands its format, configures the parser, knows all access_log'i in person and starts parsing them. If there are no timers, or log_format is designed so that it cannot be parsed, it happens in the upstream_response_time area, they are comma-separated with spaces, in general, it happens that it is impossible to parse it. An alert appears in the monitoring, we change the log_format, the alert goes off, we all know, we have full access_log with all the timers in good sections. We remove RPS by statuses, by top URL, by cache status,by the method. Around the same layouts, we remove the timings.
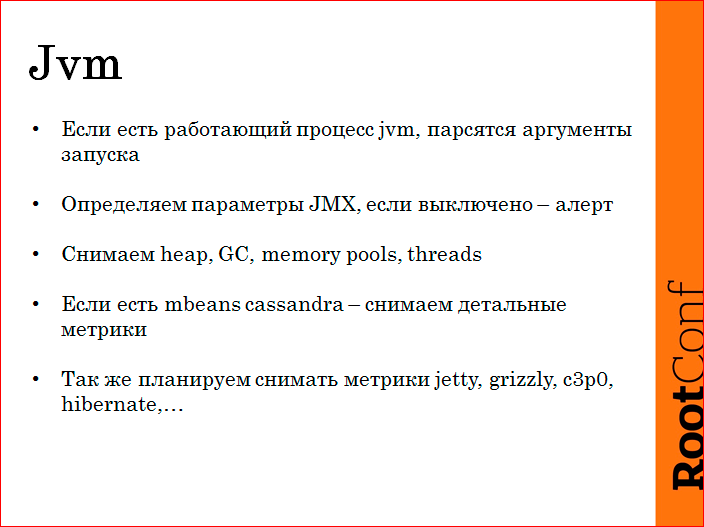
Jvm We have more than half - this is Jvm. Jvm is also autodetecting, trying to figure out where its JMX is. If JMX is turned off, it is an alert. If inside we find something interesting (cassandra), then its metrics are removed, we have an installation cassandra. We remove metrics about heap, about GC, about memory pools, about threads. Standard there are not many options, which is removed. But we demand that JMX be included everywhere, because somewhere is on, and somewhere there are suspicions of GC, we arrive, there are no metrics. Problem.
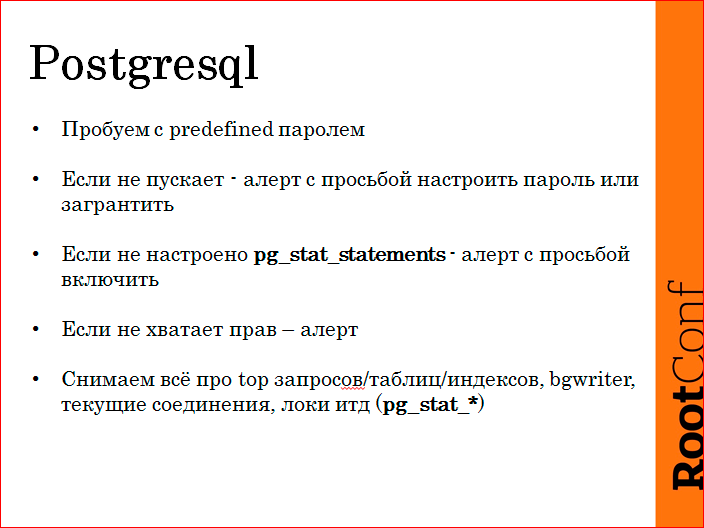
About Postgres. We have Postgres. Also, the agent is trying to log out and remove all metrics. If it fails, it is an alert. Alerts are fixing. Moreover, monitoring requires that pg_stat_statements be enabled there, because we are removing good analytics using sql queries, and this allows us to drastically reduce the base repair time. Not enough rights - alert. We remove about requests, about labels, about specific indexes. There is some kind of logic, it is not so important. It is important that a lot of metrics, and then digging well.
Metrics from logs are removed like this.
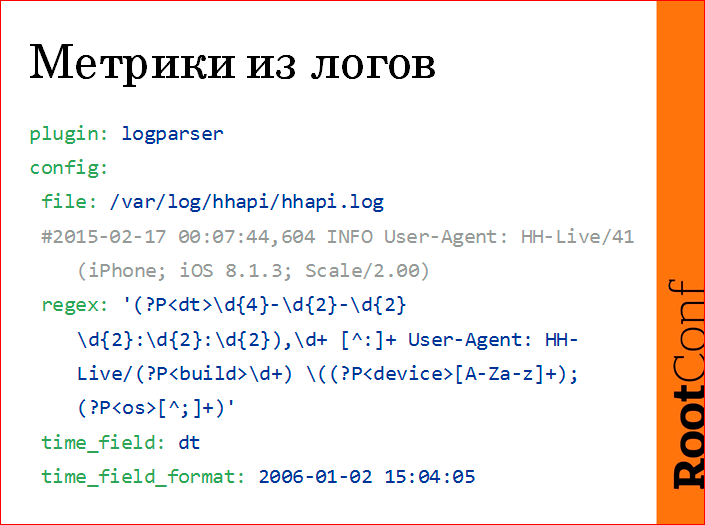
There is a log, we write regex with named groupings, then from these named groups we make a metric.
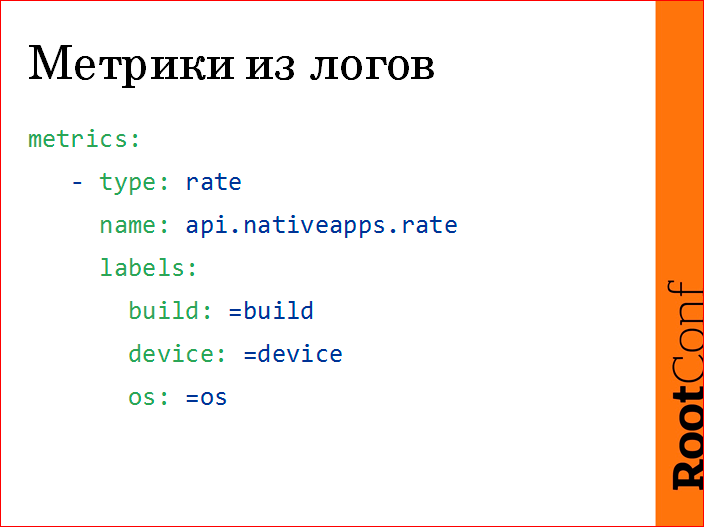
In this case, this is the number of calls to our API from the mobile application. We fired the application version, we fired the user device (iphone, ipad, etc.), the version of the operating system.
After that, we can immediately make the following schedule from this:
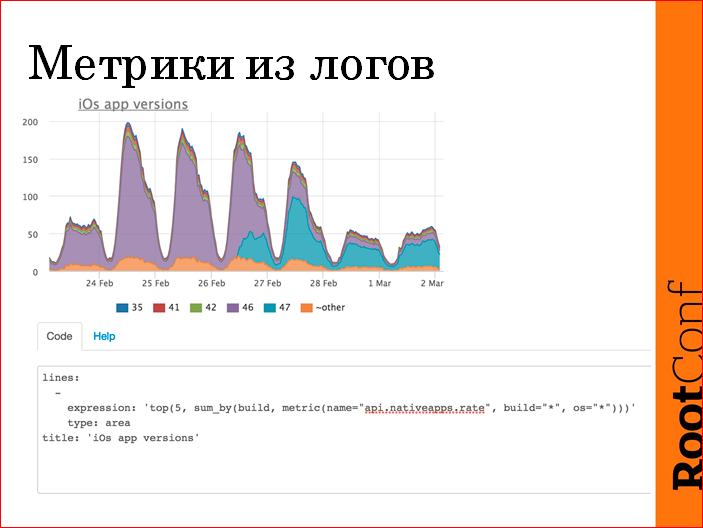
In this case, the log is simply parsed, the business value is normal, we released a new version of the application, and see how it has been updated by the user in time. We see that on the first day a third of the users started up, in three more days they all crawled on the 47th. Around the web, it looks like this. We have a query language there, the aggregation of metrics is done on the fly. Accordingly, we hang all the triggers on all this later.
Metrics from SLQ. A terrible request, but honest, as it is.
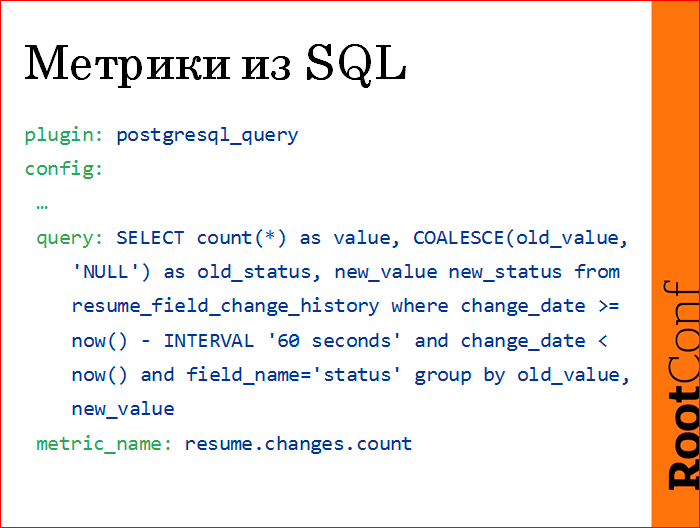
Just write the config, write your custom sql query, it returns some lines, one column should be called value ..., and the second column is the specification of the metric. In this case, we count the number of resumes, the number of transitions of resumes from one status to another in the last minute. We remove it once a minute, we get the resume.changes.count metric.
We make this schedule:
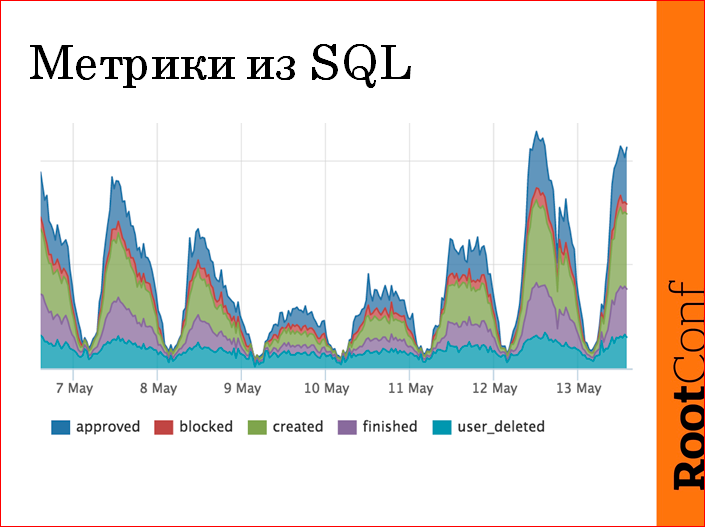
Those. how many resumes, how they change. If something is stuck somewhere - a failure on this graph, if we are five hundred - a failure on this graph. These are our main indicators, I did not draw an axis here, because I was told that this is a secret. But then, when we checked this thing, we noticed that at 4 o'clock in the morning there were transitions of resumes to moderated ones, and we had moderators mainly in the Moscow timezone. We began to understand, and really, some kind of aunt (we have moderators, mostly, these are aunts on maternity leave, HR'y) began to feed the child and decided to moderate the resume. She was alone, so we realized that she moderated 4 resumes in 10 minutes. But really found an anomaly.
Further about triggers. I'll start with the principles. Because the specific triggers all have their own.
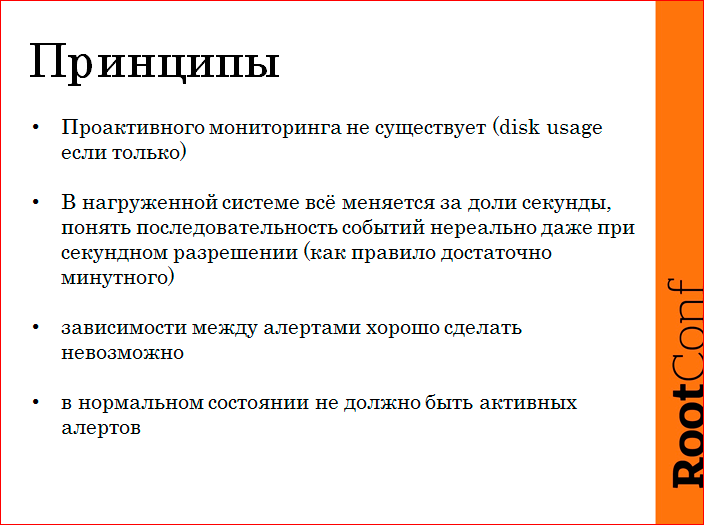
We have the following messages:
- , . , , .
- -, , — , 100 . , Hadoop' . , , , .
- , . Zabbix : « , , ». , . .
- .
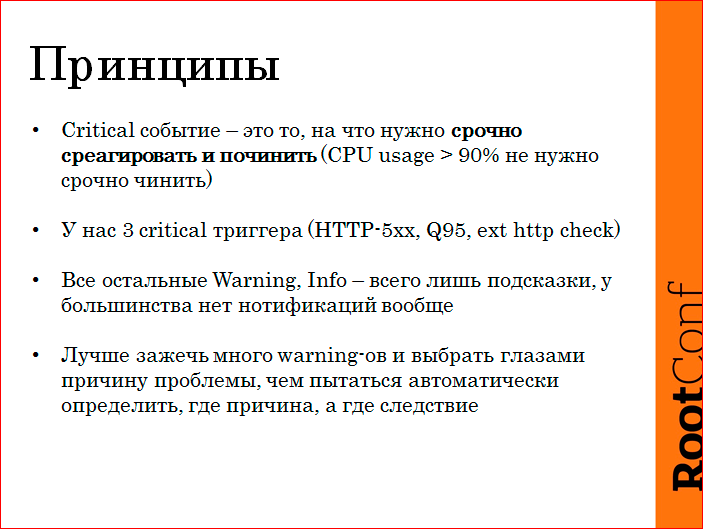
A critical event is something that needs to be fixed right now. Critical can't wait until you have lunch. If you follow this principle, here, let's say, we don’t need to repair the CPU right now, if this does not affect the users of the site. Therefore, no SMS'ki that "Critical CPU" we do not have.
We have only three critical triggers - those that have been described for business. These are five hundred, this is the time of the answer, these are external checks. The rest is clues, when a person comes to repair, or sometimes during work hours, the guys look into monitoring, and if any warning lights up, then we fix it. But, in fact, we don’t even send them to the post office, because it’s not necessary.
It is better to ignite a lot of triggers, within reason, because a person within 20–50 minutes of a warning’s parsit is normal and can distinguish garbage from nonfigy eyes.
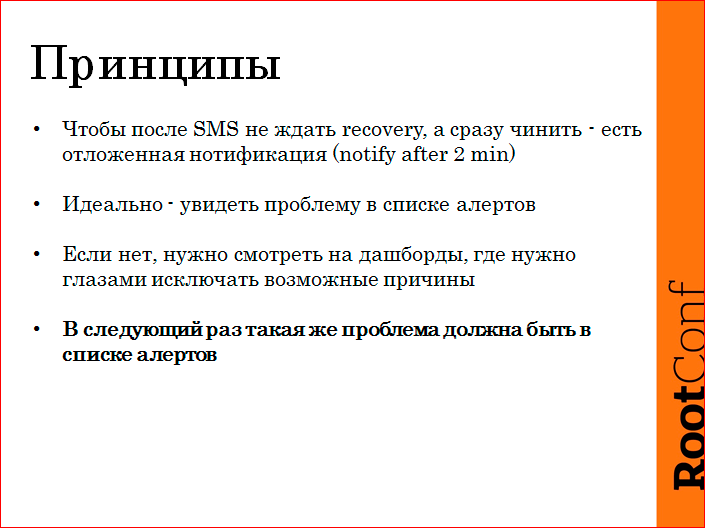
Often there is a situation that you are asleep, you receive an SMS, and you do not dare to get out from under the blanket: "Well, damn, if recovery comes in a minute, then I will not even get up." We have given this responsibility to monitoring, we have a notification, if the alert has already been running for two minutes. Because even if you want to be notified after 10 seconds, in fact, you will reach the computer in five minutes, then while you wake up, while you open SSH, while the alerts are parsed. Those. these two minutes do not affect anything and, in fact, there is no great value to alert right away. Therefore, we decided here and so. But dudes know, if an SMS arrives, everything has to be repaired, everything has already broken, recovery will not be.
Ideally, when the reason is in the list of alerts, warning'i. And if not, there are dashboards, there are charts, because not for everything you can come up with adequate thresholds and all the cool math to detect failures, commissures, etc. But we are trying to make the same problem next time visible in alerts.
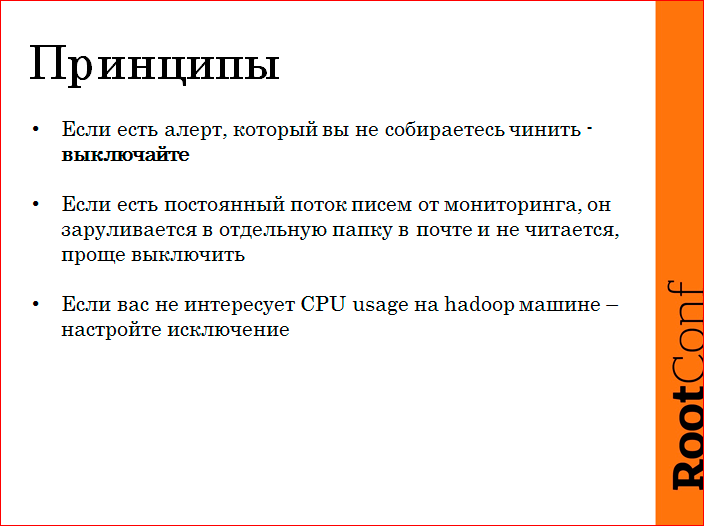
Important: if the alert is on, and you are not going to repair it, turn it off, because if you know that your monitoring is clean, some kind of light bulbs start to burn, all you need to repair, bring it to a clean state. This is a cool principle, sometimes difficult with it, you need to overcome yourself. But if we don't fool ourselves, it's easier. Those. in this case, if you constantly receive a ton of emails from a daddy that no one ever reads from a zabbix or some other vaguely monitored monitoring, it's easier not to deceive yourself, turn off, set up an alert. If the CPU on some machine does not interest you ... In fact, the CPU is also a good trigger, but it is good when you solve a problem. I do not want to receive a letter about the CPU.
Our triggers to finish specifics:
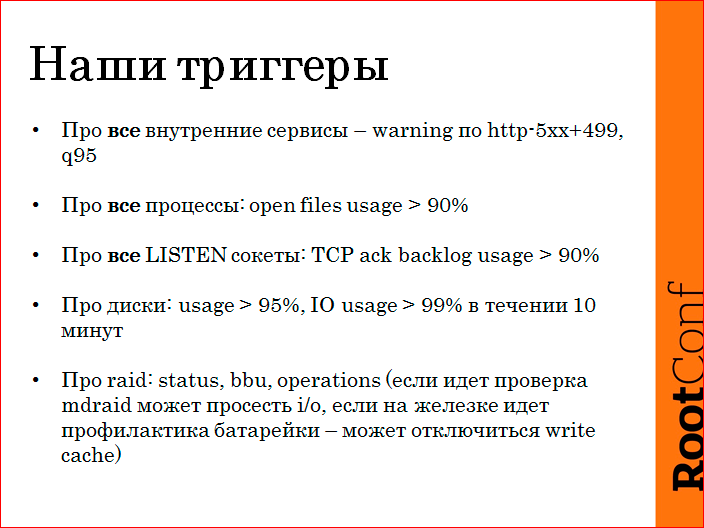
All internal services are made up of balancers, they have the same basic critical warning on the nginx logs, five hundredths, timeouts, response time.
All open file usage processes are the ratio of open handles to the limit, because we have stumbled 25 times on "too many open files" in the log. Everything, we have closed for all absolutely processes. If it lights up for something unimportant, we just use our hands, we have the opportunity. Chistyakov swore that it was necessary to suppress the alert, we have such a thing, we just extinguish the unnecessary alert, and that's it, it never arises again.
For all LISTEN sockets, we measure backlog. Accordingly, if the application starts to blunt and ceases to accept the connection, we know. Again, we configured one single config for all LISTEN sockets. If somewhere a minor Redis begins to rest on this, we simply close it. But we know that if an ass happens somewhere, it will be highlighted to us in monitoring.
About disks, we remove usage. IO interests us only if it is in the bar for 10 minutes. and more. These are hints that also help to understand something.
About raid. It is worth noting here that if there are any consistency check operations, it can affect IO on the software raid, so we have a light on, if there is some kind of battery prevention, there are some cases with glands, it can cut down the write cache. We just want to know that this is happening.
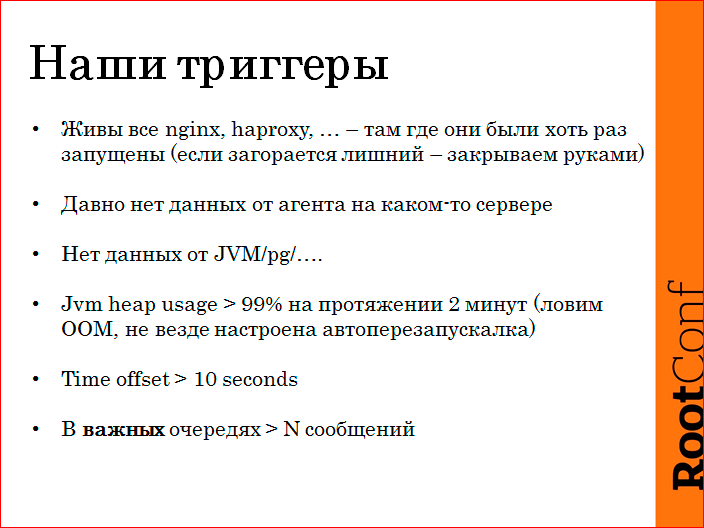
- nginx, haproxy , . .. : «, -, - -». : « nginx». nginx , , . - nginx, , , . , , , - - , .
- - — warning.
- JVM, Postgres .. — warning.
- Heap usage> 99% is a warning for two minutes. We are thus trying to catch out of memory in Java, because there is an option that it restarts, and not everyone is configured. We just set up a trigger and the next time, if we find such a place, we will fix it. Such monitoring driven exploitation.
We measure time offset and important queues.
An approximate incident, what happens?
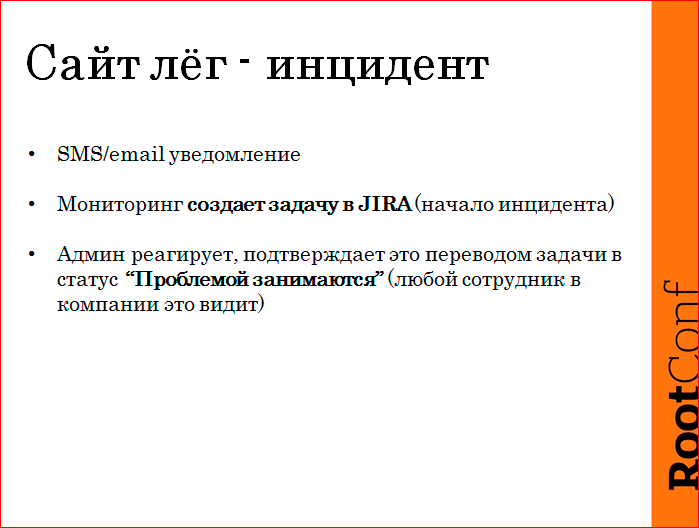
SMS occurs. At the same time monitoring starts a task in JIRA. Required.In order to count and keep there some kind of workflow. At the same time we believe that the incident began. Admins wake up, they have to come to JIRA and click "ok" - transfer the task to the status of "problem involved". Need it why? Because the company has a support that customers call, he enters JIRA and sees: “Yeah, there is a problem, really, monitoring has started, that everything is bad. And Kolya Sivko woke up and repaired. ” He says to the client: “We’ll fix everything, everything will be soon.” And no one deceived anyone. Cool.
We do something like this:
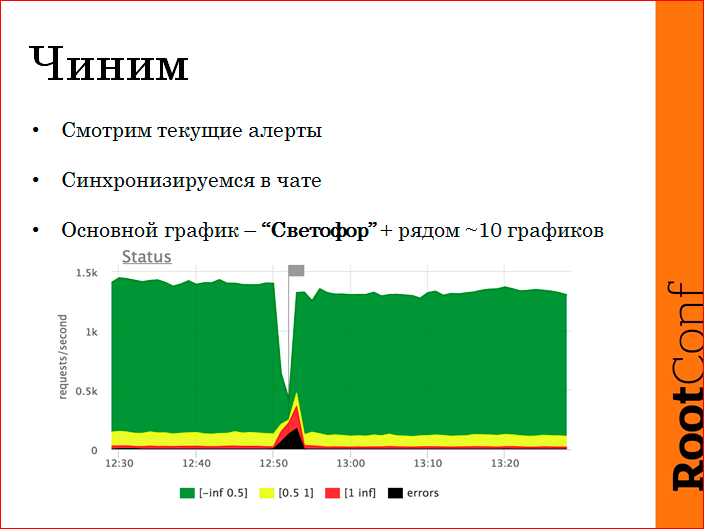
We look at current alerts, synchronize in chatika. While the incident is not closed, nobody writes anything to JIRA, because long, dreary, all this later.
Our main schedule is to understand at a glance the state - the traffic light. Green is a quick query on the RPS scale. We have somewhere under 2000 RPS - this is from all logs, our front-side has been integrated from all fronts. Green - faster than half a second, yellow - slower, up to a second, red - stupid requests, black - errors. Naturally, it is immediately apparent on what scale it broke, what happened.
There are dashboards that show a look at the system from above, which services are listed, which URLs are specified, and which handlers are signed.
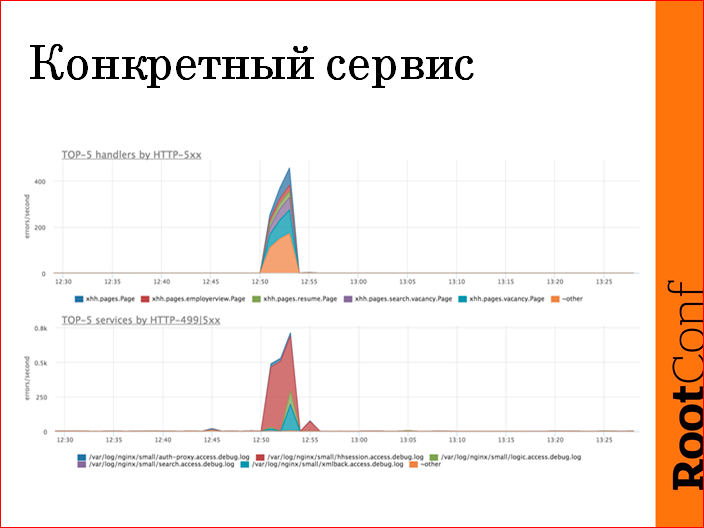
We have a lot of services, we often use top functions, because we have, say, 40 services, on the 40 areas chart it looks bad, we use “show us the top 5 services by five hundred, by errors”. In this case, this is the lower graph - it is clear that the service hhsession is five hundred, and this is the whole problem. Soone glance at the picture, we narrowed the scope of the problem to a specific service, went to its dashboards, logs, it does not matter, fixed it.
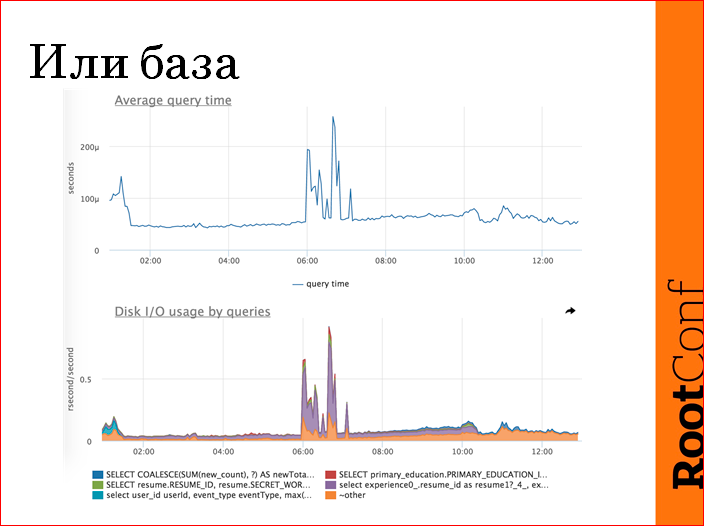
If everything is evenly affected, we have a rule to check if the base is alive. We check the base by the average response time. This is, in fact, a crap metric, but it does an excellent job with the task - to show, as the base is working now or in a different way. In this case, emissions are visible - this is a problem. We have detailed metrics on the database, in order not to jerk the DBA in vain, we try to understand if a specific request got out there, we either rollback the release, or something else, or turn off some cron, etc.
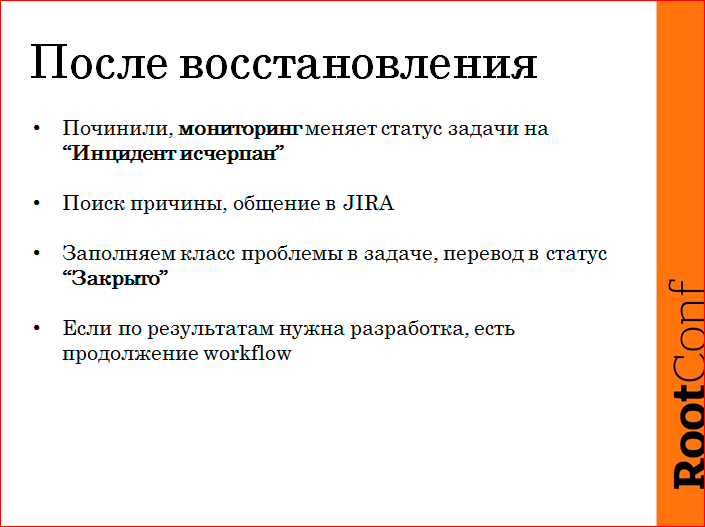
After recovery, monitoring changes the status of the task. Monitoring fixes fixes, not human monitoring. To the exact time downtime read.
Search for the cause is post factum. Because, again, repaired does not mean understood the essence. Found, in JIRA all recorded, set the task class, close the task. If there is a need for development or something else, there is a continuation of workflow.
This is approximately what JIRA looks like this:
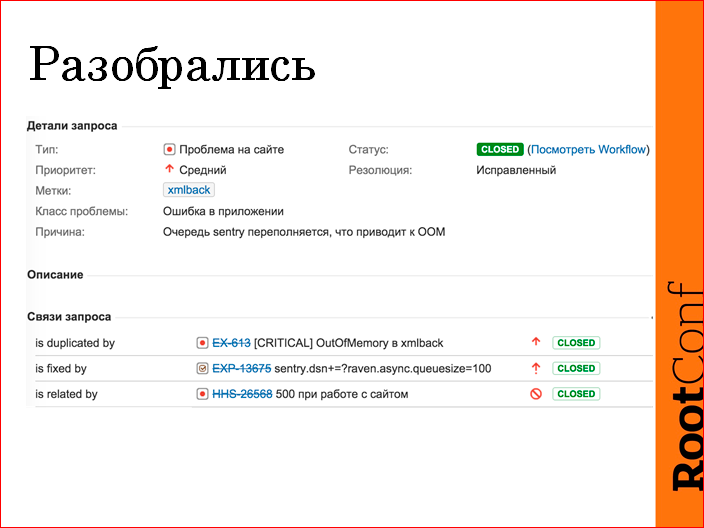
There was a problem, this is the “Application Error” resolution. Distortedly sentry. Do not put restrictions on the queue. Java has fallen out of memory. Fixed by - a task in operation, change the setting, the integration of sentry. Connected - ticket from support. And, accordingly, the problem was the second time, a duplicate.

According to the results. It is necessary to discuss all human errors. Talk to the team, see if it’s possible that a person doesn’t have to go to that place, maybe you can automate it, etc. It is important.
If there is a problem with the release, it may be as a result of changes in autotests or in the procedure of display.
The problem in the application, as a rule, translates into a task for development.
Iron / network - it is not always possible to fix something, but you need to start a task, you can reduce the likelihood, you can reduce the downtime in the future, you can provide self-healing there somehow. Those. some measures to reduce the total downtime.

And do not forget about monitoring. Maybe add metrics, maybe make more detailed metrics, maybe a new trigger, or some cool graph.
Contacts
» NikolaySivko
» n.sivko@gmail.com
» HeadHunter
company blog» okmeter.io company blog
This report is a transcript of one of the best presentations at the conference on the operation and devops RootConf .
Also, some of these materials are used by us in an online training course on the development of high-load systems HighLoad.Guide is a chain of specially selected letters, articles, materials, videos. Already, in our textbook more than 30 unique materials. Get connected!
Well, the main news is that we have begun preparations for the spring festival “ Russian Internet Technologies ”, which includes eight conferences, including RootConf . Of course, we are greedy commerce, but now we are selling tickets at cost price - you can make it before the price increase
Source: https://habr.com/ru/post/316898/
All Articles