Monitoring GPU on Windows servers (TICK + Grafana + crutches)
I had several servers at my disposal, based on Windows, which capture, encode and archive video. A key feature of this system is that coding is based on Intel Quick Sync Video, i.e. based on GPU.
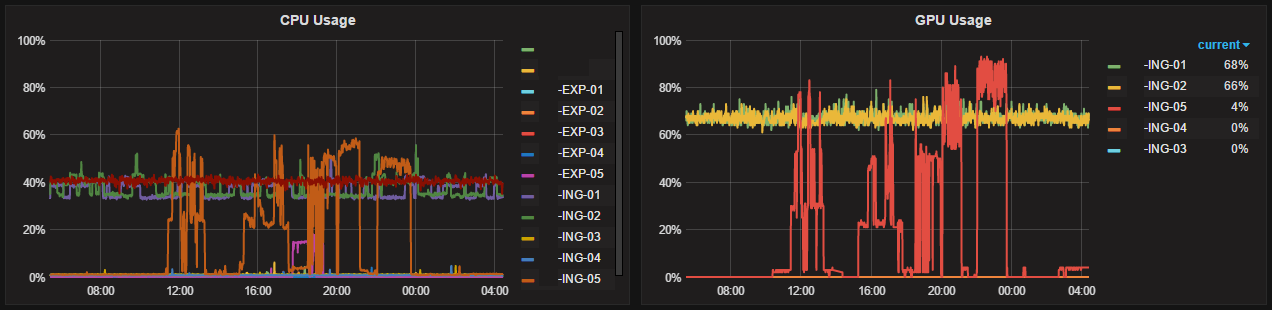
In this situation, monitoring just the CPU is no longer the main indicator of the server status, and for a complete picture you need to track the load on both the CPU and the GPU. The servers operate in real time mode, so you have to deal with streams, not files, which means that if the GPU exceeds the maximum load, video losses are possible (in the case of files, encoding will continue, at a speed less than real time), so look out for the video card necessary.
The end result, the following props and crutches, are graphs built in Grafana:
')
This article discusses TICK- based monitoring (telegraf, influxdb, chronograf, kapacitor) + Grafana , so all settings and script output are adapted specifically for this technology stack, but with some doping, everything below can be transferred to other monitoring systems. Another nuance - this implementation is made for Windows.
If everything is clear with Nvidia video cards, when immediately after installing the driver, both the console utility nvidia-smi and the subsection Nvidia GPU in the standard Performance Monitor appear on the computer, then in the case of tracking the Intel GPU, everything is not so obvious. All utilities that I came across are oriented to work in the GUI, so the first crutch appears in this place - the utility will be monitored by the GUI.
At the moment, one of the leaders among such programs is the GPU-Z utility, the presence of logging is also important.
Setting up logging in GPU-Z (tick below):

At this stage, the first difficulty appears - GPU-Z writes its log in CSV format, with a minimum frequency of 10 seconds, which affects the volume of the log file, so if you read the file line by line or entirely periodically, then because of the infinite growth, with him quite laborious.
The second crutch is to configure the rotation of the GPU-Z utility logs. The log for one day turns out to be small, and it can be quickly processed by the script, so the purpose of the rotation is small files that store information per day. GPU-Z always runs with administrator rights, when it starts automatically, it requires a circumvention of the Windows UAC protection built into it, therefore, to automate the launch of the rotation script, the Windows Scheduler is used, with the setting set to: Run with the highest privileges.

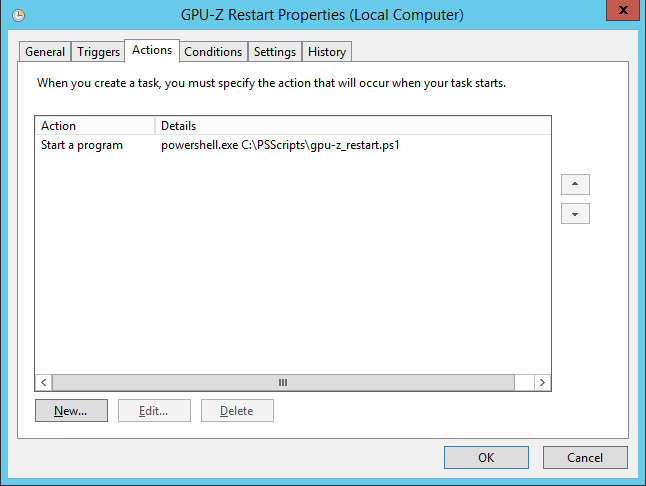
Windows Scheduler runs a script that executes a sequence of actions:
1) complete the program GPU-Z
2) move the log to the archive
3) run the utility minimized to tray
The script is written in PowerShell, and looks like this:
It turned out that during operation, the GPU-Z does not finish the log, i.e. it can be considered the same PowerShell, but the telegraf log parser does not see updates. In addition, the GPU-Z utility writes the log too often (once every 10 seconds) in my case, collecting the readings once a minute is enough. A third crutch appears at this point - a small parser was written to transfer data to telegraf, which selects the last line from the GPU-Z log and sends the data to telegraf in graphite format.
→ github.com/influxdata/telegraf/blob/master/docs/DATA_FORMATS_INPUT.md
This format was chosen for the reason that the standard for telegraf format influx does not support the substitution of timestamp, I also want to see an honest timestamp from the log, and not generated at the time of reading the line. In the following script, this is taken into account, and the timestamp from the log is converted to unix time, in accordance with the graphite format.
Script again on PowerShell:
This script is launched by telegraf itself, once a minute, according to the following rule:
As a result, the TICK system collects data reflecting the state of the GPU, on the basis of which you can either set up monitoring or, as in this case, make graphs, for analyzing work and analytics.
In this situation, monitoring just the CPU is no longer the main indicator of the server status, and for a complete picture you need to track the load on both the CPU and the GPU. The servers operate in real time mode, so you have to deal with streams, not files, which means that if the GPU exceeds the maximum load, video losses are possible (in the case of files, encoding will continue, at a speed less than real time), so look out for the video card necessary.
The end result, the following props and crutches, are graphs built in Grafana:
')
This article discusses TICK- based monitoring (telegraf, influxdb, chronograf, kapacitor) + Grafana , so all settings and script output are adapted specifically for this technology stack, but with some doping, everything below can be transferred to other monitoring systems. Another nuance - this implementation is made for Windows.
If everything is clear with Nvidia video cards, when immediately after installing the driver, both the console utility nvidia-smi and the subsection Nvidia GPU in the standard Performance Monitor appear on the computer, then in the case of tracking the Intel GPU, everything is not so obvious. All utilities that I came across are oriented to work in the GUI, so the first crutch appears in this place - the utility will be monitored by the GUI.
At the moment, one of the leaders among such programs is the GPU-Z utility, the presence of logging is also important.
Setting up logging in GPU-Z (tick below):
At this stage, the first difficulty appears - GPU-Z writes its log in CSV format, with a minimum frequency of 10 seconds, which affects the volume of the log file, so if you read the file line by line or entirely periodically, then because of the infinite growth, with him quite laborious.
The second crutch is to configure the rotation of the GPU-Z utility logs. The log for one day turns out to be small, and it can be quickly processed by the script, so the purpose of the rotation is small files that store information per day. GPU-Z always runs with administrator rights, when it starts automatically, it requires a circumvention of the Windows UAC protection built into it, therefore, to automate the launch of the rotation script, the Windows Scheduler is used, with the setting set to: Run with the highest privileges.
Windows Scheduler runs a script that executes a sequence of actions:
1) complete the program GPU-Z
2) move the log to the archive
3) run the utility minimized to tray
The script is written in PowerShell, and looks like this:
$gpuz = "GPU-Z.1.12.0" $gpuzlog = "C:\Program Files\GPU-Z\log\gpu-z.txt" Stop-Process -Name $gpuz -Force $logname = $(Get-ChildItem $gpuzlog).Name $archivelogname = (Get-Date).AddDays(-1).ToString('yyyy-MM-dd') + "_" + $logname $archivelogdir = $(Get-ChildItem $gpuzlog).DirectoryName + "\" + (Get-Date).AddDays(-1).ToString('yyyy_MM') $archivelogfile = $archivelogdir + "\" + $archivelogname New-Item -ItemType directory $archivelogdir -Force Move-Item $gpuzlog $archivelogfile -Force & "C:\Program Files\GPU-Z\$gpuz.exe" -minimized It turned out that during operation, the GPU-Z does not finish the log, i.e. it can be considered the same PowerShell, but the telegraf log parser does not see updates. In addition, the GPU-Z utility writes the log too often (once every 10 seconds) in my case, collecting the readings once a minute is enough. A third crutch appears at this point - a small parser was written to transfer data to telegraf, which selects the last line from the GPU-Z log and sends the data to telegraf in graphite format.
→ github.com/influxdata/telegraf/blob/master/docs/DATA_FORMATS_INPUT.md
This format was chosen for the reason that the standard for telegraf format influx does not support the substitution of timestamp, I also want to see an honest timestamp from the log, and not generated at the time of reading the line. In the following script, this is taken into account, and the timestamp from the log is converted to unix time, in accordance with the graphite format.
Script again on PowerShell:
$gpuzlog = "C:\Program Files\GPU-Z\log\gpu-z.txt" $loglaststring = Get-Content $gpuzlog | Select-Object -Last 1 $timestamp = $loglaststring.Split(",")[0] $unixtimestamp = [int64]((Get-Date "$timestamp").ToUniversalTime()-(Get-Date "1/1/1970")).TotalSeconds #GPU Temperature [°C] , GPU Load [%] , Memory Usage $gputemperature = (($loglaststring.Split(",")[1]).Replace(" ", "")).Split(".")[0] $gpuload = ($loglaststring.Split(",")[2]).Replace(" ", "") $gpumemoryusage = ($loglaststring.Split(",")[3]).Replace(" ", "") Write-Host GPUZ.psscript.GPUTemperature $gputemperature $unixtimestamp Write-Host GPUZ.psscript.GPULoad $gpuload $unixtimestamp Write-Host GPUZ.psscript.GPUMemoryUsage $gpumemoryusage $unixtimestamp This script is launched by telegraf itself, once a minute, according to the following rule:
[[inputs.exec]] commands = [ "powershell.exe C:/PSScripts/gpu-z.ps1" ] separator = "." templates = [ "Utility.measurement.field*" ] interval = "1m" timeout = "10s" name_suffix = "_gpuz" data_format = "graphite" As a result, the TICK system collects data reflecting the state of the GPU, on the basis of which you can either set up monitoring or, as in this case, make graphs, for analyzing work and analytics.
Source: https://habr.com/ru/post/316884/
All Articles