htop and more on your fingers

For a long time, I did not fully understand htop. I thought that the average load [load average] of 1.0 means that the processor is 50% loaded, but this is not the case. And then, why 1.0?
Then I decided to sort it all out and write about it. It is said that the best way to learn something new is to try to explain it.
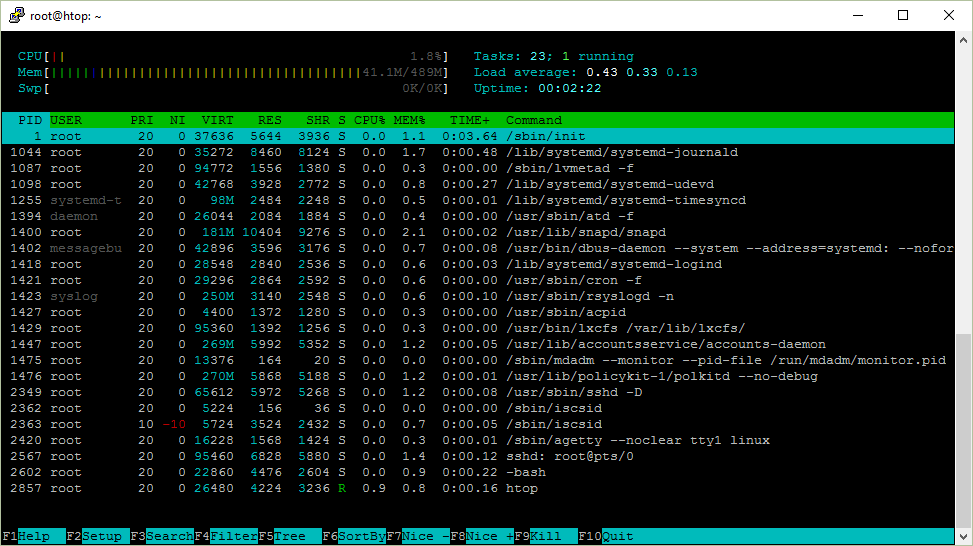
htop on Ubuntu Server 16.04 x64
Below is a screenshot of htop, which I will discuss in the article.
')
Uptime
Uptime shows the time of continuous system operation. This can be recognized by the uptime team.
$ uptime 12:17:58 up 111 days, 31 min, 1 user, load average: 0.00, 0.01, 0.05 Where does the uptime program take it? It reads information from the / proc / uptime file.
9592411.58 9566042.33 The first number is the number of seconds the system has been running. The second shows how many seconds the system was idle. It is worth noting that on systems with multiple processors, the second indicator may be larger than the first, since this is the sum of the processors.
How did I find out about this? I looked at what files opens uptime at startup. For this, you can use the strace utility.
strace uptime There will be a lot of output, it is better to make grep to search for the open system call. But this does not quite work, because by default it outputs to standard error stream (stderr). You can redirect stderr to the standard stream with 2> & 1 .
The result is:
$ strace uptime 2>&1 | grep open ... open("/proc/uptime", O_RDONLY) = 3 open("/var/run/utmp", O_RDONLY|O_CLOEXEC) = 4 open("/proc/loadavg", O_RDONLY) = 4 This contains the mentioned / proc / uptime file. It turned out that it is enough to run strace -e open uptime and not suffer with grep .
If you can take it directly from the file, then why do we need the uptime utility? The fact is that uptime formats the output in a readable form, whereas seconds in the file are convenient to use when writing your own scripts and programs.
Load average
In addition to the time of continuous work, uptime shows the average load of the system, they are displayed as 3 numbers.
$ uptime 12:59:09 up 32 min, 1 user, load average: 0.00, 0.01, 0.03 And they are taken from the file / proc / loadavg . If you look at the strace output again, you will notice that this file has also been opened.
$ cat /proc/loadavg 0.00 0.01 0.03 1/120 1500 The first 3 numbers measure the average system load for the last 1, 5 and 15 minutes. The 4th parameter is the number of active processes and their total number. The last number is the ID of the last process used.
Let's start from the end.
When the process starts, it is assigned an ID. As a rule, they go in ascending order, except for cases when the number has been exhausted and the system has to start counting anew. ID 1 is assigned to the / sbin / init process, which starts at startup.
Take another look at / proc / loadavg and try to run the sleep command in the background. When running in the background, you can see the process ID.
$ cat /proc/loadavg 0.00 0.01 0.03 1/123 1566 $ sleep 10 & [1] 1567 Thus, 1/123 means that 1 process is executed or is ready for execution, and there are 123 of them.
When you start htop , you see that only one process is running, it is the htop process itself.
If you start sleep 30 and open htop , then the number of running processes will still be 1. This is because the sleep process is not executed, but “sleeps”, i.e. is at rest, in other words, waiting for a certain event. A running or active process is a process that is currently being processed in a processor (CPU), or is waiting for its turn in the processor.
Try running cat / dev / urandom> / dev / null , where the random bytes generated are written to a special file that cannot be read from. Then you will see that the running processes are now 2.
$ cat /dev/urandom > /dev/null & [1] 1639 $ cat /proc/loadavg 1.00 0.69 0.35 2/124 1679 So, there are exactly 2 active processes (random number generator and cat utility, which reads the / proc / loadavg file ), you can still notice that the average load has increased.
load average is the average system load over a period of time.
The number of downloads is counted as the sum of the number of processes that are running (are running or are awaiting launch) and uninterrupted processes (the types of processes will be described below). Those. it's just the number of processes.
And the average load is obtained just an average value for 1, 5 and 15 minutes, right?
It turns out that not everything is so simple.
Mathematically speaking, all three values average load average over the entire system operation time. They become obsolete exponentially, but at different speeds. Thus, the average load for 1 minute is the sum of 63% of the load for the last minute + 37% of the load since the launch without taking into account the last minute. The same ratio is true for 5, 15 minutes. Therefore, it is not quite true that the average load for the last minute includes activity only for the last minute, but most of it for the last minute.
Did you know that?
Let's go back to the random number generator.
$ cat /proc/loadavg 1.00 0.69 0.35 2/124 1679 Although this is not entirely correct, but this is how I have simplified the average load indicator for understanding.
In this case, the generator uses a processor, the average load per last minute is 1.00 , in other words, an average of 1 process running.
In my system, this means that the processor is 100% loaded, because the processor is one, and it can only perform one process at a time.
If there were 2 processors, then the load would accordingly be 50%, since 2 processes could be performed simultaneously. The maximum average load (100% CPU usage) of a dual processor system is 2.00 .
The number of processors in the system can be found in the upper left corner of htop or with the help of nproc .
Processes
In the upper right corner, htop shows the total number of processes and how many of them are active. But why are tasks written there [Tasks], and not processes?
A task is synonymous with a process. In the Linux kernel, processes are tasks. htop uses the term job, perhaps because the name is shorter and saves a bit of space.
In htop, you can see the threads. To switch this option you need to use the combination Shift + H. If something like Tasks is displayed : 23, 10 thr , it means they are visible.
The display of kernel threads [kernel threads] can be enabled with Shift + K , and then the tasks will look like Tasks: 23, 40 kthr .
Process ID / PID
Each time the process starts, it is assigned an identifier (ID), abbreviated PID.
If you run the program in the background ( & ) from bash , then the [job] task number is displayed in square brackets, and next to it is the process PID.
$ sleep 1000 & [1] 12503 Another way is to use the $ variable ! in bash , which stores the PID of the last process running in the background.
$ echo $! 12503 The process id is very useful. With it, you can learn the details of the process and manage it.
There is a pseudo procfs file system with which programs can get information from the system kernel by reading files. Most often it is mounted in / proc / and for the user it looks like a normal directory that can be viewed with commands such as ls and cd .
All information about the process is in / proc / <id> / .
$ ls / proc / 12503
attr coredump_filter fdinfo maps ns personality smaps task auxv cpuset gid_map mem numa_maps projid_map stack uid_map cgroup cwd io mountinfo oom_adj root stat wchan clear_refs environ limits mounts oom_score schedstat statm cmdline exe loginuid mountstats oom_score_adj sessionid status comm fd map_files net pagemap setgroups syscall For example, / proc / <id> / cmdline contains a command with which the process started.
$ cat /proc/12503/cmdline sleep1000$ Um ... not exactly like that. The delimiter here is the byte \ 0 ,
$ od -c /proc/12503/cmdline 0000000 s l e e p \0 1 0 0 0 \0 0000013 which can be replaced with a space or a line break
$ tr '\0' '\n' < /proc/12503/cmdline sleep 1000 $ strings /proc/12503/cmdline sleep 1000 There may be links in the process catalog! For example, cwd refers to the current working directory, and exe to the running executable file.
$ ls -l /proc/12503/{cwd,exe} lrwxrwxrwx 1 ubuntu ubuntu 0 Jul 6 10:10 /proc/12503/cwd -> /home/ubuntu lrwxrwxrwx 1 ubuntu ubuntu 0 Jul 6 10:10 /proc/12503/exe -> /bin/sleep Thus, the utilities htop , top , ps and others show information about the process, they simply read / proc / <id> / <file> .
Process tree
When a new process is launched, the process that starts it is usually called the parent process or simply the parent. Thus, a new process is a child process of the parent. These relationships form a tree-like structure.
If you press F5 in htop , you can see the hierarchy of processes.
The same effect from the f command flag ps .
$ ps f PID TTY STAT TIME COMMAND 12472 pts/0 Ss 0:00 -bash 12684 pts/0 R+ 0:00 \_ ps f Or pstree .
$ pstree -a init ├─atd ├─cron ├─sshd -D │ └─sshd │ └─sshd │ └─bash │ └─pstree -a … If you have ever wondered why bash or sshd is the parent for some processes, then here’s why.
Below, I wrote what happens if, for example, you call date from the bash console.
- bash will create a new copy of its process (using the fork system call)
- It will then move the / bin / date executable to memory (using the exec system call).
- bash , as the parent process will wait for the child to finish.
Thus, / sbin / init , which has ID 1, started executing at system startup and spawned the SSH daemon sshd . Once connected to the system, sshd will spawn the process for the current session, which in turn will start the bash console.
I prefer to use the tree structure in the htop when I want to see all the streams.
Process owner
Each process has an owner - user. Users, in turn, have numerical IDs.
$ sleep 1000 & [1] 2045 $ grep Uid /proc/2045/status Uid: 1000 1000 1000 1000 You can use the id command to find out the name of this user.
$ id 1000 uid=1000(ubuntu) gid=1000(ubuntu) groups=1000(ubuntu),4(adm) As it turned out, id takes this information from the / etc / passwd and / etc / group files.
$ strace -e open id 1000 open("/etc/passwd", O_RDONLY|O_CLOEXEC) = 3 open("/etc/group", O_RDONLY|O_CLOEXEC) = 3 These are plain text files in which IDs are associated with usernames.
$ cat /etc/passwd root:x:0:0:root:/root:/bin/bash daemon:x:1:1:daemon:/usr/sbin:/usr/sbin/nologin ubuntu:x:1000:1000:Ubuntu:/home/ubuntu:/bin/bash $ cat /etc/group root:x:0: adm:x:4:syslog,ubuntu ubuntu:x:1000: passwd ? But where are the passwords? And they are actually in / etc / shadow .
$ sudo cat /etc/shadow root:$6$mS9o0QBw$P1ojPSTexV2PQ.Z./rqzYex.k7TJE2nVeIVL0dql/:17126:0:99999:7::: daemon:*:17109:0:99999:7::: ubuntu:$6$GIfdqlb/$ms9ZoxfrUq455K6UbmHyOfz7DVf7TWaveyHcp.:17126:0:99999:7::: If you run the program, it will run on your behalf, even if you are not its owner. If you need to run it as root , then you need to use sudo .
$ id uid=1000(ubuntu) gid=1000(ubuntu) groups=1000(ubuntu),4(adm) $ sudo id uid=0(root) gid=0(root) groups=0(root) $ sudo -u ubuntu id uid=1000(ubuntu) gid=1000(ubuntu) groups=1000(ubuntu),4(adm) $ sudo -u daemon id uid=1(daemon) gid=1(daemon) groups=1(daemon) But what if you need to run several programs on behalf of other users? You can start the console on their behalf by using the commands sudo bash or sudo -u user bash .
If you do not want to enter the administrator password every time you start programs, you can disable this feature by adding your username to the / etc / sudoers file.
Let's try.
$ echo "$USER ALL=(ALL) NOPASSWD: ALL" >> /etc/sudoers -bash: /etc/sudoers: Permission denied Yes, exactly, this can be done only with root privileges.
$ sudo echo "$USER ALL=(ALL) NOPASSWD: ALL" >> /etc/sudoers -bash: /etc/sudoers: Permission denied What the…?
Here we are trying to call echo on behalf of the administrator, but at the same time we still write to the / etc / sudoers file on our behalf.
As a rule, there are 2 ways out of this situation:
- echo "$ USER ALL = (ALL) NOPASSWD: ALL" | sudo tee -a / etc / sudoers
- sudo bash -c "echo '$ USER ALL = (ALL) NOPASSWD: ALL' >> / etc / sudoers"
In the first case, tee -a will write from the standard input stream to the file on behalf of the administrator.
In the second case, we run the console as an administrator and ask to execute commands ( -c ) and all commands will be executed as root. Pay attention to the placement of quotation marks " / ' , with which the variable $ USER is dereferenced correctly.
Suppose you want to change your password. The passwd command to help you. It will save the password in the / etc / shadow file, which we saw above.
This file is writable only for root:
$ ls -l /etc/shadow -rw-r----- 1 root shadow 1122 Nov 27 18:52 /etc/shadow How is it possible that a program launched on behalf of the user can write to a protected file?
I have already said that when you call, the program runs on behalf of the user who starts it, even if it belongs to another user.
It turns out that this behavior can be changed by editing the file permissions. Let's get a look.
$ ls -l /usr/bin/passwd -rwsr-xr-x 1 root root 54256 Mar 29 2016 /usr/bin/passwd Pay attention to the symbol s . It was added using sudo chmod u + s / usr / bin / passwd . And that means that the executable file will always run as the owner, in this case, root.
The so-called setuid executables can be searched for using find / bin -user root -perm -u + s .
This can also be done for groups ( g + s ).
Process states
Next, we will deal with the state column of the processes in the htop , in which, by example, are the characters S.
Possible state values:
- R - [running or runnable] running or are in the queue to start
- S - [interruptible sleep] interrupted sleep
- D - [uninterruptible sleep] uninterrupted sleep (mostly IO)
- Z - [zombie] zombie process, terminated but not picked up by the parent
- T - Stopped by job control signal
- t - Debugger stopped
- X - Dead (should not be shown)
They are sorted by how often I usually see them.
Note that when ps starts up, it can also show substates as Ss , R + , Ss + , etc.
$ ps x PID TTY STAT TIME COMMAND 1688 ? Ss 0:00 /lib/systemd/systemd --user 1689 ? S 0:00 (sd-pam) 1724 ? S 0:01 sshd: vagrant@pts/0 1725 pts/0 Ss 0:00 -bash 2628 pts/0 R+ 0:00 ps x R - Launched or Queued
Processes in this state are either running or are in the queue to run.
What does it mean?
When you compile the code, the output is an executable file in the form of instructions for the processor. At startup, this file is placed in memory, where the processor executes these instructions, in other words, is engaged in calculations.
S - Interrupted sleep
In this state, program instructions are not executed in the processor, in other words, they sleep. The process is waiting for an event or any condition for continuation. After the event has occurred, the state changes to running.
For example, you can take the sleep utility from coreutils. He will be in a state of sleep a certain number of seconds.
$ sleep 1000 & [1] 10089 $ ps f PID TTY STAT TIME COMMAND 3514 pts/1 Ss 0:00 -bash 10089 pts/1 S 0:00 \_ sleep 1000 10094 pts/1 R+ 0:00 \_ ps f So this is an interrupted sleep, how can it be interrupted? Using the signal.
You can send a signal using htop by pressing the F9 key and selecting the desired signal type in the menu.
Signal transmission is also known as the kill command, because it is actually a system call that can send a signal to a process. There is the program / bin / kill of the same name, which can execute a system call from the user's environment and by default sends a TERM signal that kills a process, kills it.
The signal is just a number. Numbers are hard to remember, so they were called by their names. Their names are usually capitalized and can be prefixed with SIG .
Frequently used signals are: INT , KILL , STOP , CONT , HUP .
Let's try to interrupt the sleeping process by sending it an INT signal, aka SIGINT , just 2 , or an interrupt signal from the terminal .
$ kill -INT 10089 [1]+ Interrupt sleep 1000 The same signal is sent if you press the CTRL + C combination. bash will send a SIGINT signal to the foreground process, just like we did it manually.
By the way, the kill command is built into bash , although many systems have a program / bin / kill . Why? To be able to "kill" the process even if the limit on the number of created processes is exceeded.
The following commands are identical:
- kill -INT 10089
- kill -2 10089
- / bin / kill -2 10089
Another useful signal is SIGKILL or 9 . You may have used it when you could not complete the process with an uncontrolled click CTRL + C.
When writing a program, you can catch these signals and create functions that will be triggered when the corresponding signal is received. For example, you can clear the memory or neatly shut down. Therefore, sending a signal, such as an interrupt signal from a terminal, does not mean that the process will be terminated.
You may have encountered such an exception when running Python scripts:
$ python -c 'import sys; sys.stdin.read()' ^C Traceback (most recent call last): File "<string>", line 1, in <module> KeyboardInterrupt But there is a signal that can stop the process, not giving him the opportunity to answer it. This is a KILL signal.
$ sleep 1000 & [1] 2658 $ kill -9 2658 [1]+ Killed sleep 1000 D - uninterrupted sleep
In contrast to interrupted sleep, the processes in this state cannot be stopped with the help of signals. Therefore, many people do not like this state.
In this state, the process waits and cannot be interrupted, for example, if a continuation event is about to occur, such as read / write to disk. This usually happens in a split second.
There is a good answer on StackOverflow :
Continuous processes are usually waiting for an IO after a page fault. The process cannot be interrupted at this time by a signal, because it cannot process them. If it could, the page fault would reappear and everything would remain as it is.
In other words, this can happen if, for example, you use the NFS network access protocol and it takes time to read / write to / from it.
From my own experience I can say that this happens when the process is often pumped up, i.e. there is not enough free memory for it.
Let's try to cause this condition.
8.8.8.8 is the public DNS from Google. There are no NFS, but it will not stop us.
$ sudo mount 8.8.8.8:/tmp /tmp & [1] 12646 $ sudo ps x | grep mount.nfs 12648 pts/1 D 0:00 /sbin/mount.nfs 8.8.8.8:/tmp /tmp -o rw How to find out what makes the process in such a state? strace !
Call strace for the ps command above.
$ sudo strace /sbin/mount.nfs 8.8.8.8:/tmp /tmp -o rw ... mount("8.8.8.8:/tmp", "/tmp", "nfs", 0, ... And here we will see that the mount system call blocks the process.
And mount , by the way, can be called with the intr option, so that it can be interrupted: sudo mount 8.8.8.8:/tmp / tmp -o intr .
Z - Zombie process
When a process finishes its work with exit and it has child processes, the child processes become zombies.
- Absolutely normal if the zombie process is short-lived.
- Zombie processes that exist for a long time, can talk about a bug in the program
- Zombie processes do not use memory, only the process ID
- Zombie process can not be "killed"
- You can politely ask the parent process to get rid of the zombies (sending a SIGCHLD )
- You can complete the parent process to get rid of both.
I will demonstrate this by writing a small code in C.
#include <stdio.h> #include <stdlib.h> #include <unistd.h> int main() { printf("Running\n"); int pid = fork(); if (pid == 0) { printf(" \n"); printf(" \n"); exit(0); } else { printf(" \n"); printf(" \n"); sleep(20); printf(" \n"); } return 0; } Install the C compiler, the GNU C Compiler (GCC).
sudo apt install -y gcc Compile and run the program.
gcc zombie.c -o zombie ./zombie Look at the process hierarchy
$ ps f PID TTY STAT TIME COMMAND 3514 pts/1 Ss 0:00 -bash 7911 pts/1 S+ 0:00 \_ ./zombie 7912 pts/1 Z+ 0:00 \_ [zombie] <defunct> 1317 pts/0 Ss 0:00 -bash 7913 pts/0 R+ 0:00 \_ ps f We have zombies! When the parent process ends, the zombie disappears.
$ ps f PID TTY STAT TIME COMMAND 3514 pts/1 Ss+ 0:00 -bash 1317 pts/0 Ss 0:00 -bash 7914 pts/0 R+ 0:00 \_ ps f If you replace sleep (20) with a while (true) instruction, the zombie will disappear immediately.
When you call exit , all occupied memory and resources are freed so that they are available to others. Why, then, need a zombie process?
Parent processes have the opportunity to find out the exit code of the child processes (in the signal handler) using the wait system call. If the child process is sleeping, the parent will wait first.
Why then do not forcefully wake up the process and complete it? , , . .
T —
ps u .
$ ps u USER PID %CPU %MEM VSZ RSS TTY STAT START TIME COMMAND ubuntu 1317 0.0 0.9 21420 4992 pts/0 Ss+ Jun07 0:00 -bash ubuntu 3514 1.5 1.0 21420 5196 pts/1 Ss 07:28 0:00 -bash ubuntu 3528 0.0 0.6 36084 3316 pts/1 R+ 07:28 0:00 ps u -bash ps .
cat /dev/urandom > /dev/nul . R+ , .
$ ps u USER PID %CPU %MEM VSZ RSS TTY STAT START TIME COMMAND ubuntu 3540 103 0.1 6168 688 pts/1 R+ 07:29 0:04 cat /dev/urandom CTRL+Z , .
$ # CTRL+Z [1]+ Stopped cat /dev/urandom > /dev/null $ ps aux USER PID %CPU %MEM VSZ RSS TTY STAT START TIME COMMAND ubuntu 3540 86.8 0.1 6168 688 pts/1 T 07:29 0:15 cat /dev/urandom Now, he is able to t . If you want to continue the process, you can call fg in the first terminal.
There is another way to stop processes, for this you need to send them a STOP signal using kill , and to continue, respectively, the signal CONT .
t - Debugger stopped
First, install the GNU Debugger (gdb) debugger
sudo apt install -y gdb Run the program to listen on port 1234.
$ nc -l 1234 & [1] 3905 He is in a state of sleep, because he is waiting for incoming messages.
$ ps u USER PID %CPU %MEM VSZ RSS TTY STAT START TIME COMMAND ubuntu 3905 0.0 0.1 9184 896 pts/0 S 07:41 0:00 nc -l 1234 Run the debugger and link it to the process with PID 3905.
sudo gdb -p 3905 Now the process will be traced to [trace] in the debugger and its state will change to t .
$ ps u USER PID %CPU %MEM VSZ RSS TTY STAT START TIME COMMAND ubuntu 3905 0.0 0.1 9184 896 pts/0 t 07:41 0:00 nc -l 1234 Processing time
Linux — , , . , SSH htop , .
, ?
.
, , ..
, , , , , .
, , . .
Linux , .
, , , , , .
nice ( NI ) , -20, , 19, . , , .. , .
, StackOverflow , 1 10% .
( PRI ) . 0 139. 0 99 , , . 100 139, .
, , , , .
: PR = 20 + NI.
PR = 20 + (-20 to +19) 100 139.
.
nice -n program renice .
renice -n niceness -p PID http://askubuntu.com/questions/656771/process-niceness-vs-priority
— VIRT/RES/SHR/MEM
, . — .
. , , , . , , , .
, - . [shared] , ? , , , , htop .
VIRT/VSZ —
The total amount of memory occupied by the process. It includes all the code, data, shared libraries, pages that were moved to disk, as well as pages that were projected by the kernel but were not used.
Thus, VIRT is all that is used by the process.
If the application requests 1 GB of memory, but uses only 1 MB for this, then the VIRT memory will still be displayed as 1 GB. Even if it calls mmap for a file weighing 1 GB and never uses it, the VIRT will still remain 1 GB.
In most cases, this indicator is useless.
RES / RSS - Resident Memory
RSS [resident set size] , .
RES , , VIRT , :
- ,
1 fork() , RES 1 , 1 , Linux [copy-on-write].
SHR —
, .
#include <stdio.h> #include <stdlib.h> #include <unistd.h> int main() { printf("\n"); sleep(10); size_t memory = 10 * 1024 * 1024; // 10 MB char* buffer = malloc(memory); printf(" 10M\n"); sleep(10); for (size_t i = 0; i < memory/2; i++) buffer[i] = 42; printf(" 5M\n"); sleep(10); int pid = fork(); printf(" \n"); sleep(10); if (pid != 0) { for (size_t i = memory/2; i < memory/2 + memory/5; i++) buffer[i] = 42; printf(". 2M \n"); } sleep(10); return 0; } Then
fallocate -l 10G gcc -std=c99 mem.c -o mem ./mem AND
VIRT RES SHR 4200 680 604 10M 14444 680 604 5M 14444 6168 1116 14444 6168 1116 14444 5216 0 . 2M 8252 1116 . 2M 5216 0 (Note. This section is not finished until the end; as soon as the article is updated, I will post updates)
MEM% - Memory Usage
The percentage of physical memory usage. This is RES divided by total RAM.
If, for example, RES is 200M and 8 GB of memory is installed in the system, then MEM% will be 200/8192 * 100 = 2.4%
Processes
I ran a virtual machine with Ubuntu Server in Digital Ocean. What processes are started at system startup? Are they needed?
Below is an analysis of the processes that run on a clean version of the machine with Ubuntu Server 16.04.1 LTS x64 in Digital Ocean.
Before
/ sbin / init
This program coordinates all other applications at startup and configures the user's environment. Once launched, it becomes the parent or progenitor of all automatically starting processes.
Is that systemd ?
$ dpkg -S /sbin/init systemd-sysv: /sbin/init Yes, he is. What happens if you stop it? Nothing.
/ lib / systemd / systemd-journald
ystemd-journald , . , , .
,
journald . .
, journalctl .
- journalctl _COMM=sshd sshd
- journalctl _COMM=sshd -o json-pretty sshd JSON
- journalctl --since «2015-01-10» --until «2015-01-11 03:00»
- journalctl --since 09:00 --until «1 hour ago»
- journalctl --since yesterday
- journalctl -b history since system startup
- journalctl -f to follow logs
- journalctl --disk-usage
- journalctl --vacuum-size = 1G
Impressive. This process, it seems, cannot be stopped or removed, you can only turn off the history.
/ sbin / lvmetad -f
lvmetad LVM, LVM . .
LVM [Logical Volume Management] ( )? , LVM , // , « » , .
, LVM.
$ lvscan $ sudo apt remove lvm2 -y --purge /lib/systemd/udevd
systemd-udevd uevents . , systemd-udevd udev .
udev Linux. devfsd hotplug , udev /dev .
.
/lib/systemd/timesyncd
systemd-timesyncd NTP.
ntpd .
$ timedatectl status Local time: Fri 2016-08-26 11:38:21 UTC Universal time: Fri 2016-08-26 11:38:21 UTC RTC time: Fri 2016-08-26 11:38:20 Time zone: Etc/UTC (UTC, +0000) Network time on: yes NTP synchronized: yes RTC in local TZ: no :
$ sudo netstat -nlput Active Internet connections (only servers) Proto Recv-Q Send-Q Local Address Foreign Address State PID/Program name tcp 0 0 0.0.0.0:22 0.0.0.0:* LISTEN 2178/sshd tcp6 0 0 :::22 :::* LISTEN 2178/sshd Beauty! Ubuntu 14.04 :
$ sudo apt-get install ntp -y $ sudo netstat -nlput Active Internet connections (only servers) Proto Recv-Q Send-Q Local Address Foreign Address State PID/Program name tcp 0 0 0.0.0.0:22 0.0.0.0:* LISTEN 1380/sshd tcp6 0 0 :::22 :::* LISTEN 1380/sshd udp 0 0 10.19.0.6:123 0.0.0.0:* 2377/ntpd udp 0 0 139.59.256.256:123 0.0.0.0:* 2377/ntpd udp 0 0 127.0.0.1:123 0.0.0.0:* 2377/ntpd udp 0 0 0.0.0.0:123 0.0.0.0:* 2377/ntpd udp6 0 0 fe80::601:6aff:fxxx:123 :::* 2377/ntpd udp6 0 0 ::1:123 :::* 2377/ntpd udp6 0 0 :::123 :::* 2377/ntpd Brr
/usr/sbin/atd -f
atd , at .
cron , , at .
$ echo "touch /tmp/yolo.txt" | at now + 1 minute job 1 at Fri Aug 26 10:44:00 2016 $ atq 1 Fri Aug 26 10:44:00 2016 a root $ sleep 60 && ls /tmp/yolo.txt /tmp/yolo.txt , .
sudo apt remove at -y --purge /usr/lib/snapd/snapd
Snappy Ubuntu Core Ubuntu — Ubuntu, .
What?
Linux «snap» Linux, , , Linux.
, deb , . snappy .
sudo apt remove snapd -y --purge /usr/bin/dbus-daemon
D-Bus — , .
, , ?
sudo apt remove dbus -y --purge , NTP?
$ timedatectl status Failed to create bus connection: No such file or directory , , .
/lib/systemd/systemd-logind
systemd-logind , .
/usr/sbin/cron -f
cron — (Vixie Cron)
-f — .
cron .
, crontab -e , /etc/cron.hourly , /etc/cron.daily , ..
:
- grep cron /var/log/syslog
- journalctl _COMM=cron
- journalctl _COMM=cron --since=«date» --until=«date»
Surely, you will need cron .
But if not, then before deleting, you need to stop and disable it.
sudo systemctl stop cron sudo systemctl disable cron Otherwise, when trying to remove with the apt remove cron command , it will try to install postfix !
$ sudo apt remove cron The following packages will be REMOVED: cron The following NEW packages will be installed: anacron bcron bcron-run fgetty libbg1 libbg1-doc postfix runit ssl-cert ucspi-unix It seems that cron needs a mail server for mailing.
$ apt show cron Package: cron Version: 3.0pl1-128ubuntu2 ... Suggests: anacron (>= 2.0-1), logrotate, checksecurity, exim4 | postfix | mail-transport-agent $ apt depends cron cron ... Suggests: anacron (>= 2.0-1) Suggests: logrotate Suggests: checksecurity |Suggests: exim4 |Suggests: postfix Suggests: <mail-transport-agent> ... exim4-daemon-heavy postfix / usr / sbin / rsyslogd -n
Rsyslogd — .
, , /var/log/ , /var/log/auth.log SSH.
/etc/rsyslog.d .
rsyslogd , , .
logger /var/log/syslog , .
#!/bin/bash logger Starting doing something # NFS, get IPs, etc. logger Done doing something , systemd-journald . rsyslogd ?
Rsyslog Journal , . , . , , . Rsyslog Journal .
? , .
/usr/sbin/acpid
acpid — .
acpid ACPI. , .
ACPI , , , , .
. .
sudo apt remove acpid -y --purge reboot , halt , Digital Ocean , .
, .
/usr/bin/lxcfs /var/lib/lxcfs/
Lxcfs . Ubuntu 15.04 : , /proc , cgroup .
, lxc-create uptime , top , .. , .
LXC,
sudo apt remove lxcfs -y --purge /usr/lib/accountservice/accounts-daemon
AccountsService D-Bus . usermod(8) , useradd(8) userdel(8) .
D-Bus, timedatectl . , , .
sudo apt remove accountsservice -y --purge Time will tell.
/sbin/mdadm
mdadm Linux RAID .
RAID — , . RAID 2 : 1) : RAID 0. 2 500 , 1 . 2) : , RAID 1, RAID 5, RAID 6, RAID 10.
:
sudo apt remove mdadm -y --purge /usr/lib/policykit-1/polkitd --no-debug
polkit . , sudo , , .
.
sudo apt remove policykit-1 -y --purge , - .
/usr/sbin/sshd -D
sshd (OpenSSH Daemon) ssh. -D . sshd .
/sbin/iscsid
iscsid , , iSCSI .
iSCSI:
iSCSI — , TCP/IP , .
sudo apt remove open-iscsi -y --purge /sbin/agetty --noclear tty1 linux
agetty — Linux getty .
getty Unix , . , login .
. Digital Ocean, , ( VNC).
, ( /etc/inittab ), systemd .
, , agetty :
sudo rm /etc/systemd/system/getty.target.wants/getty@tty1.service sudo rm /lib/systemd/system/getty@.service , SSH, .
sshd: root@pts/0, -bash htop
sshd: root@pts/0 , SSH root ( pts ) № 0 .
bash , . bash ? Reddit hirnbrot :
, "-bash", login-. Login- , 0 , --login. .
htop — , .
sudo apt remove lvm2 -y --purge sudo apt remove at -y --purge sudo apt remove snapd -y --purge sudo apt remove lxcfs -y --purge sudo apt remove mdadm -y --purge sudo apt remove open-iscsi -y --purge sudo apt remove accountsservice -y --purge sudo apt remove policykit-1 -y --purge :
sudo apt remove dbus -y --purge sudo apt remove rsyslog -y --purge sudo apt remove acpid -y --purge sudo systemctl stop cron && sudo systemctl disable cron sudo rm /etc/systemd/system/getty.target.wants/getty@tty1.service sudo rm /lib/systemd/system/getty@.service WordPress Ubuntu Server .
nginx, PHP7 MySQL.
Behind the scenes
Source
strace . ,
, .
$ which uptime /usr/bin/uptime $ dpkg -S /usr/bin/uptime procps: /usr/bin/uptime , uptime /usr/bin/uptime Ubuntu procps .
, packages.ubuntu.com .
procps : http://packages.ubuntu.com/source/xenial/procps
:
- Debian Package Source Repository git://git.debian.org/collab-maint/procps.git
- Debian Package Source Repository ( ) https://anonscm.debian.org/cgit/collab-maint/procps.git/
( stderr ) , 2&>1 2>&1 ?
, echo > . , echo 1> . echo 2> .
echo 2> 1 , , 1 .
1 & , , 1 , . echo 2>&1 .
PuTTY
PuTTY, .
- Change settings
- Window → Colours
- Both
- Apply
C
C, fork / exec / wait . shell.c :
#include <stdio.h> #include <stdlib.h> #include <unistd.h> #include <string.h> #include <sys/wait.h> int main() { printf(" \n"); char line[1024]; while (1) { printf("> "); fgets(line, sizeof(line), stdin); line[strlen(line)-1] = '\0'; // strip \n if (strcmp(line, "exit") == 0) // shell built-in break; int pid = fork(); if (pid == 0) { printf(": %s\n", line); if (execlp(line, "", NULL) == -1) { printf("!\n"); exit(1); } } else if (pid > 0) { int status; waitpid(pid, &status, 0); printf(" %d\n", WEXITSTATUS(status)); } else { printf("!\n"); break; } } return 0; } :
gcc shell.c -o shell :
$ ./shell > date : date Thu Dec 1 14:10:59 UTC 2016 0 > true : true 0 > false : false 1 > exit , , Enter ?
$ sleep 1 & [1] 11686 $ # Enter [1]+ Done sleep 1 , . , , .
, . . , , , , . , , , , . , , .
Source: https://habr.com/ru/post/316806/
All Articles