Google Chrome Developer Console: Ten Unobvious Utilities
How to turn Google Chrome into a text editor using the developer console? What is the meaning of the $ icon acquired in it by jQuery? How to display in the console a set of values, designed in the form of a quite decent table? If the answers to these questions do not immediately come to mind, then the Console tab from the Chrome developer’s tools has not yet opened up to you in all its glory.

At first glance, we have before us a completely ordinary JavaScript-console, which is only suitable for displaying logs of server responses or values of variables in it. By the way, I used it that way when I first started programming. However, over time, I gained experience, learned a bit, and unexpectedly discovered that the Chrome console can do a lot of things that I had no idea. I want to tell about it today. Yes, if you are reading now not on a mobile phone, you can immediately try it all.
If you're familiar with jQuery, it's not for me to tell you about the importance of constructions like $ ('. Class') and $ ('id') . For those who do not know, I will explain that they allow you to select DOM elements, specifying the classes and identifiers assigned to them. The developer console has similar functionality. Here "$", however, has no relation to jQuery, although it does, in essence, the same thing. This is an alias for the document.querySelector () function.
Commands like $ ('tagName') , $ ('. Class') , $ ('# id'), and $ ('. Class # id ') return the first DOM element that matches the selector. At the same time, if jQuery is available in the document, its "$" will override this console functionality.
')
There is another construction here: $$ . Its use looks like $$ ('tagName') or $$ ('. Class') . It allows you to select all DOM elements that match the selector and put them into an array. Working with it is no different from other arrays. In order to select a specific item, you can refer to it by index.
For example, the $$ command ('. ClassName') will provide us with an array of all page elements with the class name specified when it was called. The $$ ('. ClassName') [0] and $$ ('. ClassName') [1] commands will give access, respectively, to the first and second elements of the resulting array.
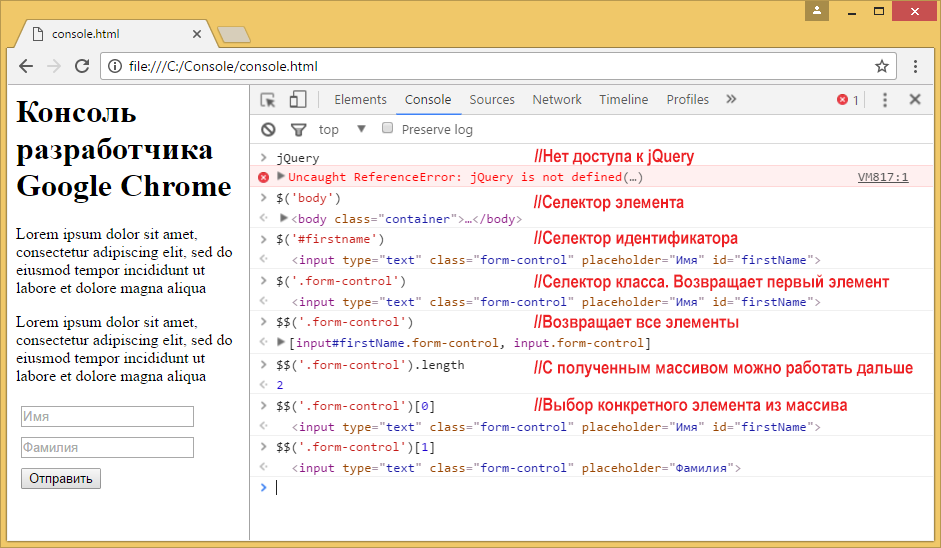
Experiments with the $ and $$ commands
Did you have to catch yourself thinking that it would be good to edit the text of the web page being debugged right in the browser? If yes, then you will like the command shown below.
After its execution in the console, the document opened in the browser can be edited without the need to search for the necessary fragment in the HTML code.
During the debugging process, you may need to find event handlers associated with the elements. Using the console is very easy to do. It is enough to use this command:
As a result of its execution, an array of objects will be displayed containing a list of events to which the element can react.
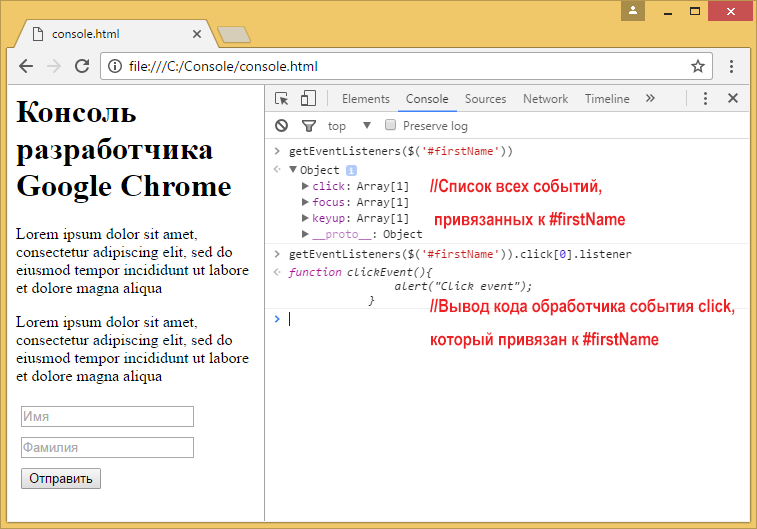
Event handlers
In order to find a handler for a specific event, you can use the following construction:
This command will print the function code of the event handler. Here eventName [0] is an array that contains all the events of a particular type. For example, in practice it might look like this:
As a result, we get the function code associated with the click event of the element with the identifier firstName .
If you want to observe the occurrence of events associated with a specific DOM element, the console will help. Here are some commands you can use to monitor events.
A console.time ('labelName') view function is available in the Chrome console , which takes a label as an argument and starts a timer. Another function, console.timeEnd ('labelName') , stops the timer assigned to the label passed to it. Here is an example of using these functions:
The above example lets you know the time between starting and stopping the timer. You can do the same inside a JavaScript program and find the execution time of a code fragment.
Let's say I need to figure out the duration of the loop. You can do it like this:
Suppose we have such an array of objects:
If you bring it to the console, you get a hierarchical structure in the form of, in fact, an array of objects. This is a useful feature, the branches of the structure can be expanded by viewing the contents of objects. However, with this approach it is difficult to understand, for example, how the properties of similar elements correlate. In order to work with such data more conveniently, they can be converted to a table view. To do this, use the following command:
It allows you to display a variable and all its properties as a table. Here is what it looks like.

Outputting an array of objects as a table
You can quickly go to the item code from the console using the following commands:
If you need to view the list of properties of the element, the console will help with this. Here is the following command:
It returns an object containing the properties associated with the specified DOM element. As in other similar cases, the contents of this object can be explored by looking at its tree structure.
The console can be used as a calculator, everyone probably knows this. But the fact that it has built-in tools that allow the results of previous calculations to be used in teams is not widely known. Using the $ _ construct, you can retrieve the result of the previous expression from memory. Here's what it looks like:
If you need to clear the console and memory, use this simple command:
After clicking on Enter, the blank console will be ready for new experiments.
That's all.
Frankly, this is not all. I showed only some of the unobvious capabilities of the Google Chrome console. In fact, they are much more . I'm sure you can expand my list with your own finds.
I hope my story has helped you learn something useful, time-saving, worthy of being part of the web programmer’s everyday arsenal about the Chrome console.
What tools do you use? Come on, let's share some prikolyukhami! :)
At first glance, we have before us a completely ordinary JavaScript-console, which is only suitable for displaying logs of server responses or values of variables in it. By the way, I used it that way when I first started programming. However, over time, I gained experience, learned a bit, and unexpectedly discovered that the Chrome console can do a lot of things that I had no idea. I want to tell about it today. Yes, if you are reading now not on a mobile phone, you can immediately try it all.
1. Select DOM elements
If you're familiar with jQuery, it's not for me to tell you about the importance of constructions like $ ('. Class') and $ ('id') . For those who do not know, I will explain that they allow you to select DOM elements, specifying the classes and identifiers assigned to them. The developer console has similar functionality. Here "$", however, has no relation to jQuery, although it does, in essence, the same thing. This is an alias for the document.querySelector () function.
Commands like $ ('tagName') , $ ('. Class') , $ ('# id'), and $ ('. Class # id ') return the first DOM element that matches the selector. At the same time, if jQuery is available in the document, its "$" will override this console functionality.
')
There is another construction here: $$ . Its use looks like $$ ('tagName') or $$ ('. Class') . It allows you to select all DOM elements that match the selector and put them into an array. Working with it is no different from other arrays. In order to select a specific item, you can refer to it by index.
For example, the $$ command ('. ClassName') will provide us with an array of all page elements with the class name specified when it was called. The $$ ('. ClassName') [0] and $$ ('. ClassName') [1] commands will give access, respectively, to the first and second elements of the resulting array.
Experiments with the $ and $$ commands
2. Turn the browser into a text editor.
Did you have to catch yourself thinking that it would be good to edit the text of the web page being debugged right in the browser? If yes, then you will like the command shown below.
document.body.contentEditable=true After its execution in the console, the document opened in the browser can be edited without the need to search for the necessary fragment in the HTML code.
3. Search for event handlers associated with the element.
During the debugging process, you may need to find event handlers associated with the elements. Using the console is very easy to do. It is enough to use this command:
getEventListeners($('selector')) As a result of its execution, an array of objects will be displayed containing a list of events to which the element can react.
Event handlers
In order to find a handler for a specific event, you can use the following construction:
getEventListeners($('selector')).eventName[0].listener This command will print the function code of the event handler. Here eventName [0] is an array that contains all the events of a particular type. For example, in practice it might look like this:
getEventListeners($('#firstName')).click[0].listener As a result, we get the function code associated with the click event of the element with the identifier firstName .
4. Event Monitoring
If you want to observe the occurrence of events associated with a specific DOM element, the console will help. Here are some commands you can use to monitor events.
- The monitorEvents ($ ('selector')) command allows you to organize the monitoring of all events related to the element to which the selector corresponds. When an event occurs, an entry is made in the console. For example, the monitorEvents ($ ('# firstName')) command allows you to log all events associated with the element whose ID is firstName .
- The monitorEvents ($ ('selector'), 'eventName') command is similar to the previous one, but it targets a specific event. Here, in addition to the element selector, the name of the event is passed to the function. This command allows you to display in the console data on the occurrence of a single event. For example, the monitorEvents ($ ('# firstName'), 'click') command displays information only on the click event of the element with the identifier firstName .
- The monitorEvents ($ ('selector'), ['eventName1', 'eventName3', ....]) Command allows you to monitor several selected events. Here, the function is passed a string array that contains the names of the events. For example, the following command: monitorEvents ($ ('# firstName'), ['click', 'focus']) will display information on the click and focus events for the element with the identifier firstName to the console.
- The unmonitorEvents ($ ('selector')) command allows you to stop monitoring and logging events in the console.
5. Measurement of the execution time of a code fragment
A console.time ('labelName') view function is available in the Chrome console , which takes a label as an argument and starts a timer. Another function, console.timeEnd ('labelName') , stops the timer assigned to the label passed to it. Here is an example of using these functions:
console.time('myTime'); // myTime console.timeEnd('myTime'); // myTime //: myTime:123.00 ms The above example lets you know the time between starting and stopping the timer. You can do the same inside a JavaScript program and find the execution time of a code fragment.
Let's say I need to figure out the duration of the loop. You can do it like this:
console.time('myTime'); // myTime for(var i=0; i < 100000; i++){ 2+4+5; } console.timeEnd('mytime'); // myTime // - myTime:12345.00 ms 6. The output values of variables in the form of tables
Suppose we have such an array of objects:
var myArray=[{a:1,b:2,c:3},{a:1,b:2,c:3,d:4},{k:11,f:22},{a:1,b:2,c:3}] If you bring it to the console, you get a hierarchical structure in the form of, in fact, an array of objects. This is a useful feature, the branches of the structure can be expanded by viewing the contents of objects. However, with this approach it is difficult to understand, for example, how the properties of similar elements correlate. In order to work with such data more conveniently, they can be converted to a table view. To do this, use the following command:
console.table(variableName) It allows you to display a variable and all its properties as a table. Here is what it looks like.
Outputting an array of objects as a table
7. View item code
You can quickly go to the item code from the console using the following commands:
- The inspect ($ ('selector')) command allows you to open the code of the element corresponding to the selector in the Elements panel of the Google Chrome developer tools. For example, the inspect ($ ('# firstName')) command allows you to view the item code with the identifier firstName . The inspect ($$ ('a') [3]) command will open the fourth reference code that is present in the DOM.
- Commands like $ 0 , $ 1 , $ 2 allow you to quickly move to recently viewed items. For example, $ 0 will open the code of the most recently viewed item, and so on.
8. Listing element properties
If you need to view the list of properties of the element, the console will help with this. Here is the following command:
dir($('selector')) It returns an object containing the properties associated with the specified DOM element. As in other similar cases, the contents of this object can be explored by looking at its tree structure.
9. Calling the last result obtained
The console can be used as a calculator, everyone probably knows this. But the fact that it has built-in tools that allow the results of previous calculations to be used in teams is not widely known. Using the $ _ construct, you can retrieve the result of the previous expression from memory. Here's what it looks like:
2+3+4 9 //- - 9 $_ 9 // $_ * $_ 81 // 9, 81 Math.sqrt($_) 9 // , 81 $_ 9 // 9 – 10. Cleaning the console and memory
If you need to clear the console and memory, use this simple command:
clear() After clicking on Enter, the blank console will be ready for new experiments.
That's all.
11, 12, 13, 14 ...
Frankly, this is not all. I showed only some of the unobvious capabilities of the Google Chrome console. In fact, they are much more . I'm sure you can expand my list with your own finds.
I hope my story has helped you learn something useful, time-saving, worthy of being part of the web programmer’s everyday arsenal about the Chrome console.
What tools do you use? Come on, let's share some prikolyukhami! :)
Source: https://habr.com/ru/post/316132/
All Articles