Intersystems DeepSee. Easy and fast data visualization
As a BI system, our organization selected DeepSee, which is included in the delivery package of InterSystems Cache. In part, this choice was predetermined by the fact that we use this DBMS for data storage, so using an integrated BI is the best solution.
DeepSee is an OLAP cubes that “look” at a selected table of a selected region, such cubes can be filtered across all fields of the source table, which allows you to view data from any point. For example, one of the tasks was to display information about births. DeepSee allowed creating tables showing how many children were born over the past year on the basis of cubes, and dividing them into groups according to gender, weight, body length, age of mothers and place of birth. Also for each parameter you can set the conditions of DrillDown - dropping into the parameter, so instead of a year we can see how much was born in a particular month, day, hour.
Sounds good, right? The way it is!
However, as always in any barrel of honey there is a fly in the ointment, in the case of DeepSee this is the design in which the data is presented:
')

In this form, it is not worthwhile to show analytics to anyone, or we will be accepted as creepy conservatives or people who have no taste.
Fortunately, I found salvation, in github, a completely open product called DeepSeeWeb (DSW) is a website created using jQuery and AngularJS. And if pure DeepSee works inside the DBMS, i.e. to get to it, you need to log in to the Caché management portal, DeepSeeWeb works as a simple client to the server using REST requests, which are described in the Cdée package of MDX2JSON, but nothing prohibits us to write our requests; language - Caché ObjectScript (COS). Each request is:
"Declaration" in the default class handler (class file with code in COS), for example, REST.cls. This class creates the following XDATA section:
And in it we can determine the server's response to client requests, each request is announced as follows:
where Url is the actual name of the request, http: // <our server> / <application name> / Url
in Url, you can also pass the arguments arg1, arg2 ... then the query will take the form
http: // <our server> / <application name> / Url / arg1 / arg2
then the request method is specified (POST, GET, DELETE and etc.), and the Call is completed - a function that will actually process our request.
Many should be interested in what kind of <application name> we embed in our request. In order to have access to REST functions, it is necessary to create a Web application in the DBMS

Here we have to give him the very name by which the server understands what we want from him and define the class handler for REST requests.
But, perhaps, enough theory, you can return to this issue in more detail next time. And given that there is very little information in the ru-space about DeepSee, the next time will certainly be.
Let's continue about DeepSeeWeb.
Let's take it step by step.
Main menu:
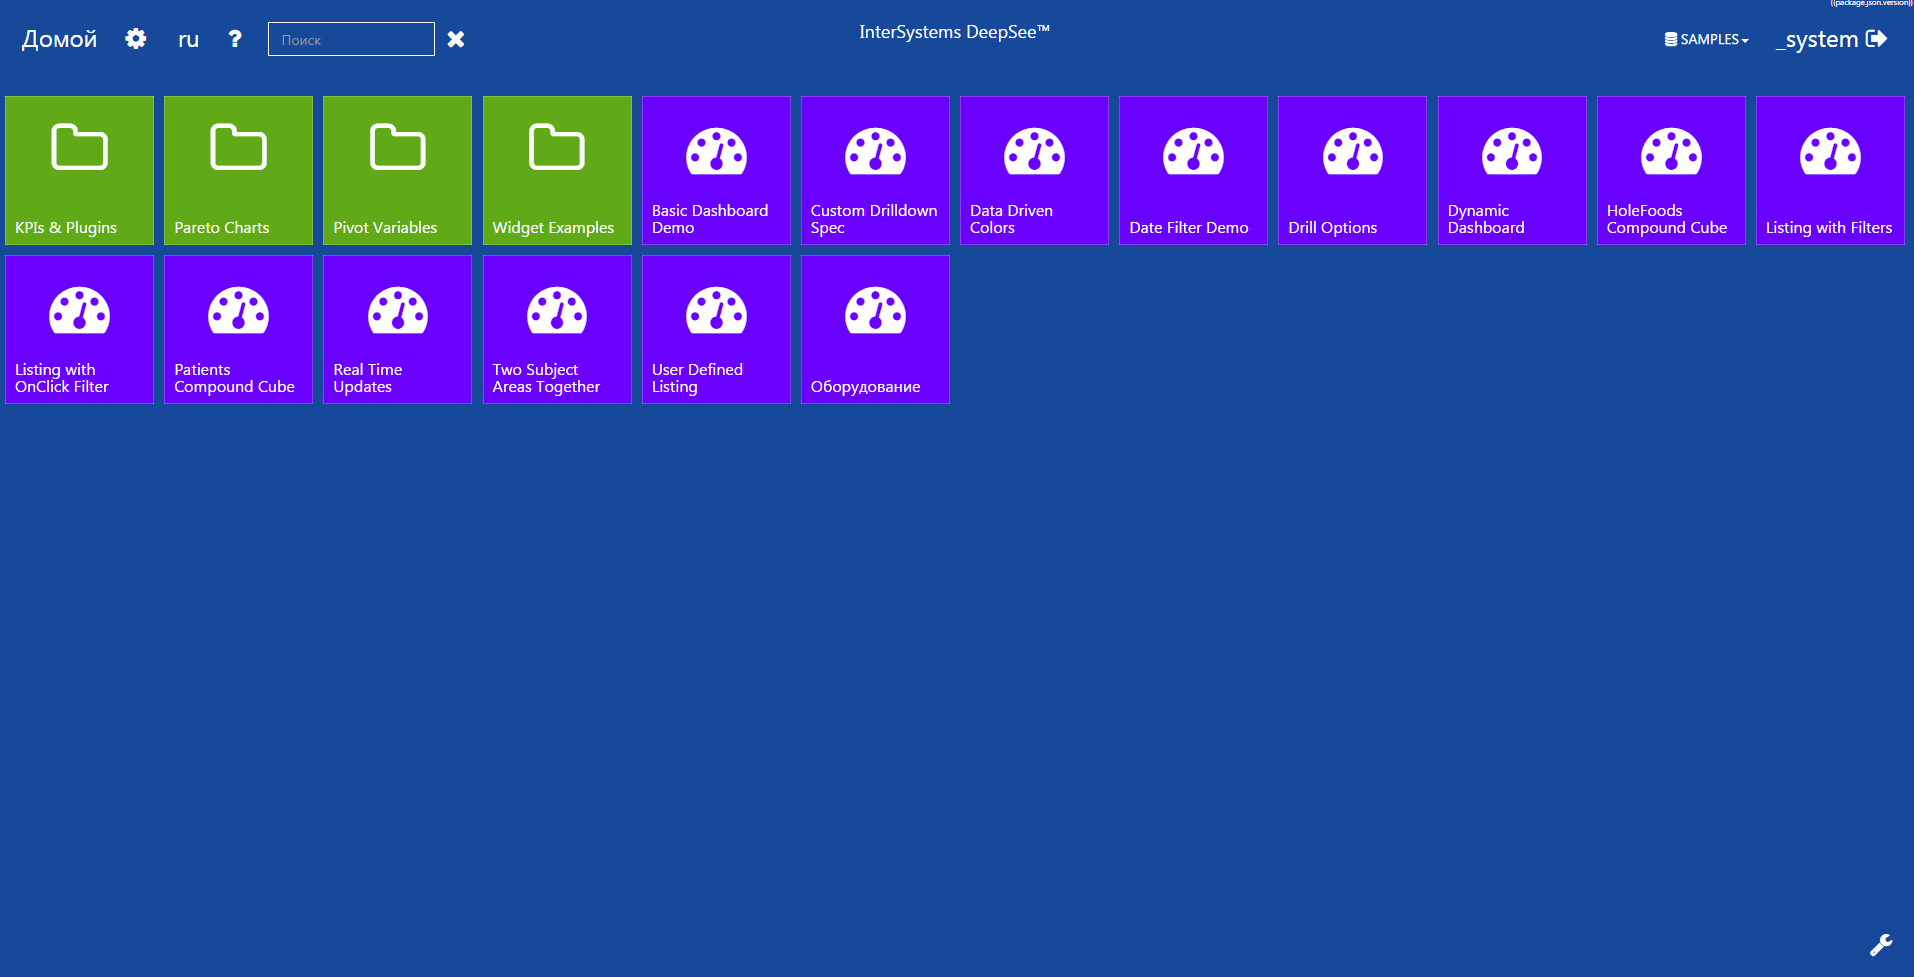
The site loaded all the previously created in DeepSee (old design) dashboards and brought them to us in the style of Metro, keeping the original structure, which was in the folders, there remained. The wrench icon at the bottom of the screen will not slip away from attentive eyes, it is a transition to the settings mode for the appearance of the menu bars.

You can change the color, icon, title and text color. However, the most interesting is the ability to display on the tile data of one of the graphs that is on the selected dashboard.
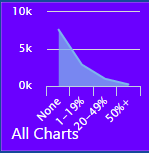
Acquainted with the menu, let's move on and go inside the dashboard.
Each old design widget has its own counterpart in the new one, communication is carried out at the expense of the widget type, when requesting a list of all the widgets, the client gets their name, type and request for receiving data, then compares the existing types on the client with those received and displays them. The widgets themselves are “drawn” using the Highcharts library, it is a very powerful tool for data visualization, it provides dozens of various charts for development - graphs, linear, columnar, circular, time lines, as well as many methods for customizing them, Libraries are just a huge API that allows you to get everything up to the charts.
And as soon as you get acquainted with Highcharts, you will certainly want to see some charts on your dashboards, and ... You know the disappointment, as I once knew it, by default DeepSeeWeb has at its disposal only a part of the charts from a large library ! But we are working with JavaScript, so nothing is impossible for us! And the truth is, the developers expected that someone would want to add something new. And they realized the possibility of adding, even made a beautiful form for this:
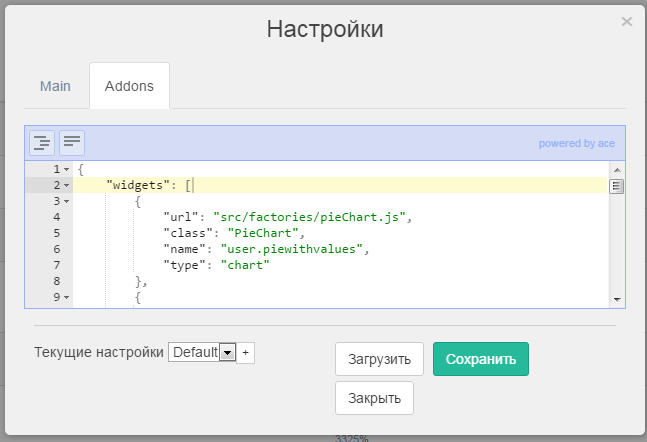
This is a simple JSON editor in which you need to declare an array of widgets and in it each new object will describe a separate widget:
url : the path to the js file describing the widget
This file is an angular factory.
class : the name of the factory in the specified file
name : the name of the widget that we describe
type : type of the widget, chart indicates that the new widget will display the chart from the Highcharts library, there are also the types “pivot”, “text”, “map” - table, text and map.
Now back to the name property, from where to actually get the name of the new widget, because to describe something, you need to create it. Creating new widgets turned out to be the most difficult task for me, but it was all very simple, just read the README carefully.
So, to create a new widget, you need to create a new class in Cache, I made it to the studio, which is included in the Cache package.

EVERYTHING! Create a new file, write in it:
And ready, the new widget is created. To display it on the dashboard, you need to put it there, go to the management portal of the old DeepSee and add the widget and if previously we chose from what was already

Now we select from the category the portlet widget we created:
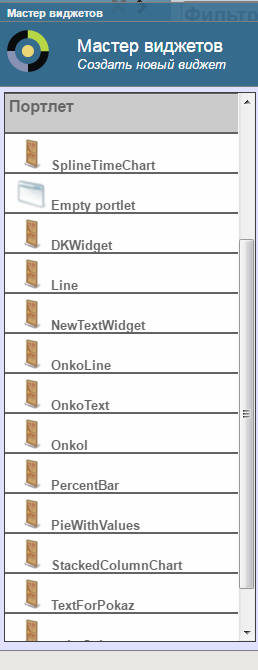
Here is a list of all the widgets I created.
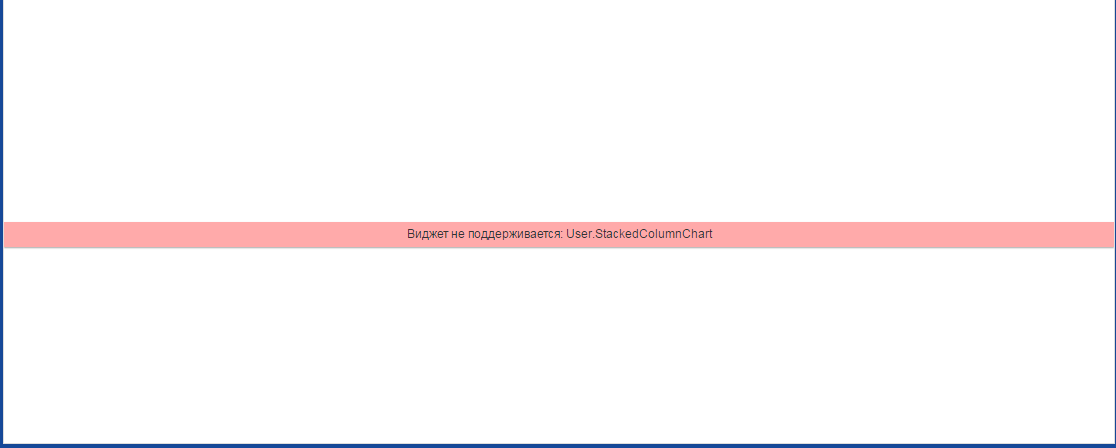
The user widget that is not described in the settings looks exactly like this; it reports that it does not know such a widget and has no idea what to do with it.
Now we all know how to add our own widgets and let's try. First add a new widget from the Highcharts library.
For example, one that shows how many visits we had on the site in the context of each hour.
According to Highcharts such graphics are called spiderWeb . Create a file SpiderWeb.js and write there:
Now let's create a class in Cache, and in order not to be confused, let's call it also SpiderWeb.
User here is the name of the folder in which the file will lie, the folder can be any. Next we will add a new widget to the settings, as we remember, we already have one widget from the example above, so now the settings will take the following form:
Now adding this widget in the old portal, we will see it on the new one exactly as we wanted.
The article turned out terribly tightened, I hope the information will be useful, and next time you can start adding a widget that has nothing to do with the Highcharts library, it will be much more interesting, and you will see what opportunities DeepSee can open before you if used correctly.
And the openness of DeepSeeWeb allows the community to participate in the development of the project, which allows it to absorb the best ideas. Although I have done only one pull-request in 3 months of work, here I am so greedy!
To incite interest, here is a screen for you that I got as the first version of my work on the DeepSee BI system.
Of the new interesting features - filter by date (right corner) and a text widget.
PS Sorry for the lack of data, we have not yet decided what to show, and what to hide, so we hide everything.
→ Link to DeepSeeWeb
DeepSee is an OLAP cubes that “look” at a selected table of a selected region, such cubes can be filtered across all fields of the source table, which allows you to view data from any point. For example, one of the tasks was to display information about births. DeepSee allowed creating tables showing how many children were born over the past year on the basis of cubes, and dividing them into groups according to gender, weight, body length, age of mothers and place of birth. Also for each parameter you can set the conditions of DrillDown - dropping into the parameter, so instead of a year we can see how much was born in a particular month, day, hour.
Sounds good, right? The way it is!
However, as always in any barrel of honey there is a fly in the ointment, in the case of DeepSee this is the design in which the data is presented:
')
In this form, it is not worthwhile to show analytics to anyone, or we will be accepted as creepy conservatives or people who have no taste.
Fortunately, I found salvation, in github, a completely open product called DeepSeeWeb (DSW) is a website created using jQuery and AngularJS. And if pure DeepSee works inside the DBMS, i.e. to get to it, you need to log in to the Caché management portal, DeepSeeWeb works as a simple client to the server using REST requests, which are described in the Cdée package of MDX2JSON, but nothing prohibits us to write our requests; language - Caché ObjectScript (COS). Each request is:
"Declaration" in the default class handler (class file with code in COS), for example, REST.cls. This class creates the following XDATA section:
XData UrlMap { <Routes> And in it we can determine the server's response to client requests, each request is announced as follows:
<Route Url="/Test/:arg1/:arg2" Method="GET" Call="Test"/> where Url is the actual name of the request, http: // <our server> / <application name> / Url
in Url, you can also pass the arguments arg1, arg2 ... then the query will take the form
http: // <our server> / <application name> / Url / arg1 / arg2
then the request method is specified (POST, GET, DELETE and etc.), and the Call is completed - a function that will actually process our request.
Many should be interested in what kind of <application name> we embed in our request. In order to have access to REST functions, it is necessary to create a Web application in the DBMS
Here we have to give him the very name by which the server understands what we want from him and define the class handler for REST requests.
But, perhaps, enough theory, you can return to this issue in more detail next time. And given that there is very little information in the ru-space about DeepSee, the next time will certainly be.
Let's continue about DeepSeeWeb.
Let's take it step by step.
Main menu:
The site loaded all the previously created in DeepSee (old design) dashboards and brought them to us in the style of Metro, keeping the original structure, which was in the folders, there remained. The wrench icon at the bottom of the screen will not slip away from attentive eyes, it is a transition to the settings mode for the appearance of the menu bars.
You can change the color, icon, title and text color. However, the most interesting is the ability to display on the tile data of one of the graphs that is on the selected dashboard.
Acquainted with the menu, let's move on and go inside the dashboard.
Each old design widget has its own counterpart in the new one, communication is carried out at the expense of the widget type, when requesting a list of all the widgets, the client gets their name, type and request for receiving data, then compares the existing types on the client with those received and displays them. The widgets themselves are “drawn” using the Highcharts library, it is a very powerful tool for data visualization, it provides dozens of various charts for development - graphs, linear, columnar, circular, time lines, as well as many methods for customizing them, Libraries are just a huge API that allows you to get everything up to the charts.
And as soon as you get acquainted with Highcharts, you will certainly want to see some charts on your dashboards, and ... You know the disappointment, as I once knew it, by default DeepSeeWeb has at its disposal only a part of the charts from a large library ! But we are working with JavaScript, so nothing is impossible for us! And the truth is, the developers expected that someone would want to add something new. And they realized the possibility of adding, even made a beautiful form for this:
This is a simple JSON editor in which you need to declare an array of widgets and in it each new object will describe a separate widget:
url : the path to the js file describing the widget
This file is an angular factory.
function PieChart(Utils) { function CustomWidget($scope) { …… } } angular.module('widgets') .factory('PieChart', ['Utils', PieChartFact]); class : the name of the factory in the specified file
name : the name of the widget that we describe
type : type of the widget, chart indicates that the new widget will display the chart from the Highcharts library, there are also the types “pivot”, “text”, “map” - table, text and map.
Now back to the name property, from where to actually get the name of the new widget, because to describe something, you need to create it. Creating new widgets turned out to be the most difficult task for me, but it was all very simple, just read the README carefully.
So, to create a new widget, you need to create a new class in Cache, I made it to the studio, which is included in the Cache package.
EVERYTHING! Create a new file, write in it:
Class < > Extends %DeepSee.Component.Portlet.abstractPortlet { } And ready, the new widget is created. To display it on the dashboard, you need to put it there, go to the management portal of the old DeepSee and add the widget and if previously we chose from what was already
Now we select from the category the portlet widget we created:
Here is a list of all the widgets I created.
The user widget that is not described in the settings looks exactly like this; it reports that it does not know such a widget and has no idea what to do with it.
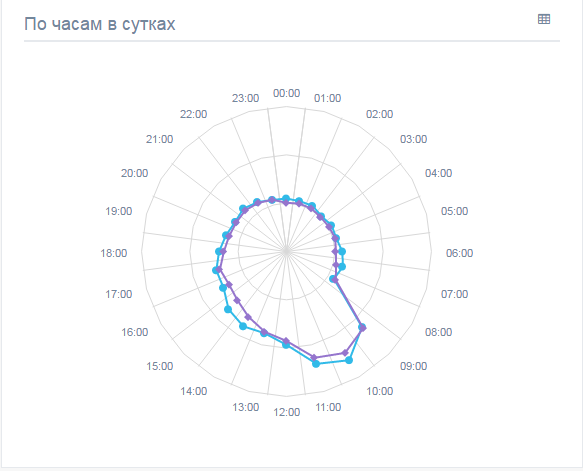
Now we all know how to add our own widgets and let's try. First add a new widget from the Highcharts library.
For example, one that shows how many visits we had on the site in the context of each hour.
According to Highcharts such graphics are called spiderWeb . Create a file SpiderWeb.js and write there:
function SpiderWebFact(BaseChart, Utils) { function SpiderWebChart($scope) { // scope //highcharts- BaseChart.apply(this, [$scope]); var _this = this; // bar, column, line, area, pie this.setType('line',true); // this.requestData(); // SpiderWeb var ex = { options: { plotOptions: { series: { // 0, // connectNulls: true } }, // tooltip: { shared: true, useHTML: true, formatter: function () { var t = this; /* jshint ignore:end */ var a= "<b>"+t.x+":00</b><table style = 'width: 100%;'>"; var all = 0; for(var i =0;i<t.points.length;i++) { var val = t.points[i].y; all+=val; val = val.toString().replace(/\B(?=(\d{3})+(?!\d))/g, " "); a += '<tr><td>'+_this.toTitleCase(t.points[i].series.name)+': </td><td style="text-align: right">' + '<b>' + val + "</b></td></tr>"; } if(t.points.length>1) a+= "<tr><td style = 'font-style: italic; font-weight: bold;'>: </td><td style='text-align: right'><b>"+all.toString().replace(/\B(?=(\d{3})+(?!\d))/g, " ")+"</b></td></tr><br></table>"; return a; } } }, yAxis: { // SpiderWeb, , gridLineInterpolation: 'polygon', lineWidth: 0, min: 0 }, xAxis: { // 00, // 01,02,03 … labels: { formatter: function () { return this.value + ':00'; } } } }; // Utils.merge($scope.chartConfig, ex); } return SpiderWeb; } // angular.module('widgets') .factory('SpiderWebChart', ['BaseChart', 'Utils', SpiderWebFact]); Now let's create a class in Cache, and in order not to be confused, let's call it also SpiderWeb.
Class User.SpiderWeb Extends %DeepSee.Component.Portlet.abstractPortlet { } User here is the name of the folder in which the file will lie, the folder can be any. Next we will add a new widget to the settings, as we remember, we already have one widget from the example above, so now the settings will take the following form:
{ "widgets": [ { "url": "src/factories/pieChart.js", "class": "PieChart", "name": "user.piewithvalues", "type": "chart" }, { "url": "src/factories/ SpiderWeb.js", "class": " SpiderWeb Chart", "name": "user.spiderweb", "type": "chart" } Now adding this widget in the old portal, we will see it on the new one exactly as we wanted.
The article turned out terribly tightened, I hope the information will be useful, and next time you can start adding a widget that has nothing to do with the Highcharts library, it will be much more interesting, and you will see what opportunities DeepSee can open before you if used correctly.
And the openness of DeepSeeWeb allows the community to participate in the development of the project, which allows it to absorb the best ideas. Although I have done only one pull-request in 3 months of work, here I am so greedy!
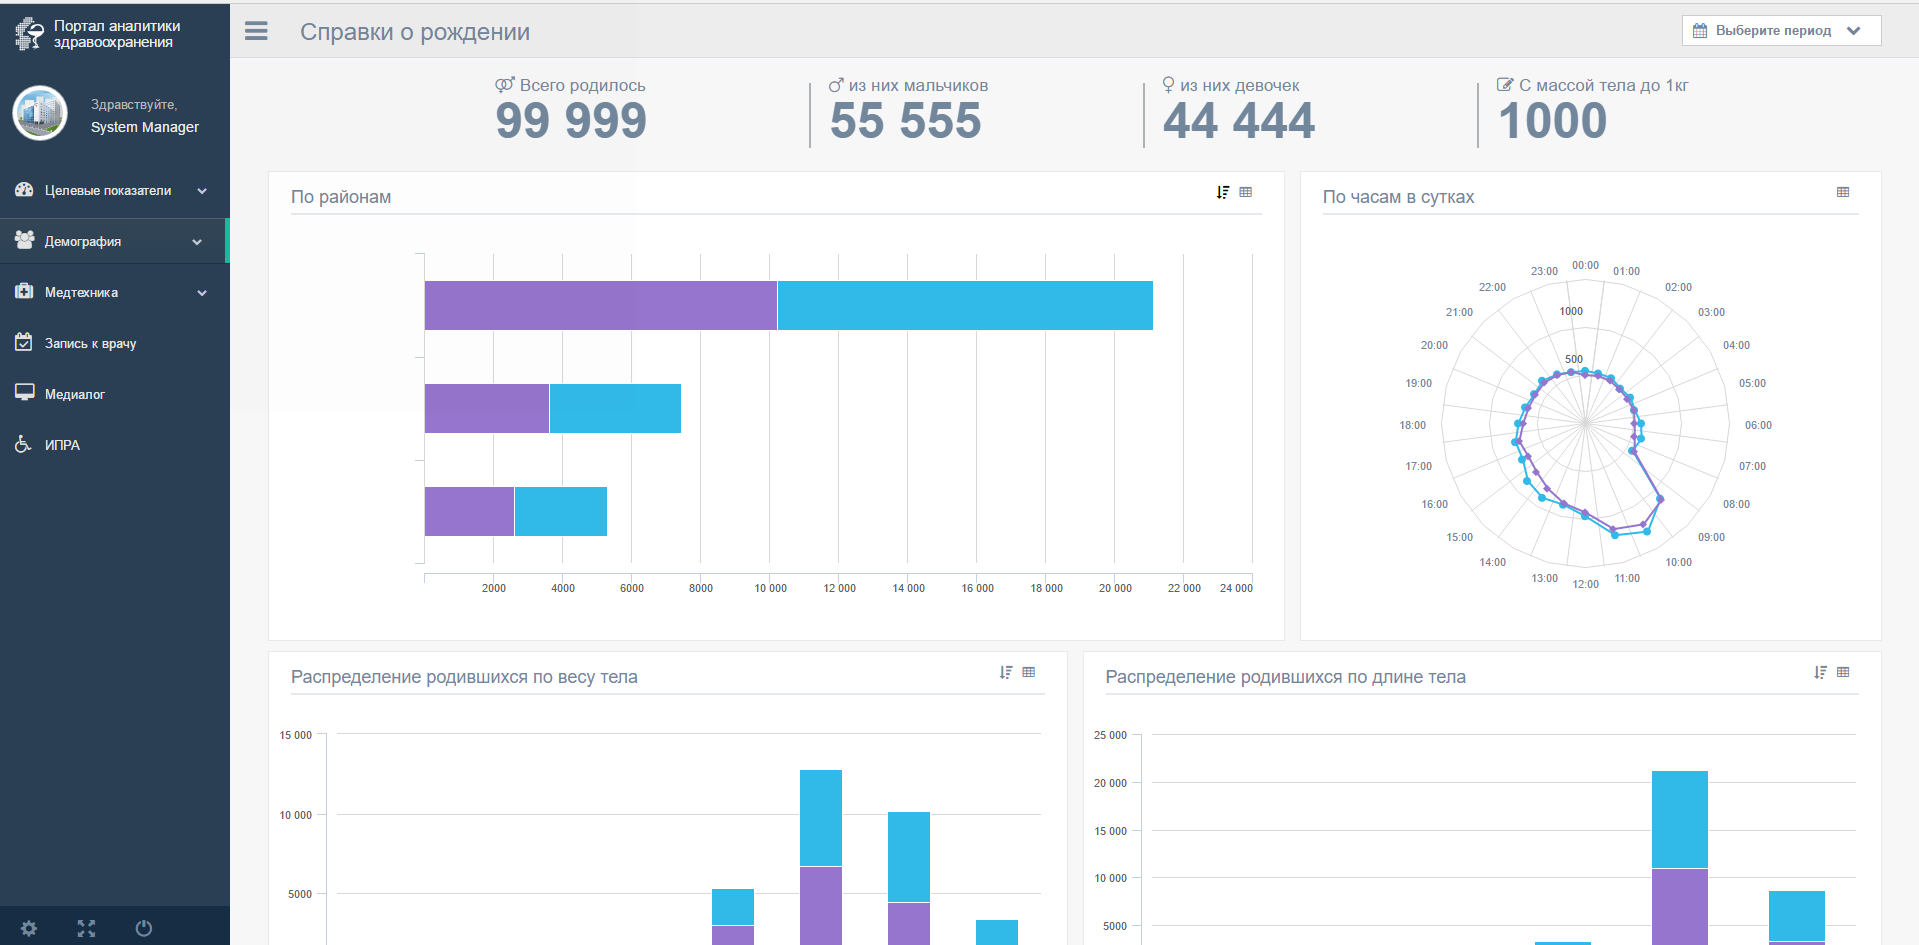
To incite interest, here is a screen for you that I got as the first version of my work on the DeepSee BI system.
Of the new interesting features - filter by date (right corner) and a text widget.
PS Sorry for the lack of data, we have not yet decided what to show, and what to hide, so we hide everything.
→ Link to DeepSeeWeb
Source: https://habr.com/ru/post/315956/
All Articles