Monitoring Elasticsearch through pain and suffering

We finally finished monitoring the elasticsearch before the public release. In total, we reworked it three times, because the result did not suit us and did not show the problems that we had on our ES cluster.
Under the cut the story about our production cluster, our problems and our new monitoring ES.
Super Short Elastic Course
Elasticsearch is a distributed, self-scalable RESTful full-text search service built on the Apache Lucene library.
ES Terminology:
- A node (node) is a JVM process running on a server.
- Index (index) - a set of documents on which you want to search, in the index there can be several types of documents
- Shard (shard) - part of the index. Indexes are divided into parts in order to distribute the index and its requests between servers.
- Replica (replica) - a copy of the shard. Each index piece is stored in multiple copies on different servers for failover.
Inside, every shard is an index, but in Lucene terms, and it is divided into segments.
How we use ES
All metrics in okmeter.io have tags, in other words, the key-value dictionary is the identifier of the metrics in our system, for example:
{name: net.interface.bytes.in, site: okmeter, source_hostname: es103, plugin: net, interface: eth1}{name: process.cpu.user, site: okmeter, source_hostname: es103, plugin: process_info, process: /usr/bin/java, username: elasticsearch, container: ~host}{name: elasticsearch.shards.count, site: okmeter, source_hostname: es103, plugin: elasticsearch, cluster: okmeter-ovh, index: monthly-metadata-2016-10, shard_state: active, shard_type: primary}
Each such metric identifier dictionary is a document in ES. For example, to build such a graph
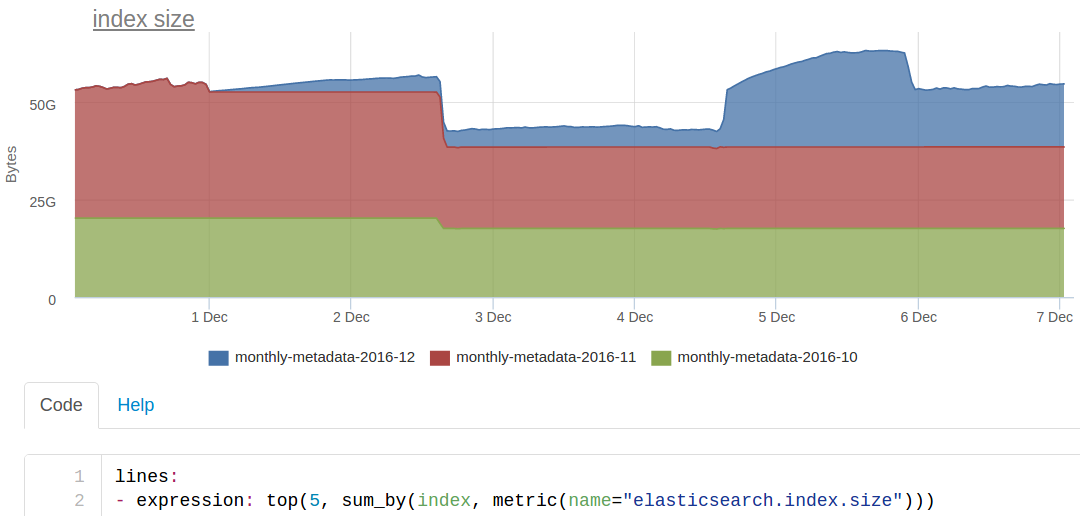
we are looking at ES for this (very simplified) request
site:okmeter AND name:elasticsearch.index.size it returns some id metrics by which we retrieve the values of the metrics from cassandra.
Cluster Status
ES itself believes that a cluster can be in three states:
- green - the required number of copies of each shard of each index is available
- yellow - some copies of the shard are either in the state of migration, or are not attached to the nodes
- red - part of the index is not available at all
The main schedule of our standard ES dashboards was chosen based on the same conditions:
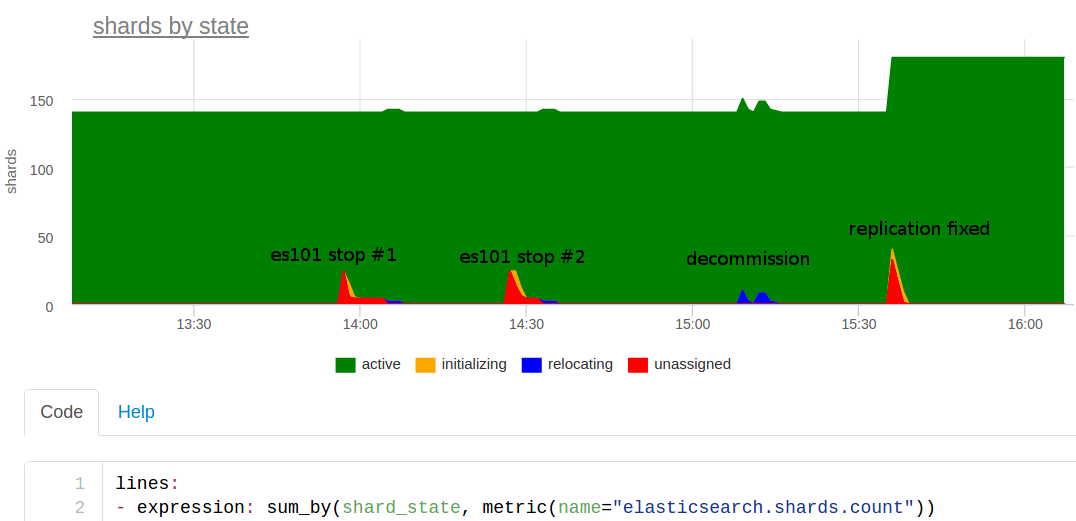
I'll tell you about this day. The day before we added more powerful servers to the cluster, and now we had to remove two old nodes. At about 2:00 pm, I had an idea about whether or not to hold the exercises? We discussed and decided that we could experiment - turn off one node and see how this elastic elastic will work out.
They turned off, and immediately started monitoring that there was a problem on the metrics collector. Why ??
We returned the node, waited a bit, everything was fine. Strange, well, it can not be such that due to the shutdown of one of several elastics, we lie down. Probably something else ...
Turned off the node again somewhere at 14:30 - again alerts. Hmmm The teachings showed that the fall of one elastic makes us painful - the same result, but you need to understand.
Made some sort of decommission - carefully brought out the nodes on one of the cluster. The blue on the graph at 15:10 is it, the shards moved to other nodes. There were no problems.
Looked at the number of shards: 140 - strange, number_of_shards is 20, number_of_replicas is 2, and another master copy, i.e. there should be 60 shards per index. There are 3 indices for each month, so there should be only 180 shards. It turned out that the December index was created with number_of_replicas - 0, i.e. without replicas, so turning off any node completely breaks down the work with this index!
It is good that the lack of replicas was found in a controlled experiment. If we hadn’t noticed this, we could have a big problem in the future - we would have to rush through a complete re-indexing of the data from the main storage.
To see this problem in the future, we made an automatic trigger that will report if there are 0 replicas in some index. This trigger was released as an auto trigger for all clients at once, we are a monitoring service :)
Split brain
The most frightening and well-known problem with elastic is the split brain , when due to problems with connectivity of nodes over the network, or if the node did not respond for a long time (because it was stuck in the GC for example), a second master node may appear in the cluster.
In this case, it turns out like two versions of the index, some documents are indexed into one part of the cluster, others into the other. Non-consistency will appear in the search - different results will be issued for the same query. Restoring the index in such a case will be a difficult task; most likely, it will be necessary to either complete reindexing or restoring from the backup and with the following topping up the changes to the current moment.
In ES there is a protection mechanism against split-brain, the most important setting is minimum_master_nodes , but by default discovery.zen.minimum_master_nodes: 1 , i.e. there is no protection.
We reproduced this on the ElasticSearch test cluster and made two auto-triggers based on the results: one will work if it sees more than one master node in the cluster, the second will warn if the discovery.zen.minimum_master_nodes parameter is less than the recommended - quorum (N / 2 + 1) from the current cluster size. It needs to be monitored, because you can decide to add a node and forget to correct minimum_master_nodes .
Monitoring requests to elastic
We sort of figured out the state of the cluster, then we need to understand how many queries process the cluster and how quickly they work out.
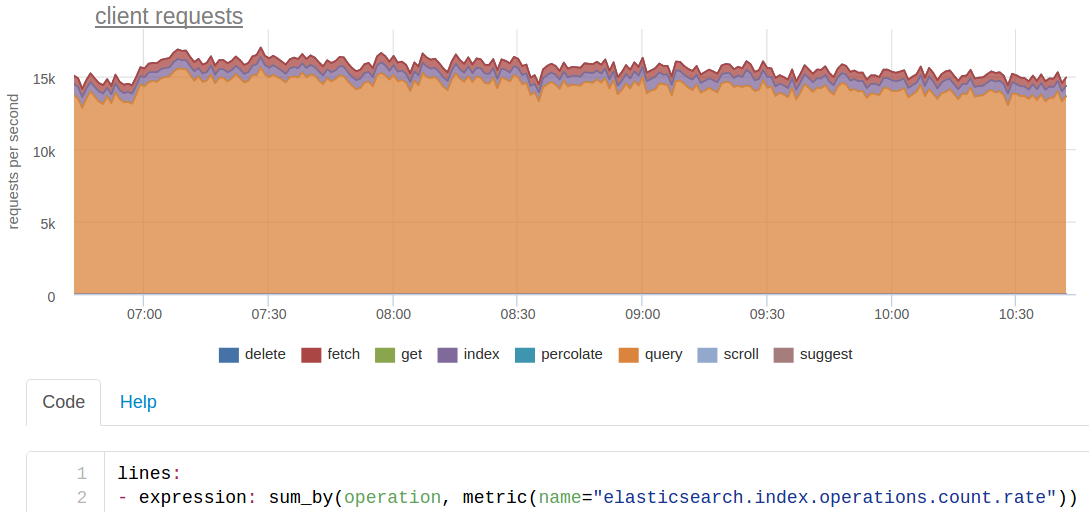
We do any search on our ES by three indices at once, each of which is divided into 20 shards. Because of this, the initial ~ 250 requests per second for searching from our code for ES turn into ~ 15 thousand.
We actually have about 200 requests per indexing per second, but since each shard is stored in three copies (main + 2 replicas), the ES sees ~ 600 rps.
For the times of the requests, ES provides rather scant statistics: there is a counter of the processed requests and there is a cumulative sum of the times of requests by types. Thus, we can calculate only the average response time for each type of requests, we get a graph of this type (we calculate the average right when drawing the graph, since the sum of the response times is also an interesting metric in itself):
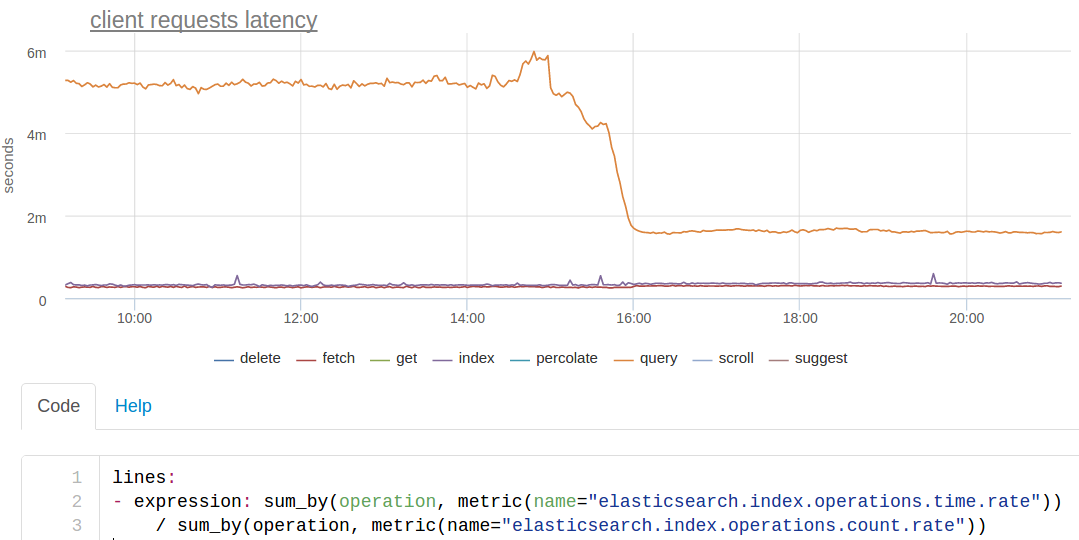
The orange line is a search. It is seen that at some point it accelerated approximately 3 times.
This we just made force merge segments. We index cut monthly. It is always indexed (almost) in the current month, it is searched by three. Since only the reading of the indices from the previous months goes, we can make force merge segments on them right under the load:
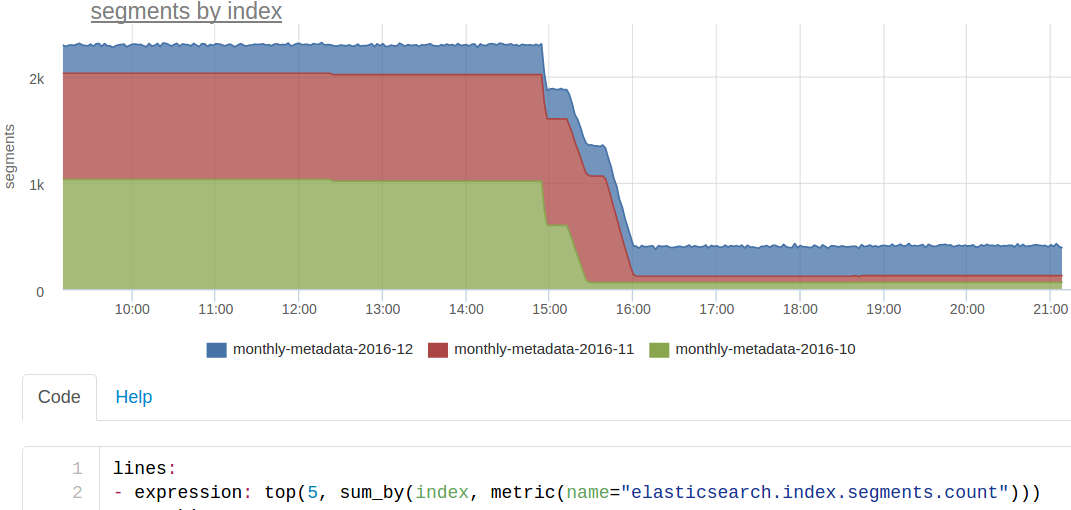
As a result, one segment remained in each shard, the search for these indices became noticeably faster. Perhaps we should make the kroons, which will make the force merge index over the past month.
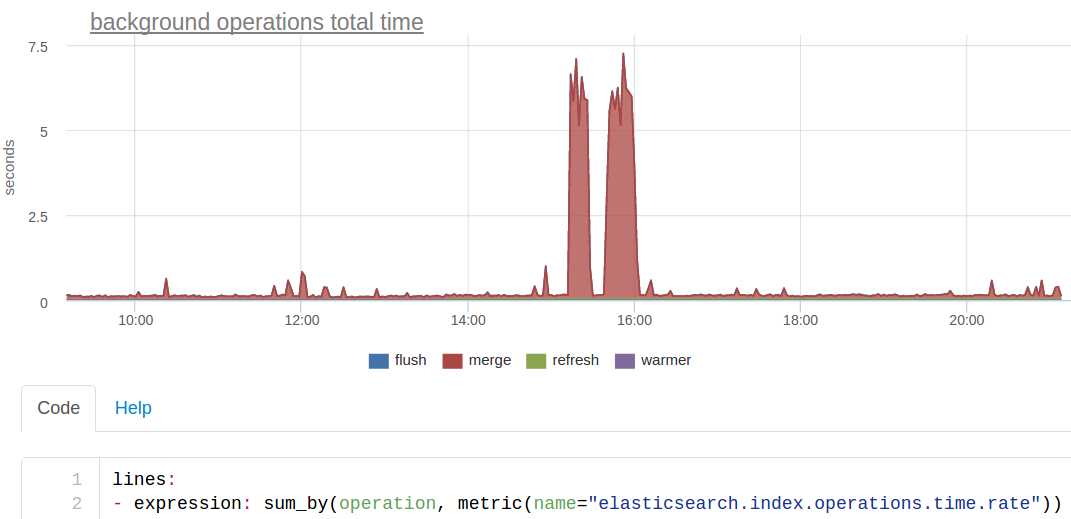
Background ops graphics
In addition, we separately deduced the "background" operations - this is what the elastic does in the background itself or on request as with force merge. Separately, because it is more logical to see "user" requests separately from "system": they have completely different timings - seconds instead of milliseconds, so it will be inconvenient to look at one graphic. And the number of such operations is very small and can be lost against the background of all user requests.
This graph shows the same merge, which reduced our search response time, but this time it’s more convenient to look at the sum of ES response times (we’re kind of looking at what the cluster’s computational resources were generally spent on):
From the point of view of Linux system metrics, this merge looked like an active writing to disk by the ES process:

Cache
To ensure the speed of query execution in elastic there are caches:
- query_cache (formerly called filter_cache ) - bitsets of documents that are matched to a specific filter in the query
- fielddata_cache - used for aggregations
- request_cache - the shard caches the response to the entire request
More details on what is cached when it is cached, when it is invalid, as it is better to read in documentation.
Our monitoring agent will remove for each of these caches: size, hits, missy, eviksheny (vystsezheniya).
Here, for example, was the case - the elastics have dropped by OutOfMemory. It is difficult to figure out the logs, but then, when we’ve already raised, we noticed a sharp increase in the memory usage of the fielddata cache on the graph:

Actually, we do not use elasticsearch aggregation, we generally use only the most basic functionality. Without scoring, we need to find all the documents in which the given fields have given values. Why has the use of fielddata cache increased so much ?
It turned out that it was also a controlled experiment :-) Manually curl pulled heavy requests for aggregation, and from this everything fell. In theory, it was possible to protect against this by correctly setting the memory limits for fielddata . But either they did not work, or elastic bugs (we then sat on the old version 1.7).
System metrics
In addition to the internal metrics of an elastic, you should look at it from above, like a process in the operating system. How much CPU time it consumes, how much memory, how much load on the disk.
When we started updating ES from version 1.7.5, we decided to upgrade to 2.4 right away (the last, the five, while we are afraid). The major update elastic according to the standard procedure is somehow dumb, we usually raise the second cluster and make a synchronous copy through our code - it can index into several clusters at once.
When you turn on the new cluster in the indexing, it was found that the new ES writes to disk ~ 350 times per second, while the old one only ~ 25:
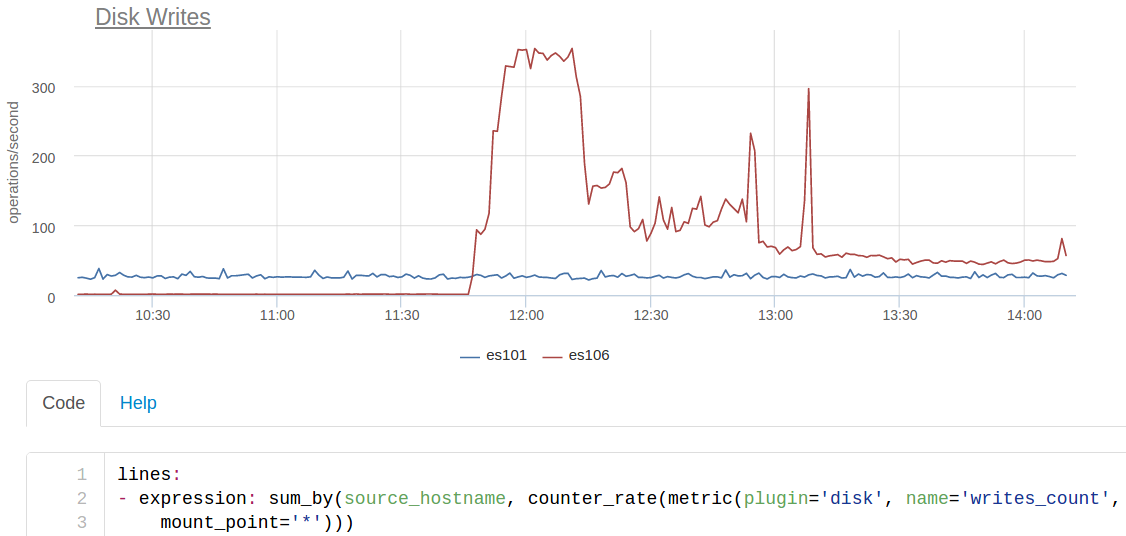
es101 is the node from the old cluster, and es106 is from the new one. Plus, the new nodes did not put the SSD (they thought that everything would fit into the memory), so this io dropped the performance very much.
Let's reread all the newer versions of elastic 2 and find index.translog.durability . It defaulted to request , with this value translog splits to disk after each index request. Changed to async with standard sync_interval in 5 seconds and it was almost like before.
In addition to the system metrics for ES, it is useful to look at the JVM metrics - gc, memory pools, and so on. Our agent will automatically pick it all up via jmx, and the graphs will also appear automatically.
Automatic ES detection
Not so long ago, we already said that we spend a lot of energy on the fact that all services on our clients' servers are included in monitoring automatically, without configuration. Such an approach allows not to forget anything to monitor and greatly accelerates the implementation.
Autodetect for ES is like this:
- in the list of processes we find a process similar to ES: jvm with the launch class org.elasticsearch.bootstrap
- start line trying to find the config ES
- we read a config, we understand listen IP and port
Next thing is the technique - periodically we remove metrics using the standard API and send them to the cloud.
Instead of conclusion
We always try to start from real use cases. To fix the monitoring of a service, we have to thoroughly deal with it, to understand what and how it might break. Therefore, in the first place, we did support those services that we are good at preparing and using ourselves.
In addition, customers who talk about their problems are very helpful. We are constantly refining dashboards / auto-triggers, in order to eventually show not some graphics, but immediately the causes of problems.
If you have an ES that is waiting to be monitored, our free 2-week trial is what you need, a link to the site below :)
')
Source: https://habr.com/ru/post/315860/
All Articles