Five systemd tools to start using right now

This article is intended to acquaint the reader with the toolkit in the systemd arsenal.
When you finally manage to put up with the departure of systemd from the principles that underlay the Old Testament System V with its simple text files and the dominance of scripts, you begin to see the undeniable advantages of the new initialization system and the tools supplied with it. In this article we will talk about four of them, and also mention another one that you probably already know, but are unlikely to use the method described here.
So, let's begin!
coredumpctl
This tool, as his name helpfully suggests, is used to get memory dumps from the systemd log.
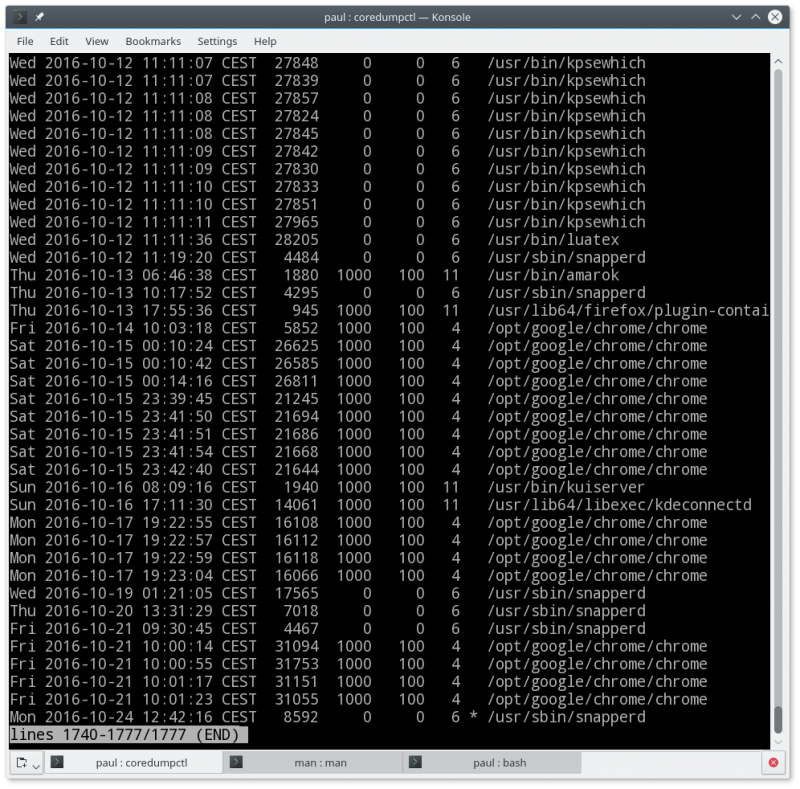
The coredumpctl command will return a general list of all memory dumps, in which there may be entries for several weeks, or even months of the system.

Fig. 1. coredumpctl displays a list of all memory dumps registered in the log.
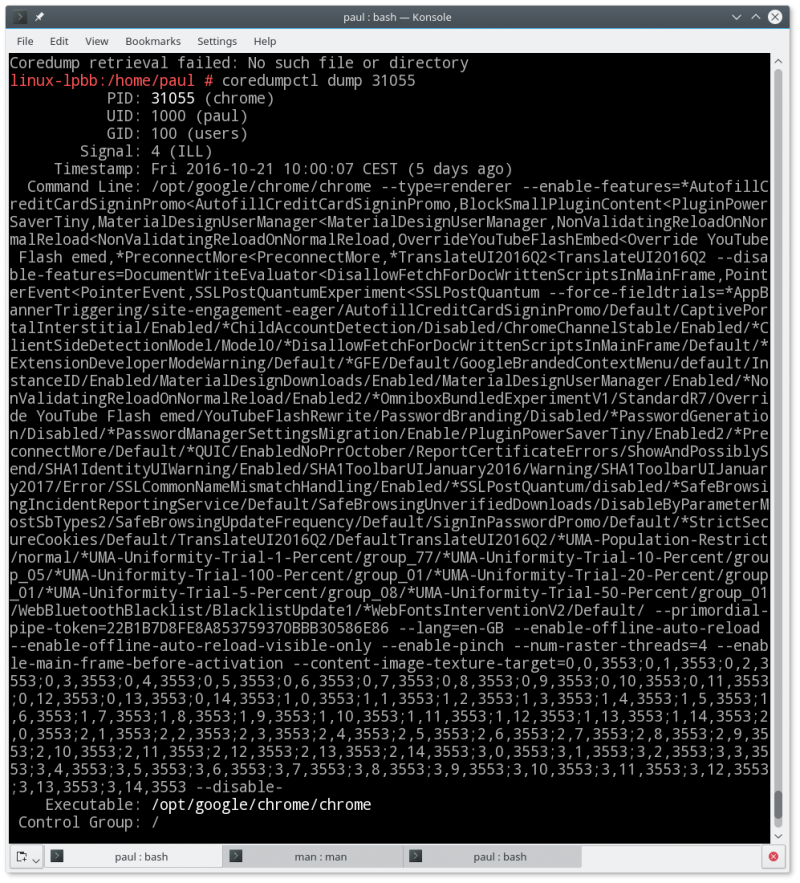
Having coredumpctl dump filter , you can get more detailed information about the latest filter dump that is suitable for the filter:
coredumpctl dump 1758 This command will display all the details of the last dump with PID 1758. And since the systemd log covers more than one session (mine, for example, starts in May), there may be several unrelated dumps from processes with the same PID.

Fig. 2. The dump modifier allows you to get more detailed information about the memory dump.
It is also possible to set a filter by the name of the executable file:
coredumpctl dump chrome As in the case of PID, this command will display information only about the latest dump, since in most cases it is he who is needed.
The memory dump filter can use the PID, the name of the executable file, the path that must contain at least one slash (for example, / usr / bin / name_of_executable ), and one or more general predicates journalctl . The last option is shown in the following example:
coredumpctl dump _PID=1758 This command is essentially identical to coredumpctl dump 1758 . And here is a more interesting example of using journalctl predicates, where we are interested in timestamp :
coredumpctl dump _SOURCE_REALTIME_TIMESTAMP=1463932674907840 A list of journalctl predicates can be found in the file system's JOURNAL FIELDS documentation file man systemd.directives .
Besides dump , there are other options for Coredumpctl . For those who want to start debugging right away, the following command will not only display all the information about the dump, but also open the GNU debugger (gdb):
coredumpctl gdb 1758 bootctl
Did you know that systemd-boot now controls booting, not GRUB? Yes, this is another function that has been crushed by itself, it seems, that systemd , which is no longer able to stop. True, this is only for systems with UEFI.
Learning how to configure a bootloader is beyond the scope of this article (if you are really interested, you can find useful information here ), but to install a custom boot configuration you need at least a basic knowledge of the bootctl .
(If you're new to Linux, don't be scared. You will most likely not have to do anything from the one presented in this section. Your distribution will take care of that. Everything written here is primarily intended for absolute control enthusiasts (for example, Arch users). Linux.) These people cannot sleep at all while there is at least one parameter left on their system that they haven’t tried to tweak.)
You need root privileges to work with the bootctl , so you need to respect this tool. One careless movement - and your system will stop loading.
One of the most innocuous bootctl modes is to check the boot status. If / boot does not directly point to the EFI FAT partition, you must manually use the --path = option to specify the path to the EFI boot partition. Here is the command for my openSUSE:
bootctl --path=/boot/efi The result will be a list of all boot options and their corresponding variables. Figure 3 shows the output of the command on my system. This is the default behavior. The full version of the command looks like this: bootctl --path=/boot/efi status .

Fig. 3. The bootctl tool allows you to view and change boot manager settings
In the command output, you can find the boot options and the location of the binary loader file (ESP).
The modified boot configuration is set with the command:
bootctl --path=/boot/path/to/efi install This command will also generate a systemd-boot binary file, save it to boot / path / to / efi / EFI / Boot and add the corresponding call to the top of the boot priority list.
To update the systemd-boot , run:
bootctl --path=/boot/path/to/efi update To remove the systemd-boot from the EFI partition, use:
bootctl --path=/boot/path/to/efi remove Be careful with the last command.
systemd-cgtop, systemctl and systemd-cgls
If the classic top allows you to find processes that load CPUs more and consume memory more actively, systemd-cgtop does the same for control groups (cgroups).
Cgroups is a mechanism for partitioning and isolating system resources to present them to groups of users and tasks. For example, you can use cgroups to set limits on memory and CPU consumption on a system where two groups of users work. A full description of cgroups with examples can be found here .
systemd uses cgroups to control its services, and systemd-cgtop makes sure that all groups behave decently. If someone nevertheless began to behave disgracefully, it is possible to complete the work of the entire group at once, rather than looking for and stopping each process separately.
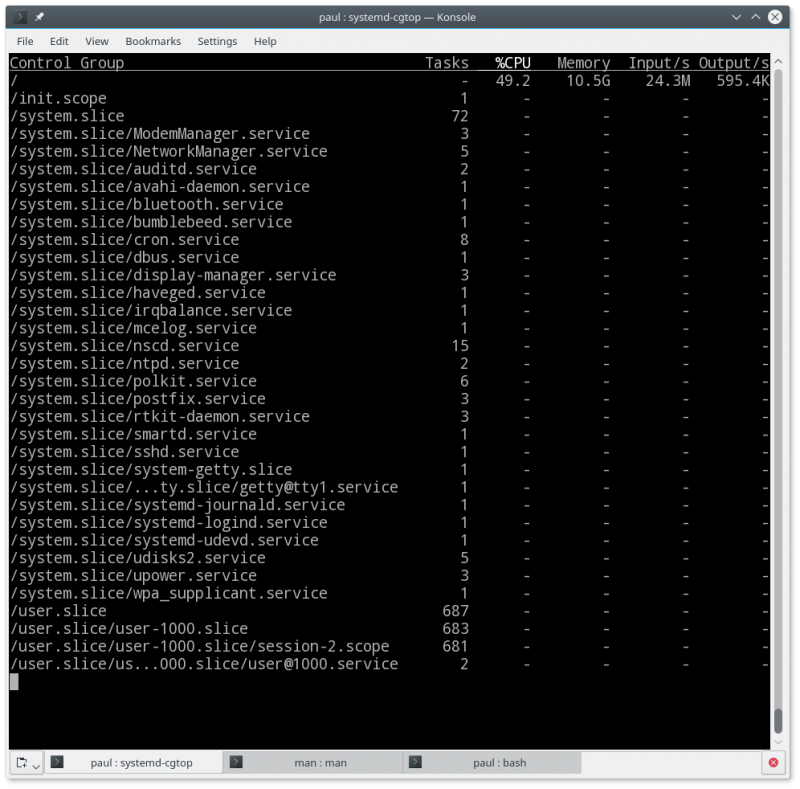
Take a look at Figure 4 for an example of a normally working system. No one abuses resources, and only the general indicators of the activity of all groups of the system were given a numerical designation in the line with the results. In this case, I could get rid, for example, of auditd , he behave in an inappropriate way. And since the system will not stop without this service, I’ll do:
systemctl kill auditd.service And ... ta-dam! He is no more!

Fig. 4 systemd-cgtop reports cgroups behavior
In this case, auditd.service had two tasks associated with it, but there may be hundreds, especially for groups used for end users, so the systemctl is very convenient for working with cgroups .
By the way, to see which processes are associated with a particular cgroup , try the command systemd-cgls /cgroup.name
For example:
systemd-cgls /system.slice/NetworkManager.service And you will see all the processes running in the NetworkManager subgroup.
Conclusion
We considered only a small part of the systemd tools intended for system administration. There are, of course, much more, and in the next article we will talk about a few more. It is also worth remembering that the real power of many tools is hidden in their many options.
If you want to better understand the issues related to systemd , I recommend starting with the bundled documentation:
man systemd.index ')
Source: https://habr.com/ru/post/315706/
All Articles