Code navigation in JetBrains IDE using REST API and command line
When developing applications, one often comes across the need to view the exception stack trace output (in logs or with debug-ing). I would like to be able to automatically get to the necessary place of the code, directly by clicking on the line in the output of stack trace in the browser or in the terminal.
If you are a user of one of the latest products from JetBrains (in particular, PhpStorm), you can use the internal REST API (for navigation from the browser) and command line launcher (for navigation in the terminal) for these purposes.
Browser navigation
A partial description of the JetBrains REST API IDE methods can be found here:
» Http://develar.org/idea-rest-api/
One of the methods of this API is the ability to open a project file and move to an arbitrary position in this file within the IDE itself.
Calls to API method calls are made via a call at http://localhost:63342/
An example of an API call to open a file looks like:
http://localhost:63342/api/file?file=src/path/to/file.php&line=100&column=34
Where:
file - relative or absolute file path
line - the line in the file where you want to move the cursor
column - position on the specified line
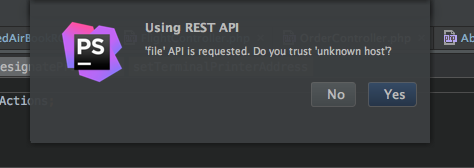
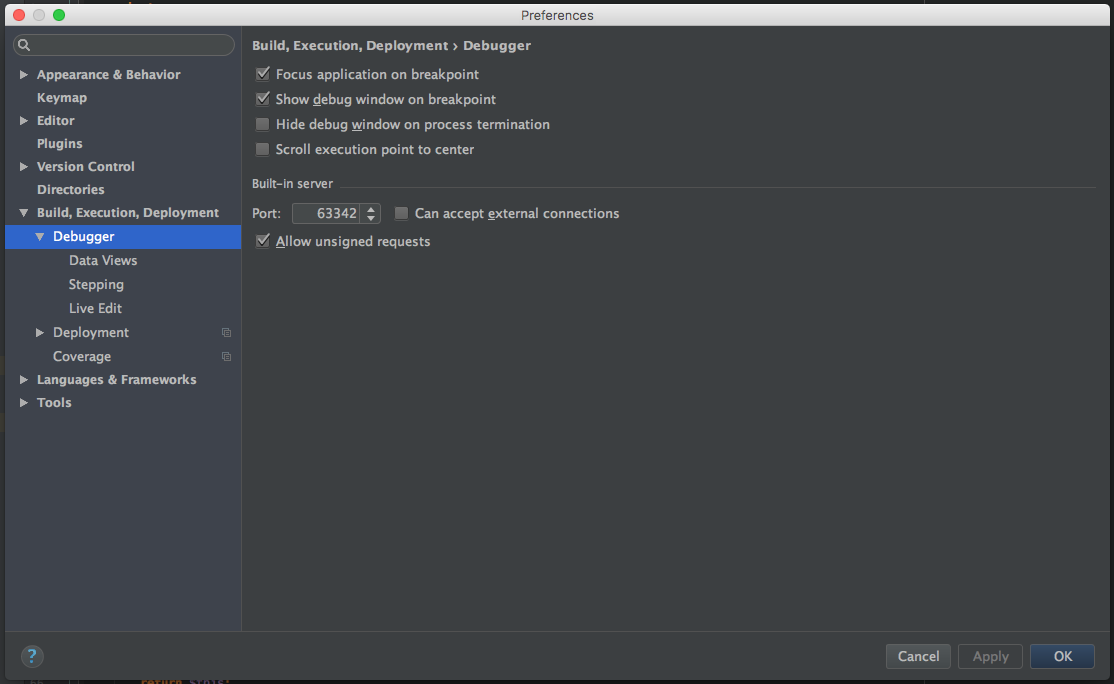
In order to remove the message that appears every time when you call an API in the IDE, you can in the settings: Build, Execution, Deployment → Debugger put a tick "Allow unsigned request" (or each time you have to click the Ok button in the dialog).
Example of processing output of standard getTraceAsString () in php
Below is the Regexp, which handles the standard output stack trace of Exception via getTraceAsString ().
try { // some code }(\Exception $e){ $traceAsString = preg_replace('/#(\d+) (.+?\.php)\((\d+)\):/', '#$1 <a href="#" onclick="_goToEditorCodeLine(\'$2\', \'$3\'); return false;">$2($3):</a>', $e->getTraceAsString() ); // some code } Each line in Exception becomes a link, a click on which opens in the IDE file on the desired line.
You also need to connect the JS function, which will directly "pull" the API method.
function _goToEditorCodeLine(file, line){ var xmlhttp = new XMLHttpRequest(); xmlhttp.open("GET", "http://localhost:63342/api/file?file=" + file + "&line=" + line, true); xmlhttp.send(); } Sample implementation using Exception in Symfony 3 as an example
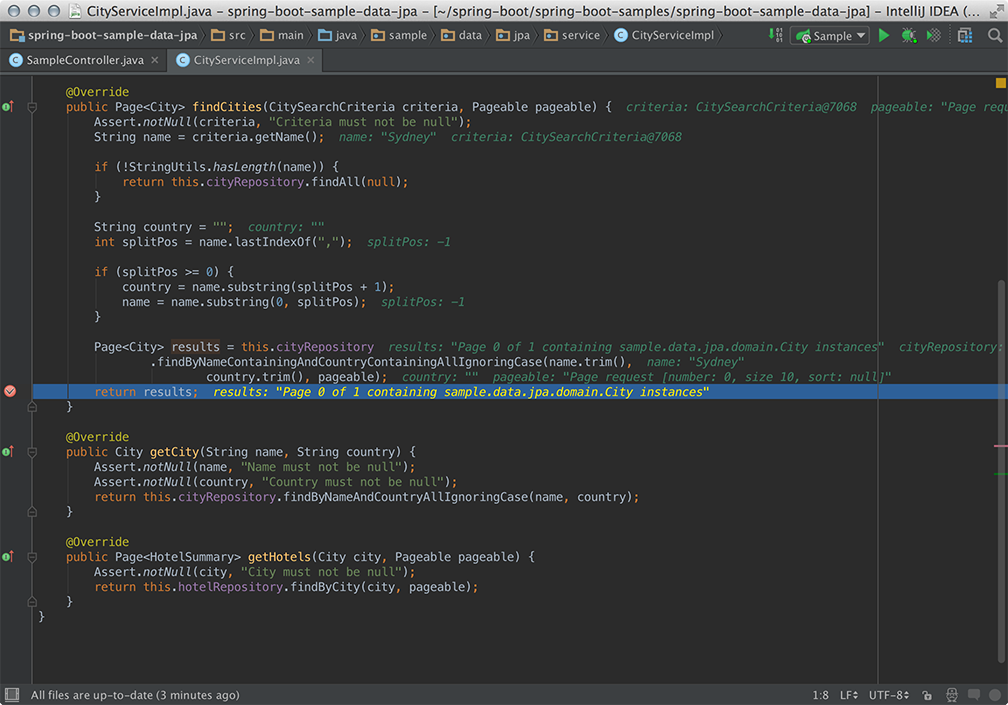
Since I am currently working with symfony, I will show you how to modify a page with standard Exception in order to implement opening an IDE file with a specific example.
In order to override a piece of the template that is responsible for displaying the Exception page, you need to create two files in the app/Resources/TwigBundle/views/Exception/ folder
- exception.html.twig
- trace.html.twig
In the file exception.html.twig add the simplest function _goToEditorCodeLine() , the code of which is described above.
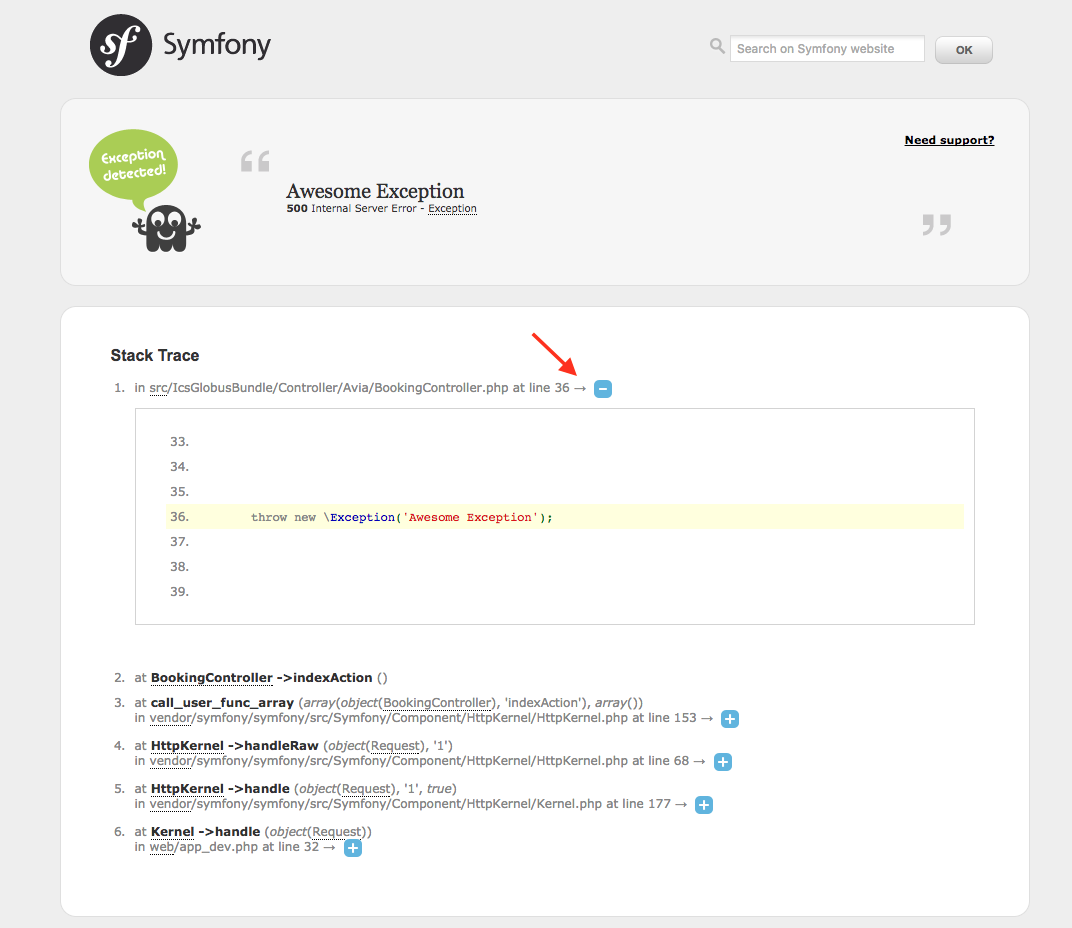
In the trace.html.twig file, we find the place where the string is displayed and add an arrow to the end, clicking on which will open the file in the IDE.
in {{ trace.file|format_file(trace.line) }} <a href="#" onclick="_goToEditorCodeLine('{{ trace.file }}', '{{ trace.line }}'); return false;">→</a> After that, an arrow appears in the stack trace line, clicking on which opens the file in the IDE and moves the cursor to the desired position.
The final version of the two files for symfony 3 can be viewed here .
Integration with command line in iTerm2
If you work on MacOS and use iTerm2, you can integrate iTerm2 and Command Line Launcher of the corresponding IDE, which will allow you to open files in the IDE directly from the terminal.
To install a launcher, you need to call the Tool → Create Command-line Launcher... menu in the IDE and in the dialog box confirm the path where the launcher will be installed. In my case, this is /usr/local/bin/phpstorm (or /usr/local/bin/pstorm for earlier versions) for IntelliJ IDEA is /usr/local/bin/idea .
This launcher allows, when called from the command line, to open a file and go to the desired line in it.
Call example:
/usr/local/bin/phpstorm --line 40 /path/to/file
or
/usr/local/bin/phpstorm /path/to/file:40
In both cases, the file /path/to/file will be opened on line 40.
Now we will do the command line launcher and iTerm2 integration. Go to Edit Session → Advanced.
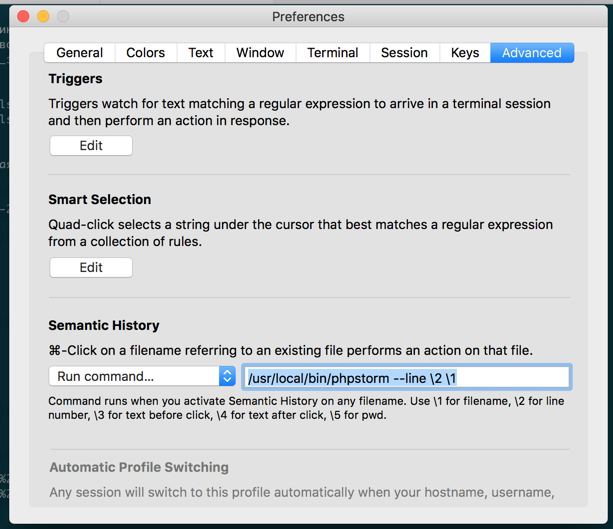
In the Semantic History section, from the drop-down list, select the run command... and enter:
/usr/local/bin/phpstorm --line \2 \1
Now, if you click Cmd and hover the cursor on any file in the terminal, it will become a link and click on it to open it in the IDE.
If your logs are /path/to/file/:40 , i.e. line number is indicated after the colon after the file - then the IDE will open the file directly on this line.
The problem with the php-exception logs is that the output is /path/to/file/(40) , i.e. the line in the file is in brackets. As a result, the file is opened, but does not go to the desired line.
To solve this problem, you can convert the log output to the format we need using the stream editor sed.
sed -E 's/#([0-9]+) (.+\.php)\(([0-9]+)\):/#\1 \2:\3/g'
Example of tail output processing
tail test.log | sed -E 's/#([0-9]+) (.+\.php)\(([0-9]+)\):/#\1 \2:\3/g'
In conclusion, I would like to emphasize once again that this scheme works with almost any language and any IDE from JetBrains.
')
Source: https://habr.com/ru/post/315690/
All Articles