Image Quantization
Quantization - reducing the color of the image ( wiki ). Of course, now very few people need it, but the task itself is interesting.
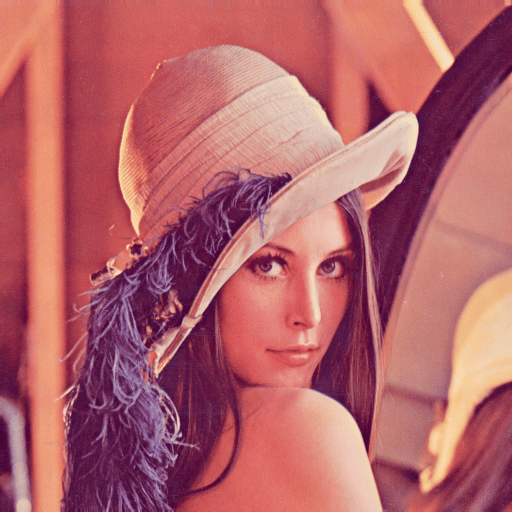
Quantized Lena draws attention
For example, the good old GIF format uses a palette of up to 256 colors. If you want to save a series of your selfies as gif-animation (who would need it), then the first thing that you, or rather the program that you will use for this, will have to do is create a palette. You can use a static palette, such as web-safe colors , the quantization algorithm is very simple and fast, but the result will be “not very”. You can create an optimal palette based on the colors of the image, which will give the result most visually similar to the original.
')
There are several algorithms for creating an optimal palette; each has its own pros and cons. I will not bother the reader with tedious theory and formulas, firstly I’m lazy, secondly most aren’t interested - the article is just flipped through, looking at the pictures.
Next you willfind a boring and incomprehensible narration about the method of the median section, the Floyd-Steinberg error-dissipation algorithm (noise quantization) (and not only), the features of the color perception of the human eye, as well as a little shit code.
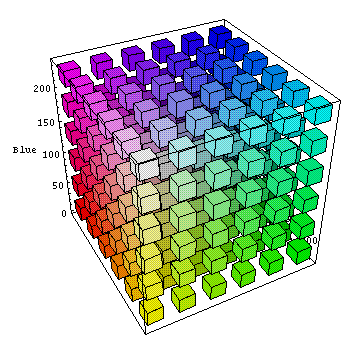
So - the method of median section. He is simple to ugliness. The first step is to make an RGB cube from all the unique colors of the image. Next, cut it along the longest side. For example, we have a red range from 7 to 231 (length 231-7 = 224), green from 32 to 170 (length 170-32 = 138), blue from 12 to 250 (length 250-12 = 238), then we will "Cut" the cube on the blue side. The resulting segments also cut along the long side, etc. until we get 256 segments. For each segment, calculate the average color - so we get a palette.
What can be improved here? The first thing that comes to mind is to calculate the average color without stupidly adding all the colors and dividing them by the amount [sum (color) / count (color)], and taking into account how many times each color is found in the image. That is, we multiply each color by the number of its occurrences in the image, we add the obtained values, divide the result by the number of occurrences in the image of all the colors of this segment [sum (color * total) / sum (total)]. As a result, the most common colors take precedence in the calculation, but rare colors make their own adjustments, so the palette is better, the visual deviation of colors is smaller. For best results, it is desirable to take into account the gamma, but I left it for later. The second is not so obvious - the median section does not take into account the peculiarities of color perception by the human eye at all. We perceive shades of green much better than shades of blue. I decided to correct this misunderstanding and “flattened” the cube - I multiplied the lengths of the sides by the coefficients from this article . As a result, the green and red sides of the sections became larger, the blue one less. I have never seen such a solution anywhere (I may have been looking badly), but the result is obvious.
Now we have an optimal palette, not ideal of course (I know that it can be further improved), but quite good. The next step is to index the colors of the image. The easiest option - in which segment is the color, such and index. Quick and easy. But there is one thing, and not even one, so we’ll go back to this step.
There is another way to improve the quality of the resulting image - the dispersion of errors. Here, too, everything is quite simple - from the indexed color we subtract the corresponding color of the palette, we get an error, we dissipate it by neighboring pixels in accordance with a certain formula (template), the most famous formula of Floyd-Steinberg, I used it. When errors are scattered, sharp transitions between colors are blurred, and visually it seems that the image contains more shades (colors). If it is interesting - you can read about error dissipation in detail and interestingly here . I also decided to finish this algorithm by multiplying the error with all the same coefficients, as it turned out, it was a very good idea - as there were fewer sections across the blue range, it produced a significant error, and without correcting the error, the dispersion coefficients made a lot of noise ".
Now you can go back to indexing. By scattering errors, we change the colors of the pixels and get those that are not in our RGB-cube (remember, it is composed solely of the colors of the image). Now you can not just see which segment is the color to assign an index. The solution was found immediately - search for the nearest color in the palette . In this formula, I substituted all the same factors. Comparing the results of matching the color of the palette by the index of the segment which includes the original color and the search results for the nearest color, I clearly saw that the closest color often appears in the neighboring segment. If the source color is closer to the center of the segment, then the segment index corresponds to the color index in the palette, but the closer the source color is to the edges of the segment, the more likely it is that the closest color will be in the adjacent segment. In general, the only correct way to index - search for the nearest color in the palette. But the search has a minus - it is slow, very slow. Writing a pyramid on a python is a bad idea.
Well, I wanted to explain in two words, but I got a whole bunch of incomprehensible writing. I hope I write the code better than I explain, so here is a reference on github . The code was rewritten several times, the algorithm was first refined, until I was satisfied with the result, then it turned out that it was eating too many operatives when processing photos (first tested on small pictures), I had to transfer the RGB cube, median section and pixel map to the database ( sqlite). The script works very slowly, but the result is better than quantization using PIL / Pillow and GIMP (this operation is called indexing).
PS: there is a wonderful program Color Quantizer , which copes with this task better and faster, so my script has no practical sense, it is made solely from the "sports" interest.
UPD: updated the project on github . Added Octree (octree) quantization algorithm, popular error dispersion formulas, search for the nearest color by the average red value.

Quantized Lena draws attention
For example, the good old GIF format uses a palette of up to 256 colors. If you want to save a series of your selfies as gif-animation (who would need it), then the first thing that you, or rather the program that you will use for this, will have to do is create a palette. You can use a static palette, such as web-safe colors , the quantization algorithm is very simple and fast, but the result will be “not very”. You can create an optimal palette based on the colors of the image, which will give the result most visually similar to the original.
')
There are several algorithms for creating an optimal palette; each has its own pros and cons. I will not bother the reader with tedious theory and formulas, firstly I’m lazy, secondly most aren’t interested - the article is just flipped through, looking at the pictures.
Next you will
Prehistory
Once upon a time, when Nokia was warm and lamp dominated the smartphone market, and the owners of smartphones proudly called themselves “smartphones”, in those ancient times I wrote simple python programs for series60. One of them the other day stumbled upon digging in the archives. GifTool - a program for creating gif-animations from a set of images. In it, I implemented quantization using the median section method, the LZW compression algorithm, the entire file structure was created independently, for the pixels that did not change on the next slide, transparency was used to reduce the final file size. I wanted to refresh my memory, to see how it worked. Opened the code and ... This feeling, when you can not figure out your govnokode ten years ago. I did not know about PEP8 then, so the readability of the code was a little less than none (then I liked minimalism, like many novice programmers). I shed tears, spat, refactored into PyCharm, figured out how to implement the method of the median section, quickly put in a “dirty” script. Works! The palette is created, the image at the output is tolerable. And then I ate - if I could achieve better results, so that the picture was visually as close as possible to the original.
So - the method of median section. He is simple to ugliness. The first step is to make an RGB cube from all the unique colors of the image. Next, cut it along the longest side. For example, we have a red range from 7 to 231 (length 231-7 = 224), green from 32 to 170 (length 170-32 = 138), blue from 12 to 250 (length 250-12 = 238), then we will "Cut" the cube on the blue side. The resulting segments also cut along the long side, etc. until we get 256 segments. For each segment, calculate the average color - so we get a palette.
A couple of pictures almost in the subject, for clarity


What can be improved here? The first thing that comes to mind is to calculate the average color without stupidly adding all the colors and dividing them by the amount [sum (color) / count (color)], and taking into account how many times each color is found in the image. That is, we multiply each color by the number of its occurrences in the image, we add the obtained values, divide the result by the number of occurrences in the image of all the colors of this segment [sum (color * total) / sum (total)]. As a result, the most common colors take precedence in the calculation, but rare colors make their own adjustments, so the palette is better, the visual deviation of colors is smaller. For best results, it is desirable to take into account the gamma, but I left it for later. The second is not so obvious - the median section does not take into account the peculiarities of color perception by the human eye at all. We perceive shades of green much better than shades of blue. I decided to correct this misunderstanding and “flattened” the cube - I multiplied the lengths of the sides by the coefficients from this article . As a result, the green and red sides of the sections became larger, the blue one less. I have never seen such a solution anywhere (I may have been looking badly), but the result is obvious.
Now we have an optimal palette, not ideal of course (I know that it can be further improved), but quite good. The next step is to index the colors of the image. The easiest option - in which segment is the color, such and index. Quick and easy. But there is one thing, and not even one, so we’ll go back to this step.
There is another way to improve the quality of the resulting image - the dispersion of errors. Here, too, everything is quite simple - from the indexed color we subtract the corresponding color of the palette, we get an error, we dissipate it by neighboring pixels in accordance with a certain formula (template), the most famous formula of Floyd-Steinberg, I used it. When errors are scattered, sharp transitions between colors are blurred, and visually it seems that the image contains more shades (colors). If it is interesting - you can read about error dissipation in detail and interestingly here . I also decided to finish this algorithm by multiplying the error with all the same coefficients, as it turned out, it was a very good idea - as there were fewer sections across the blue range, it produced a significant error, and without correcting the error, the dispersion coefficients made a lot of noise ".
Now you can go back to indexing. By scattering errors, we change the colors of the pixels and get those that are not in our RGB-cube (remember, it is composed solely of the colors of the image). Now you can not just see which segment is the color to assign an index. The solution was found immediately - search for the nearest color in the palette . In this formula, I substituted all the same factors. Comparing the results of matching the color of the palette by the index of the segment which includes the original color and the search results for the nearest color, I clearly saw that the closest color often appears in the neighboring segment. If the source color is closer to the center of the segment, then the segment index corresponds to the color index in the palette, but the closer the source color is to the edges of the segment, the more likely it is that the closest color will be in the adjacent segment. In general, the only correct way to index - search for the nearest color in the palette. But the search has a minus - it is slow, very slow. Writing a pyramid on a python is a bad idea.
Well, I wanted to explain in two words, but I got a whole bunch of incomprehensible writing. I hope I write the code better than I explain, so here is a reference on github . The code was rewritten several times, the algorithm was first refined, until I was satisfied with the result, then it turned out that it was eating too many operatives when processing photos (first tested on small pictures), I had to transfer the RGB cube, median section and pixel map to the database ( sqlite). The script works very slowly, but the result is better than quantization using PIL / Pillow and GIMP (this operation is called indexing).
Visual demonstration:
Original
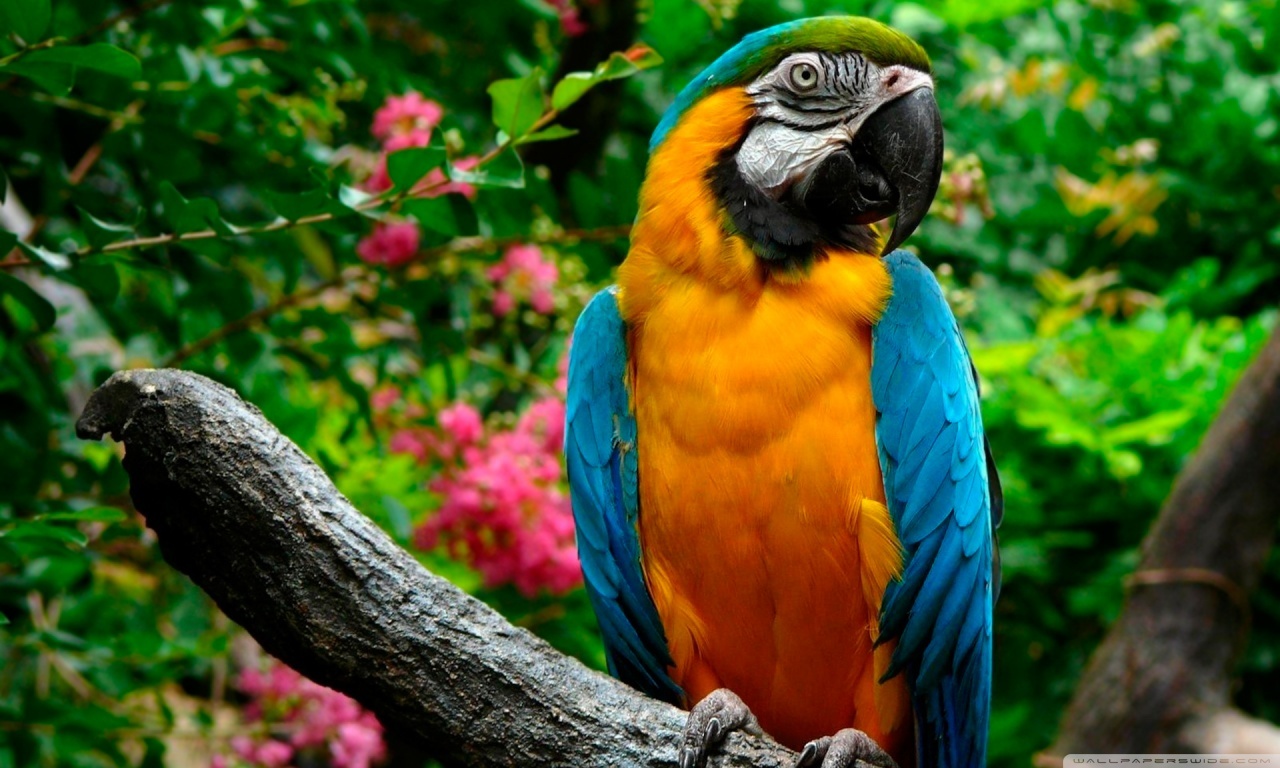
The result of quantization in GIMP, the optimal palette of 256 colors + color blurring according to Floyd-Stenberg (normal)
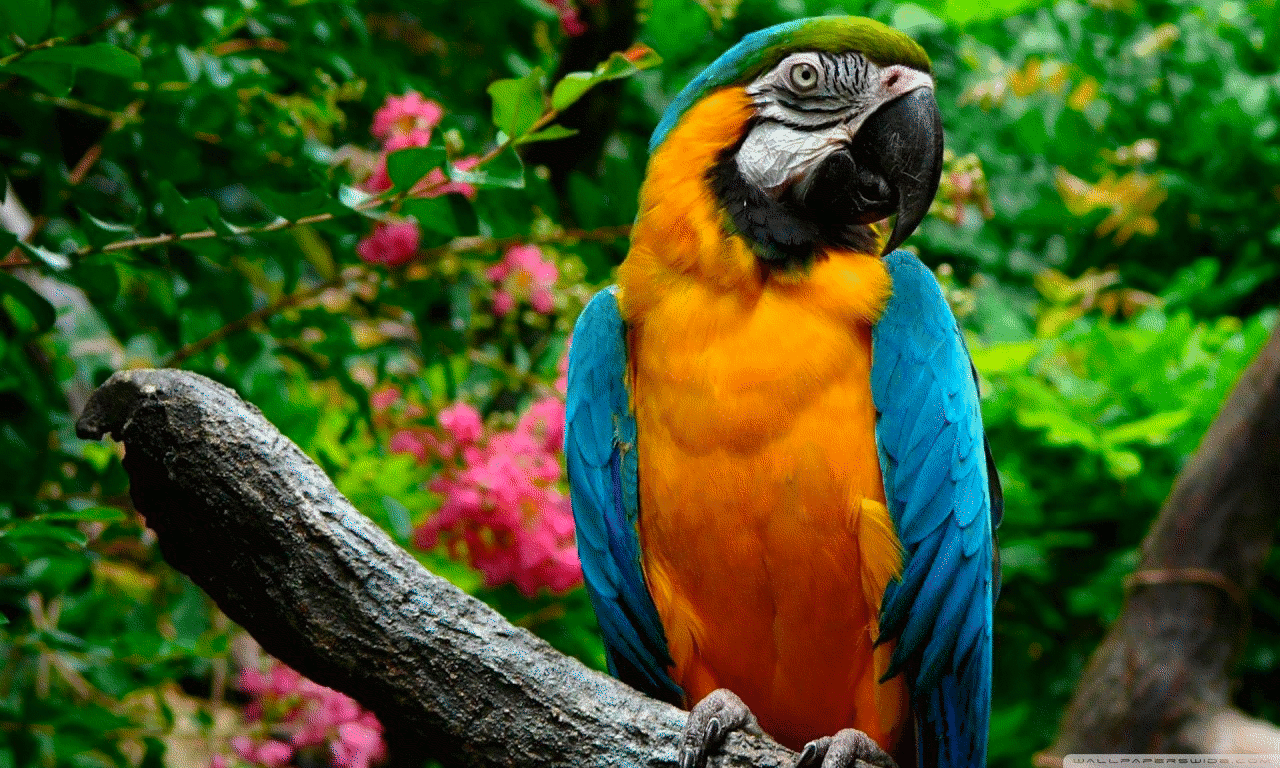
PIL / Pillow quantization result
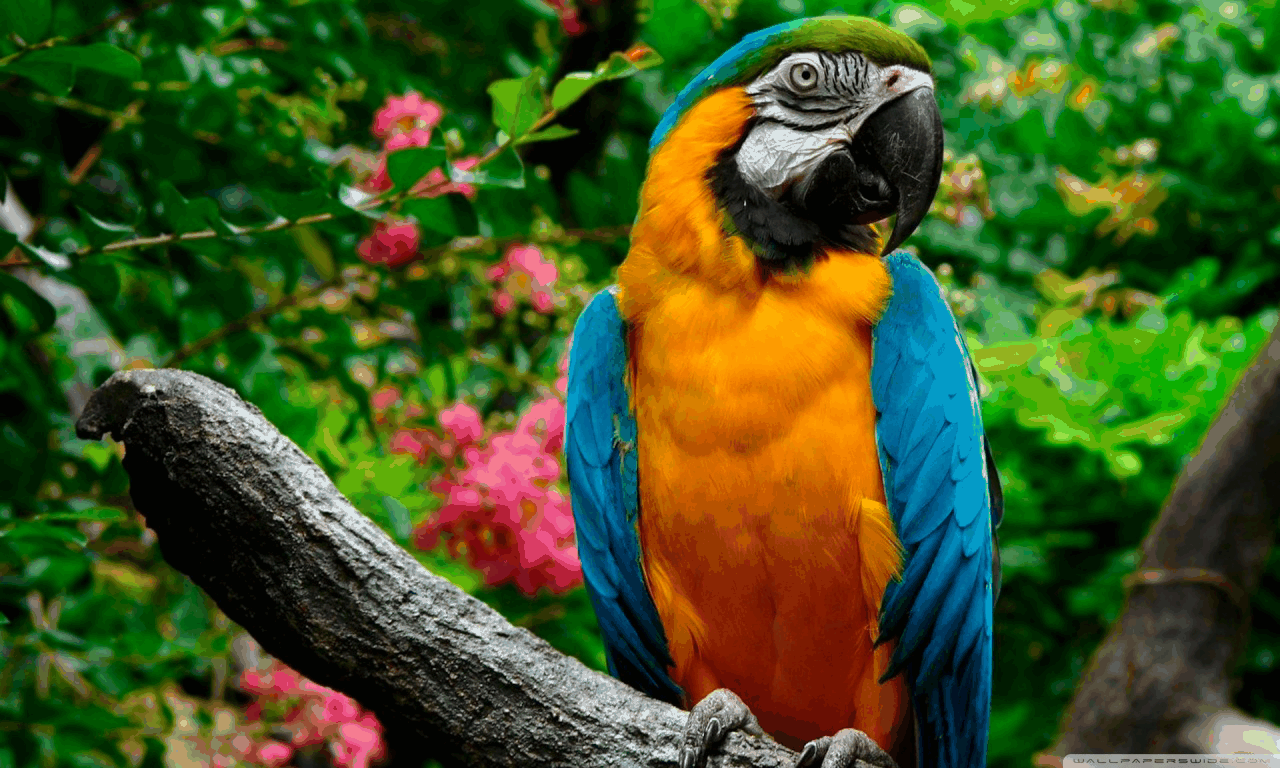
Quantization result by my code
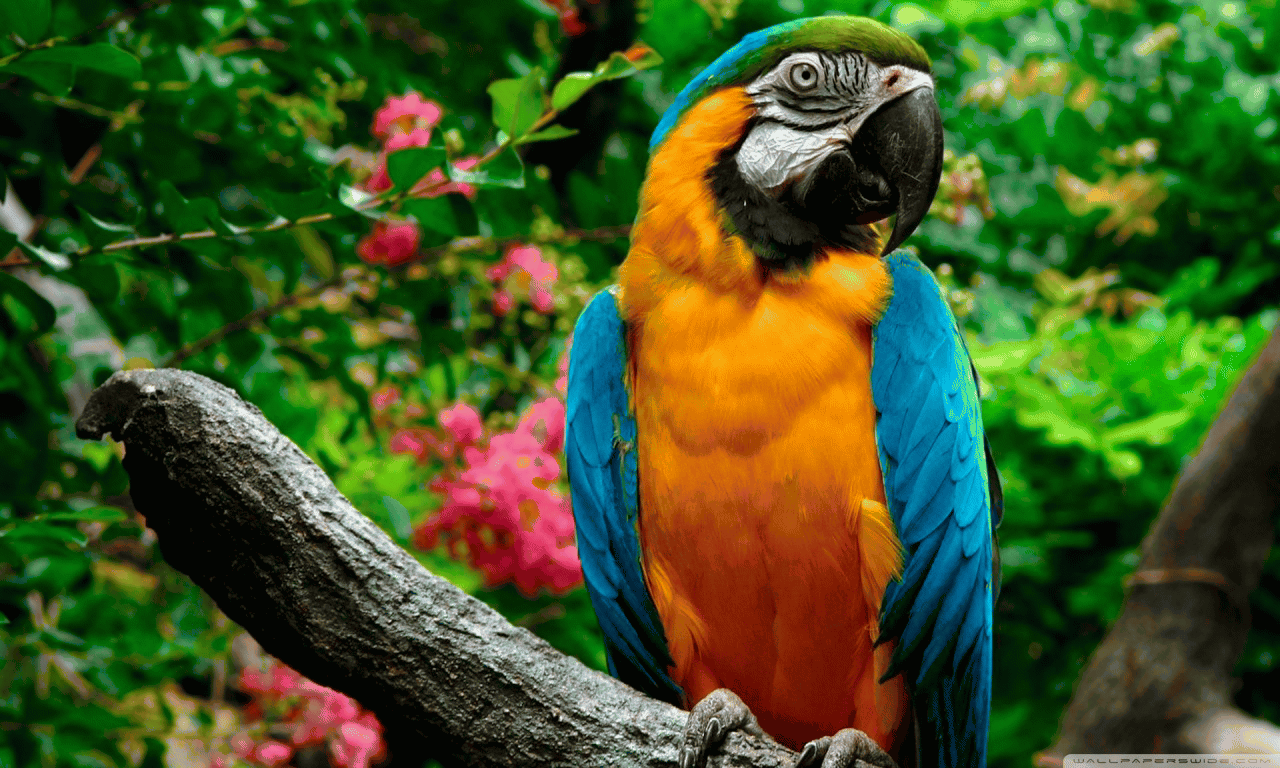
What to look for: dispersing an error in GIMP makes a lot of noise, PIL / Pillow creates a not very optimal palette and practically does not dispel errors (sharp transitions between colors).
If you don’t see the difference, check out other examples on github .

The result of quantization in GIMP, the optimal palette of 256 colors + color blurring according to Floyd-Stenberg (normal)

PIL / Pillow quantization result
image.convert(mode='P', dither=PIL.Image.FLOYDSTEINBERG, palette=PIL.Image.ADAPTIVE, colors=256) 
Quantization result by my code

What to look for: dispersing an error in GIMP makes a lot of noise, PIL / Pillow creates a not very optimal palette and practically does not dispel errors (sharp transitions between colors).
If you don’t see the difference, check out other examples on github .
PS: there is a wonderful program Color Quantizer , which copes with this task better and faster, so my script has no practical sense, it is made solely from the "sports" interest.
UPD: updated the project on github . Added Octree (octree) quantization algorithm, popular error dispersion formulas, search for the nearest color by the average red value.
Source: https://habr.com/ru/post/315490/
All Articles