We control the quality of the code using the SonarQube platform

In this article, we will look at the main features of SonarQube, a platform for continuous analysis and measurement of code quality, and also discuss the merits of a code quality assessment methodology based on SonarQube metrics.
Introduction
Our company is developing a PVS-Studio static code analyzer. We are convinced that choosing the appropriate development methodology and following it, applying proven techniques and tools significantly increases the likelihood that the code will be written correctly and the final product will meet the required quality standards. One of these methodologies is the use of static source code analysis. Static analysis, used in conjunction with other code metrics, makes it possible to assess the current state of the code base, the dynamics of this state, and possible risks during project implementation.
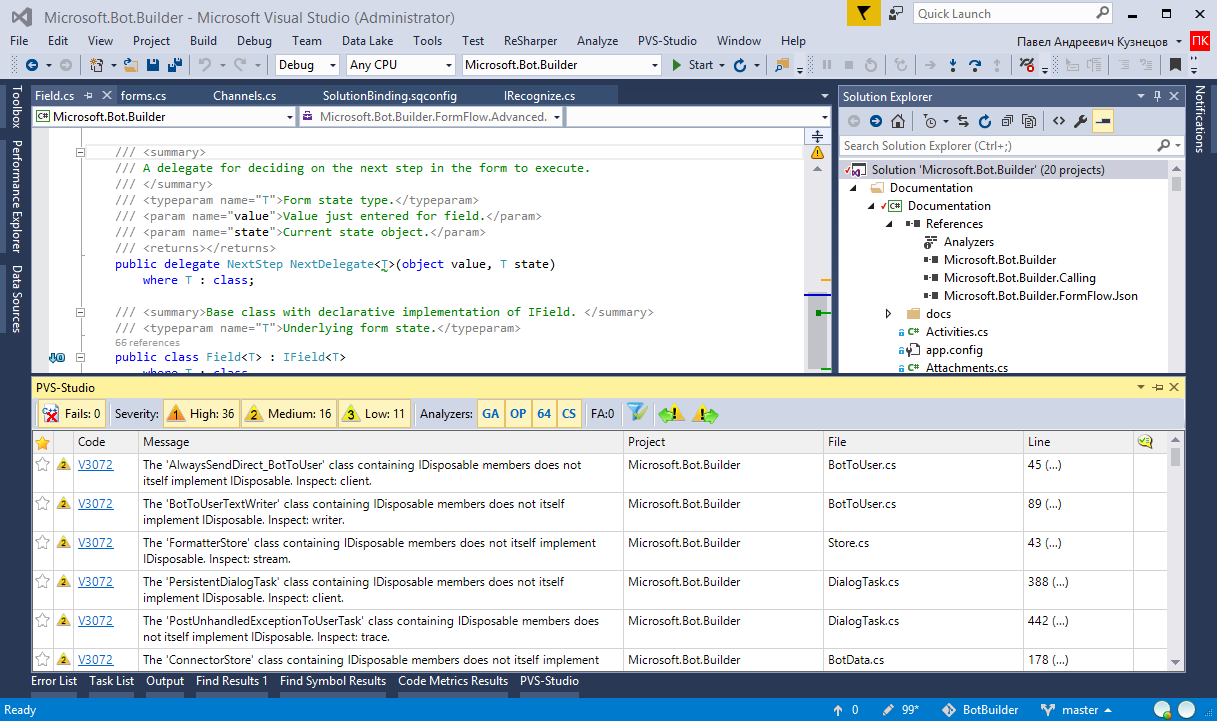
To begin, I will briefly tell you about the presentation of the analysis results of PVS-Studio. The results of the work of our static analyzer PVS-Studio are saved in the xml format. The list of error messages can be opened directly in the Microsoft Visual Studio window or in a separate Standalone utility, and you can work with these errors using the code navigation, sorting, filtering, suppressing false positives, etc.
The list of errors found in the xml format can be converted to one of the readable formats, for example, html. Such reports with the results of the analysis can be sent to all interested project participants by mail. Another way of notifying project participants is sending error lists to developers who have made them. For this, users can use special utilities supplied in the PVS-Studio distribution kit.
')
Speaking about the capabilities of PVS-Studio, we should mention the functionality for the mass suppression of diagnostic messages . If static analysis was implemented in the later stages of the application's life cycle, when the size of the code base has reached a large size, code inspection can lead to the detection of a large number of errors. Perhaps at this point in time, the team lacks the resources necessary to correct all errors. In this case, developers can hide all messages issued on the current revision of the code, and concentrate on errors found in newly written or modified code.
The dynamics of the number of errors found by PVS-Studio can be obtained using the Analysis Statistics functionality of the PVS-Studio plugin for Microsoft Visual Studio or the Standalone utility:

The listed methods of presenting the results of our static analyzer, however, exist by themselves and are not related to other code metrics, such as the number of lines of code, cyclomatic complexity, the number of errors per 1000 lines of code, the level of code coverage by unit tests, duplication, and so on. The report on the errors found after the next analysis and the number of these errors does not answer the questions: do we have a lot of errors or few? How is the dynamics of the number of errors associated with the growth of the code base? Is code quality improving or deteriorating? And, probably, the most important question of managers: when will everything work (how long will it take to eliminate errors)? These questions made us think about how to make PVS-Studio reports more valuable and informative.
Why is it useful to collect and monitor code metrics? It is impossible to improve what you do not measure. Suppose some team does not collect code metrics. With the development of the project, the code base may become worse and worse, and for a long time no one will even notice this until at some point the amount of technical debt reaches such a size that support and the addition of new functionality will cost more and more. If the team constantly monitored the code metrics, it would see the dynamics of the state of its project and, upon reaching certain threshold values, would start to sound the alarm.
Next, let's say the team realized the problem and convinced its manager that it was necessary to spend resources on improving the quality of the code. The manager, in turn, will ask the team a few simple questions: how long will it take for the team? What parts of the project need to be improved? How many bugs are you going to fix? By what criteria do you estimate that the quality of the code has reached the required level, and you can again return to the development of new functionality? Using metrics will answer all these questions. If before starting work on improving the quality of the code, the team will record the current state of the code for each component of the product and determine the threshold values for each metric, the achievement of which will allow you to state with a certain degree of confidence that the product code has become high-quality, you can predict the end date and stop when certain thresholds will be reached. For example, the team will be able to show the manager that after completing work on improving the quality of the code, the level of coverage with modular tests reached 90%, adherence to the coding standards adopted by the company reached 95%, and duplication of the code was reduced to 5%, etc.
Why SonarQube?
SonarQube is an open source platform designed for continuous analysis and measurement of code quality. SonarQube provides the following features:
- Support for Java, C, C ++, C #, Objective-C, Swift, PHP, JavaScript, Python, etc.
- Provides reports on code duplication, compliance with coding standards, code coverage with unit tests, possible code errors, code comment density, technical debt, and more.
- Saves the history of metrics and builds graphs of changes of these metrics over time.
- Provides fully automated analysis: integrates with Maven, Ant, Gradle and common continuous integration systems.
- Allows you to integrate with IDEs such as Visual Studio, IntelliJ IDEA and Eclipse using the SonarLint plugin.
- Provides integration with external tools: JIRA, Mantis, LDAP, Fortify, etc.
- You can extend existing functionality with third-party plug-ins.
- Implements the SQALE methodology for assessing technical debt.
An impressive list, right? You yourself can get acquainted with the capabilities of SonarQube and try it in action by clicking on the link https://sonarqube.com/ . SonarSource provides this service for analyzing open source projects, and if you have an open source project on GitHub, you can upload it to https://sonarqube.com/ and use SonarQube reports to control the quality of your project code.
We have carefully studied the capabilities of the SonarQube platform and decided that these capabilities may be of interest to our customers. Therefore, we have decided to develop a plugin for importing the results of the analysis of PVS-Studio.
At about the same time, one of our customers expressed interest in implementing a centralized repository of various code metrics. The client is developing a very large (more than 10 million lines of code) and long-term (more than 15 years of active development) project. Naturally, in such a project there is a lot of inherited code and associated skeletons in the closet, and in this case, in my opinion, it is absolutely necessary to develop and implement a set of metrics to evaluate the status of the project code and the dynamics of changes in this state over time. Naturally, our client made a decision on collecting and analyzing metrics long ago, and implemented various utilities for monitoring code quality indicators, such as: code coverage with modular tests, test run results, duplication of code blocks, adherence to accepted coding standards, code comment density, and so on .d In parallel with the collection of these metrics, static code analysis was performed daily. The use of a large number of utilities led to the complication of the configuration of the continuous integration server, writing additional scripts to convert the results of each utility into a convenient form for presenting and combining all the indicators into a single report. This approach required significant resources to create and support this reporting system.
Based on the needs of the client and our study of the capabilities of the SonarQube platform, we proposed to implement this platform. What was done. As part of the implementation task, a plug-in for SonarQube was implemented, which allows you to import the results of the PVS-Studio analysis into SonarQube. The process of SonarQube deployment and its integration with the existing environment (assembly system, continuous integration server, version control system) did not cause difficulties due to logical configuration mechanisms and a large number of detailed documentation. Widgets were set up to evaluate both the state of the client’s project portfolio as a whole and the state of each project individually; Quality Profiles and Quality Gates were set up (I’ll discuss SonarQube mechanisms below) according to the client’s needs, automatic assignment of tasks to performers, distribution of notifications to all interested parties.
As a result of the implementation of the SonarQube, the client received a centralized system for storing and displaying code metrics, which makes it possible to evaluate and predict project risks. The transition from individual tools to a centralized code quality control system not only simplifies the deployment and support of this system, but also allows you to make a qualitative leap in project management, providing all interested participants with tools for monitoring project status and making weighted decisions. After the test operation, the client decided to include SonarQube in the existing ALM (Application Lifecycle Management) toolkit.
It should be noted that SonarQube, thanks to its extensive integration with other tools, can easily become an integral part of your ALM framework. Using plug-ins in SonarQube, you can add support for Git, SVN, Mercurial, Team Foundation Version Control, ClearCase, configure authorization via LDAP, GitHub, Bitbucket, Azure Active Directory, import the results of third-party analyzers. SonarLint plug-ins for IntelliJ IDEA, Eclipse, and Visual Studio allow you to analyze the code in real time in your favorite IDE using the rules defined in the SonarQube profile. Integration with Team Foundation Server and Visual Studio Team Services is also available. You can run code analysis and data import into SonarQube directly from the build process on these systems, or, for example, manage build status in Team Foundation Server and Visual Studio Team Services using Quality Gates (build quality indicators), available in SonarQube: if the code does not meet the requirements of the Quality Gate, the build will be considered failed. Thus, SonarQube developers seek to make their product as open as possible and allow development teams to integrate SonarQube into their environment.
For which projects and teams is it advisable to implement SonarQube? I believe that for relatively short-term projects (no more than 2–3 months) in which small teams are engaged (no more than 5 people), investments in the implementation of SonarQube in the development process may not be justified. As a rule, such projects do not require large expenditures for product support. For such projects, I would recommend limiting it to separate tools for monitoring the status of a project code: a static analyzer, monitoring code coverage by tests, compliance with coding standards, etc., which the team is used to using.
On large projects that require significant resources, with a long life cycle, the introduction of the SonarQube platform into the development process is justified. Moreover, the introduction of SonarQube can benefit at any stage of the project development. The optimal strategy, in my opinion, is the implementation of the SonarQube in the early stages of the development cycle, which will allow the team to analyze the quality control reports from the very beginning and to be sure that the specified quality standards of the code are observed. Implementing the SonarQube at a later stage of development may potentially require a lot of money to improve the quality of the code. For example, it may turn out that static analysis revealed a large number of potential errors, there is a large amount of technical debt, the code is not covered by tests, public APIs are not documented, etc. Nevertheless, identifying product risks at any stage of the life cycle allows us to correctly respond to these risks and plan actions to minimize them.
For example, a team can agree that if a piece of code is changed as part of the development of new functionality, all technical debt in this code will be eliminated. Investing in eliminating the deficiencies found will further reduce the cost of product support and the development of new functionality. Also, if the product has been on the market for a long time, and, despite the fact that the code quality inspection revealed a large number of problems, the behavior in the production environment is quite stable and there are not enough resources at the current time to improve the quality of the code base, you can postpone this investment. SonarQube provides an opportunity to focus on problems that have appeared in the new code. This functionality is similar to the mass message suppression functionality in PVS-Studio.
How SonarQube helps evaluate code quality
The SonarQube quality model is based on the implementation of the SQALE (Software Quality Assessment based on Lifecycle Expectations) methodology with certain additions. As is known, the SQALE methodology focuses mainly on the complexity of code maintenance (maintainability) and does not take into account the risks of a project. For example, if today a critical safety problem was discovered in a project, strict adherence to the SQALE methodology obliges you to eliminate all existing problems with reliability (reliability), possibility of changes (changeability), testability, etc., and only then return to the new critical issue. In fact, if potential problems have existed in the code for a long time and do not manifest themselves in the form of user bug reports, it is much more important to focus on fixing new bugs.
With this in mind, the SonarQube developers modified the quality model based on SQALE to highlight the following important points:
- The quality model should be as easy to use as possible.
- Bugs and vulnerabilities should not be lost among maintainability issues
- The presence of serious bugs and vulnerabilities in the project should lead to the fact that the Quality Gate requirements are not met
- Code maintainability issues are important too and cannot be ignored.
- Calculating the cost of troubleshooting (using the SQALE analysis model) is important and should be performed.
The Standard Quality Gate SonarQube uses the following metric values to determine that the code passed the validation successfully:
- 0 new bugs
- 0 new vulnerabilities
- technical debt ratio on the new code <= 5%
- new code coverage not lower than 80%
The Sonar team identified the seven deadly sins of developers who increase technical debt:
- Bugs and potential bugs
- Breaking Coding Standards
- Code duplication
- Insufficient coverage with unit tests.
- Poor distribution of complexity
- Spaghetti design
- Not enough or too many comments.
The SonarQube platform is designed to help fight these seven sins.
Let us consider in more detail the main features of the SonarQube.
Home page
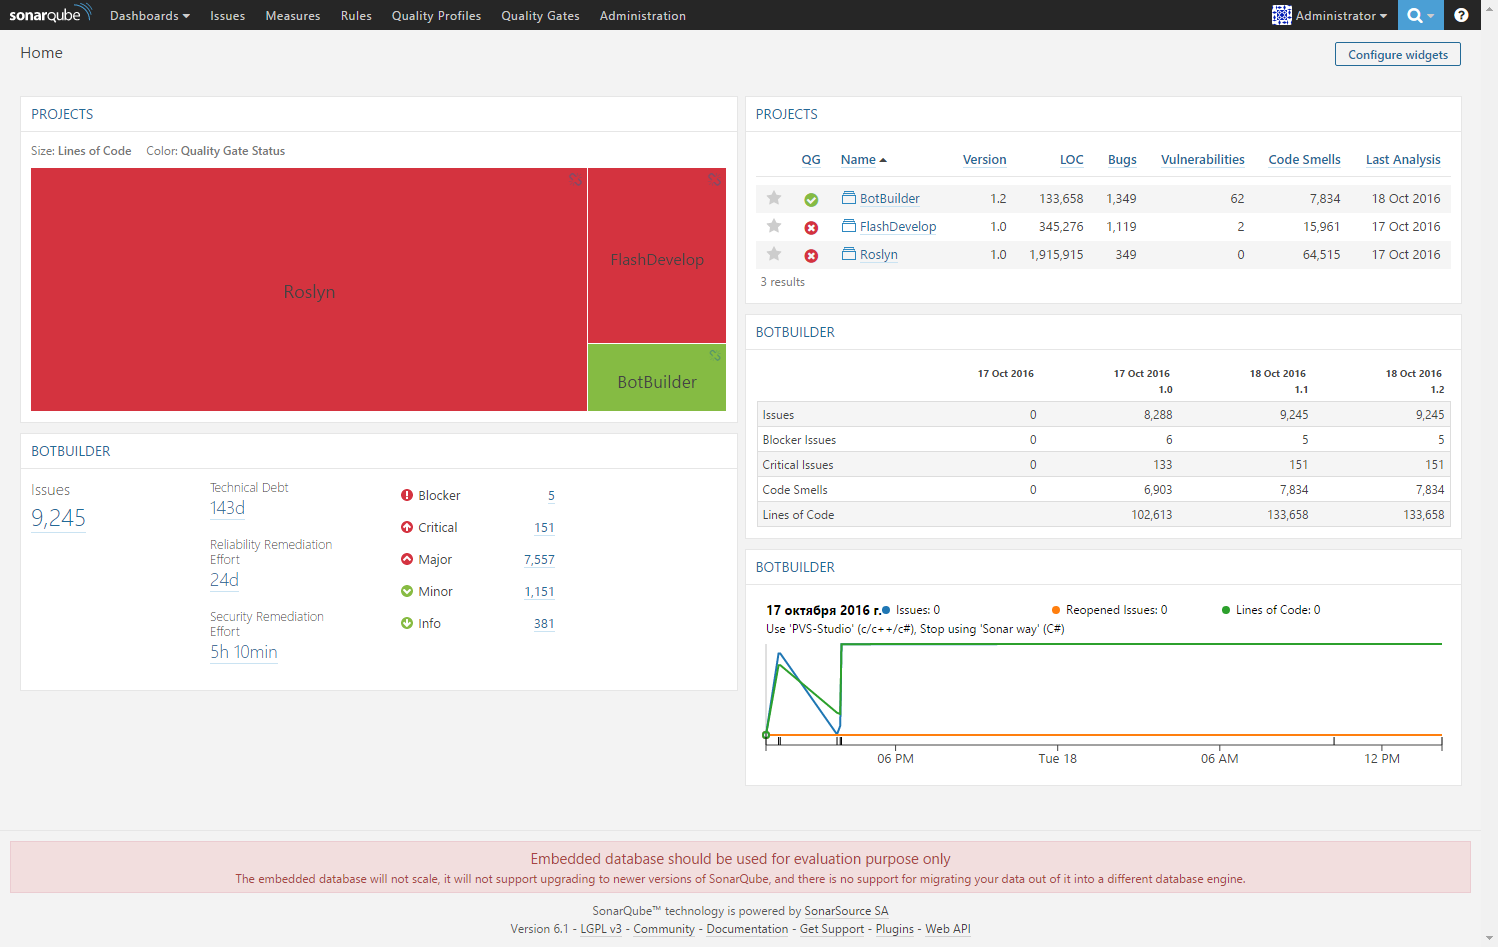
On the SonarQube main page, you can see a list of projects added to the system, with brief statistics on each project: build version, number of lines of code, number of bugs, vulnerabilities and signs of “tidy code”, last analysis date:
You can customize the contents of the main page to suit your goals with a large set of built-in widgets that allow you to visualize the status of the project code in SonarQube.
Project Metrics
For more detailed information on the project status, go to the project metrics page:
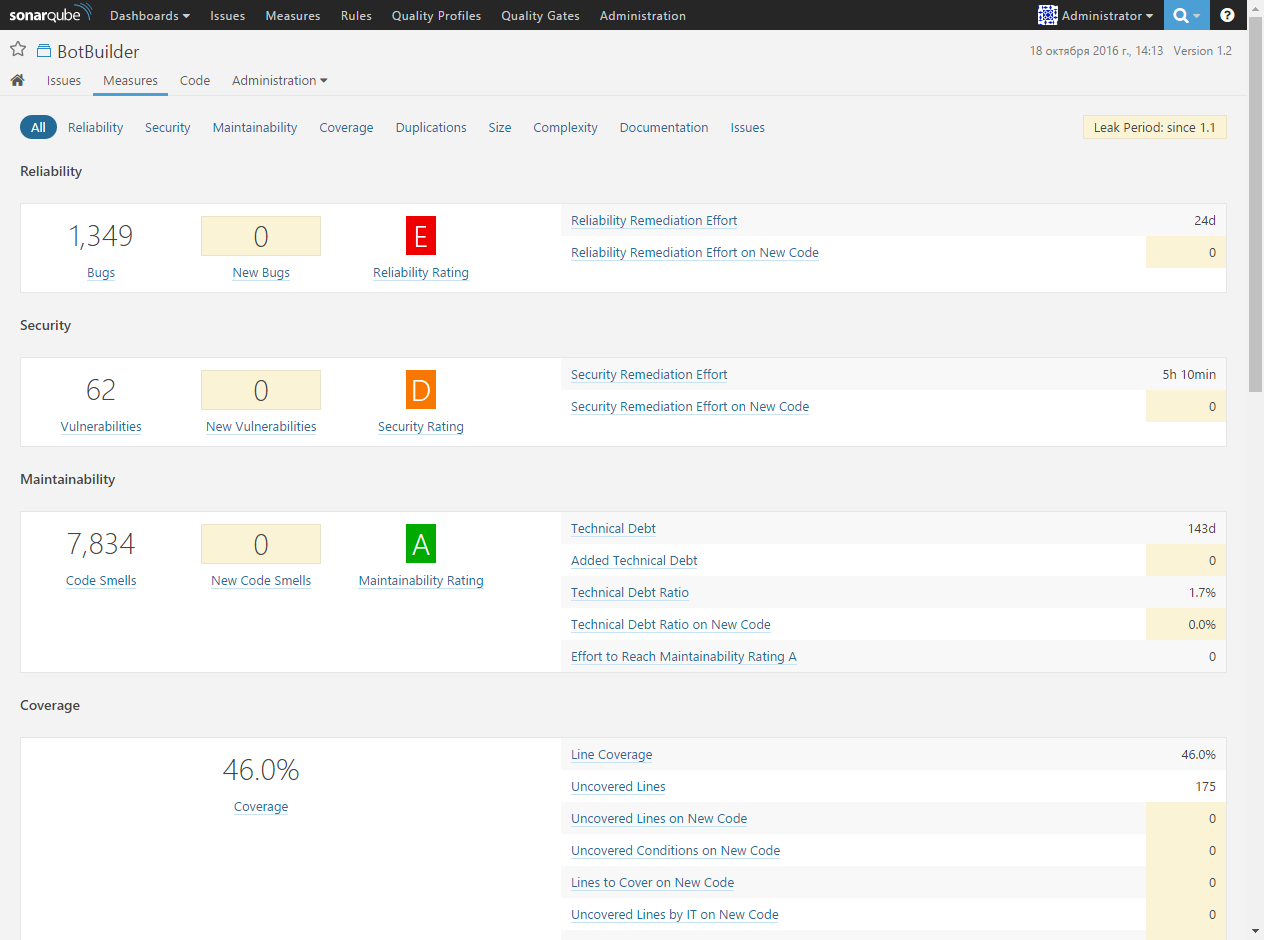
Information on the following code metrics is presented here: Reliability, Security, Maintainability, Coverage, Duplications, Size (code base size), Complexity, Documentation. code) and Issues.
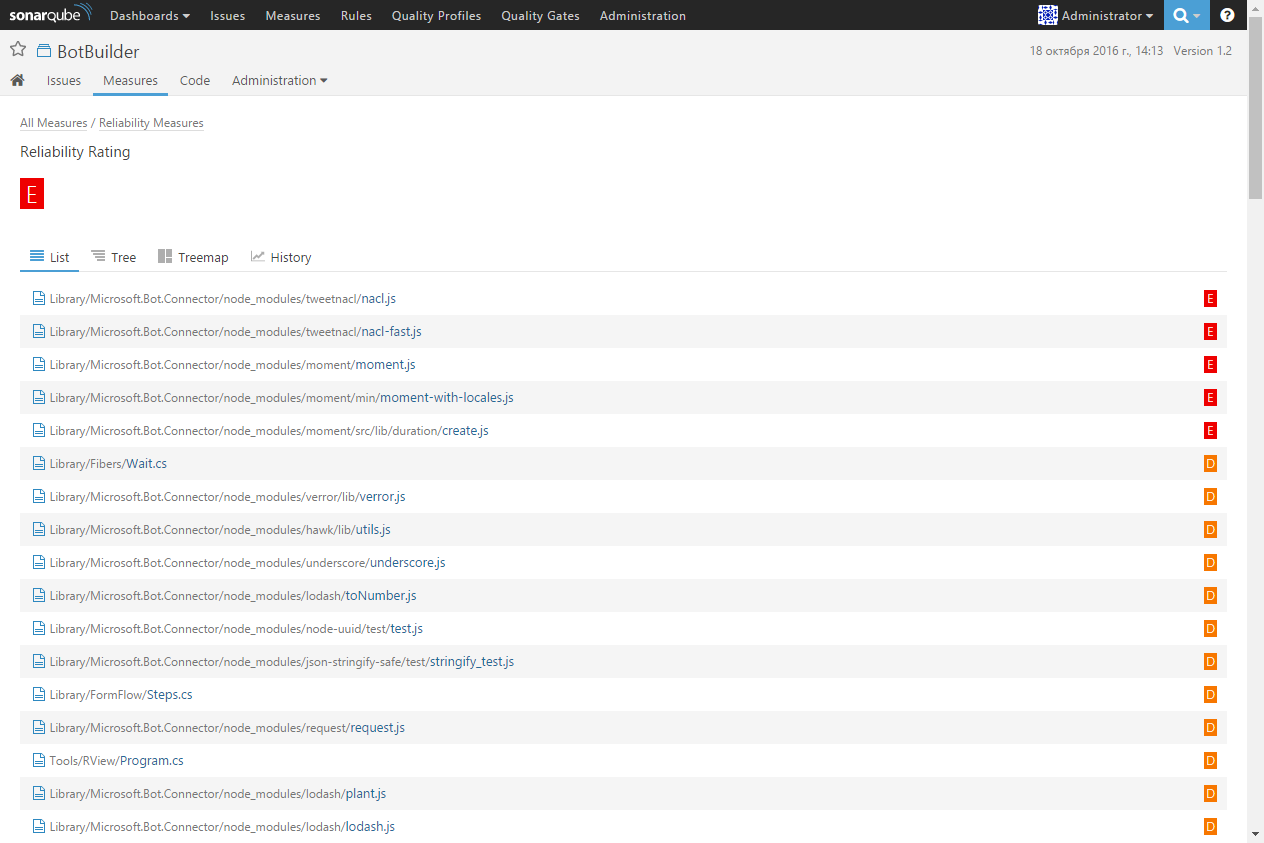
Turning to Reliability metric, we get information on the total number of detected bugs and new bugs found during the last analysis, the code reliability rating on a scale from A to E, where E is the worst rating, indicating that at least one was found Blocker bug, as well as the time required to eliminate all errors found:
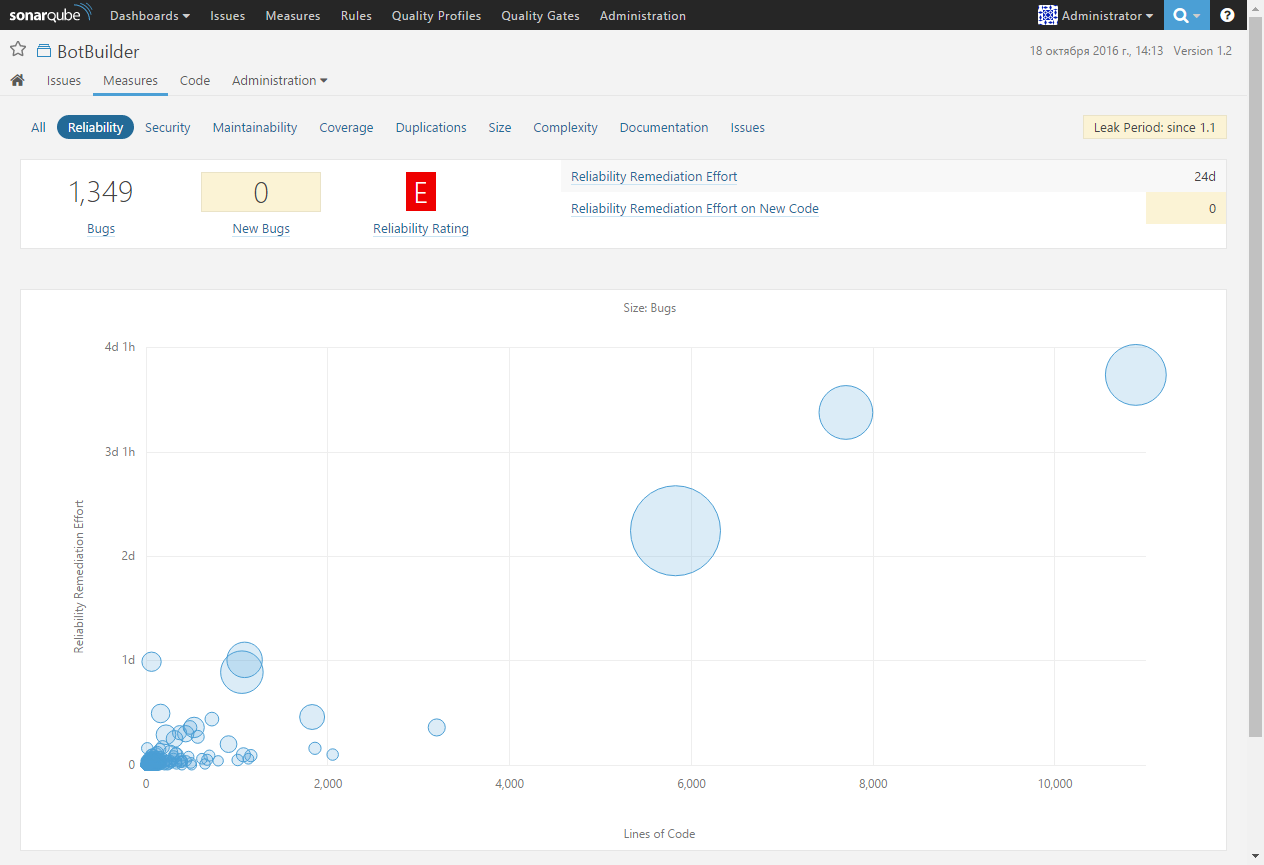
The SonarQube platform allows analyzing code metrics from top to bottom, from the project level as a whole to individual modules and files. So, for example, if you click on a reliability rating (Reliability Rating), you will see a list of project files, sorted by increase in reliability rating. This will allow focusing on the most problematic areas of the code:
Then you can go to the file with the source code and to specific parts of the code in which errors are found:

This top-down navigation is also available for other metrics.
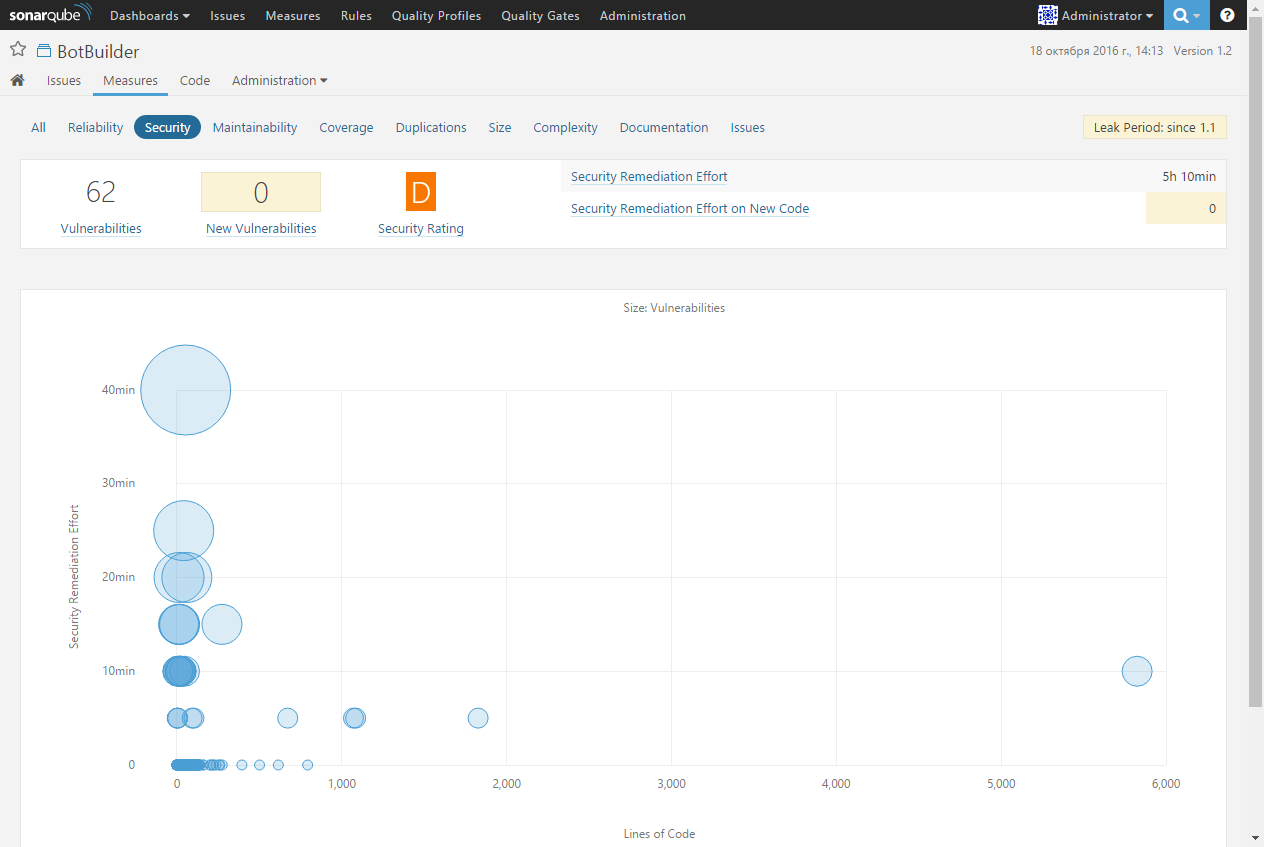
The Security metrics page provides information on the total number of vulnerabilities, new vulnerabilities, security rating (also on a scale from A to E), and the time it takes to fix vulnerabilities:
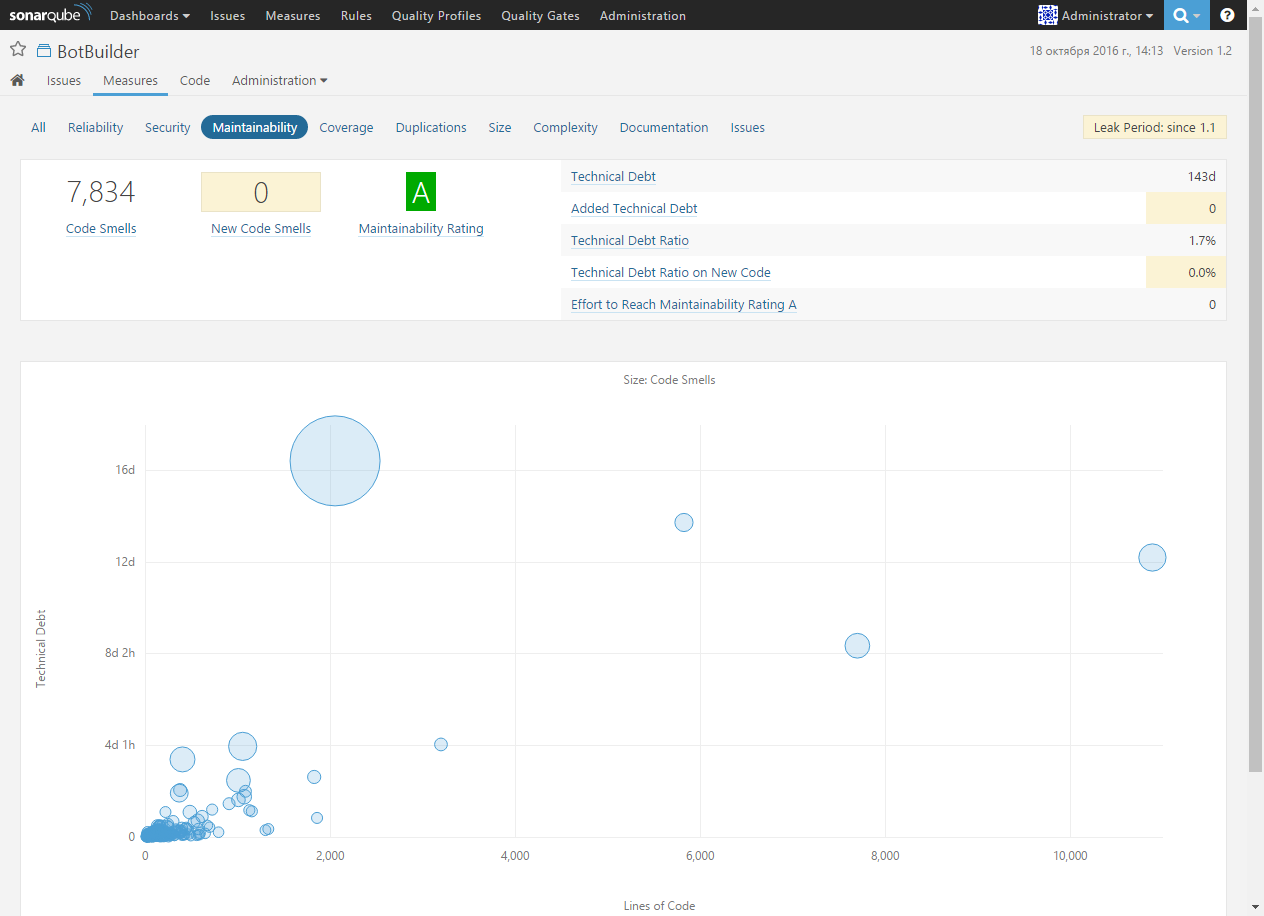
The Maintainability page contains information about the technical duty in the project:
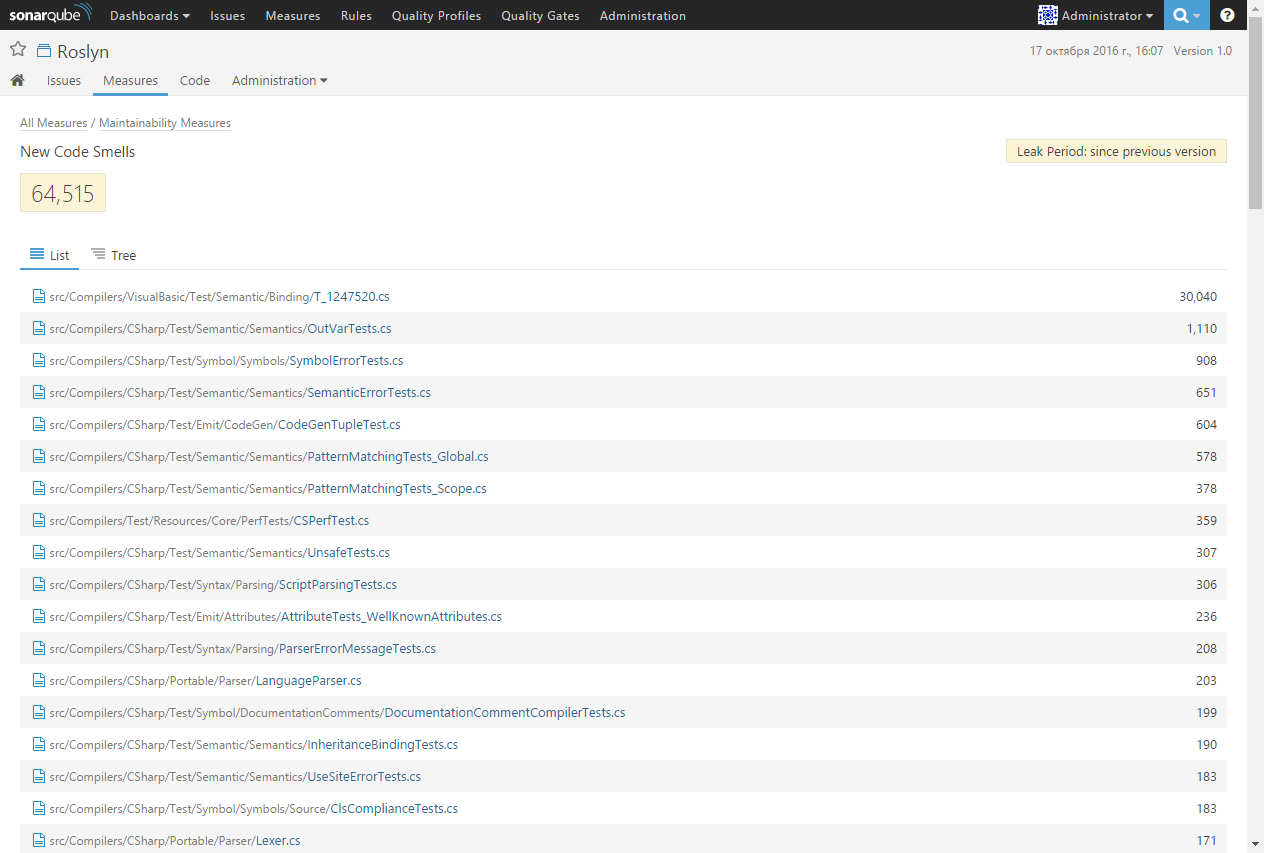
Thanks to the top-down navigation, you can go to the list of files sorted by the number of detections of a code with a nice one:
and then directly to the code that requires attention:
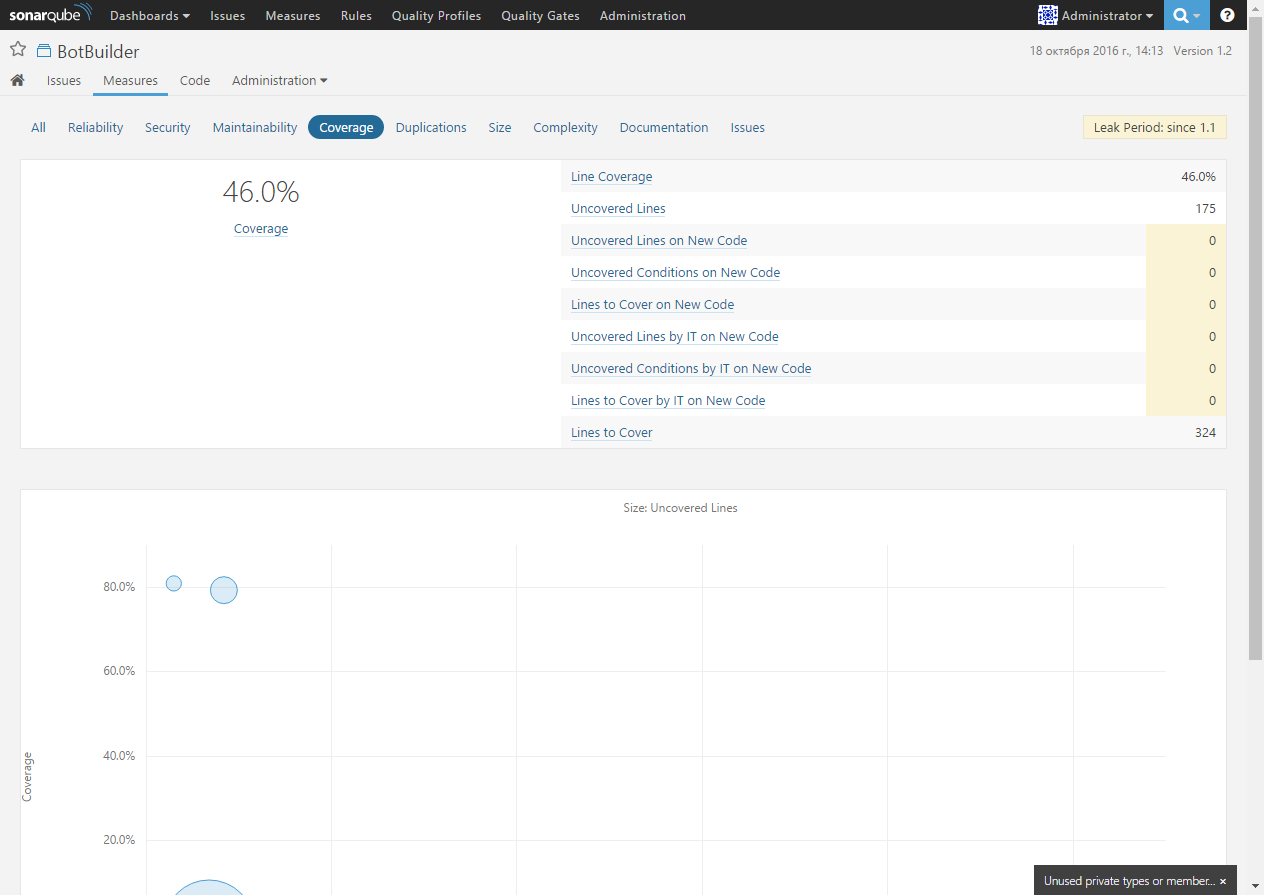
The Coverage page provides information on code coverage with tests:
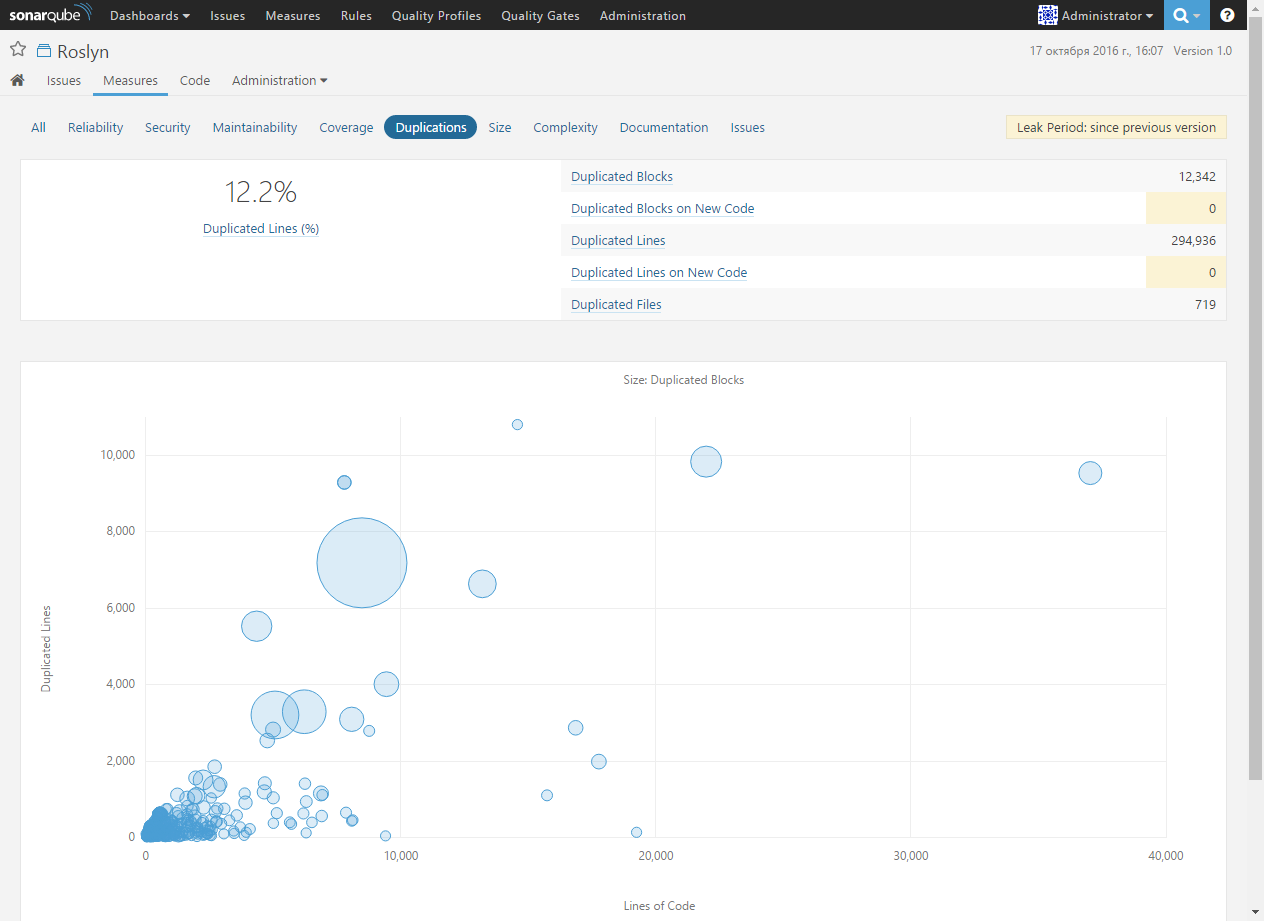
The Duplications page contains information about duplicating code in a project:
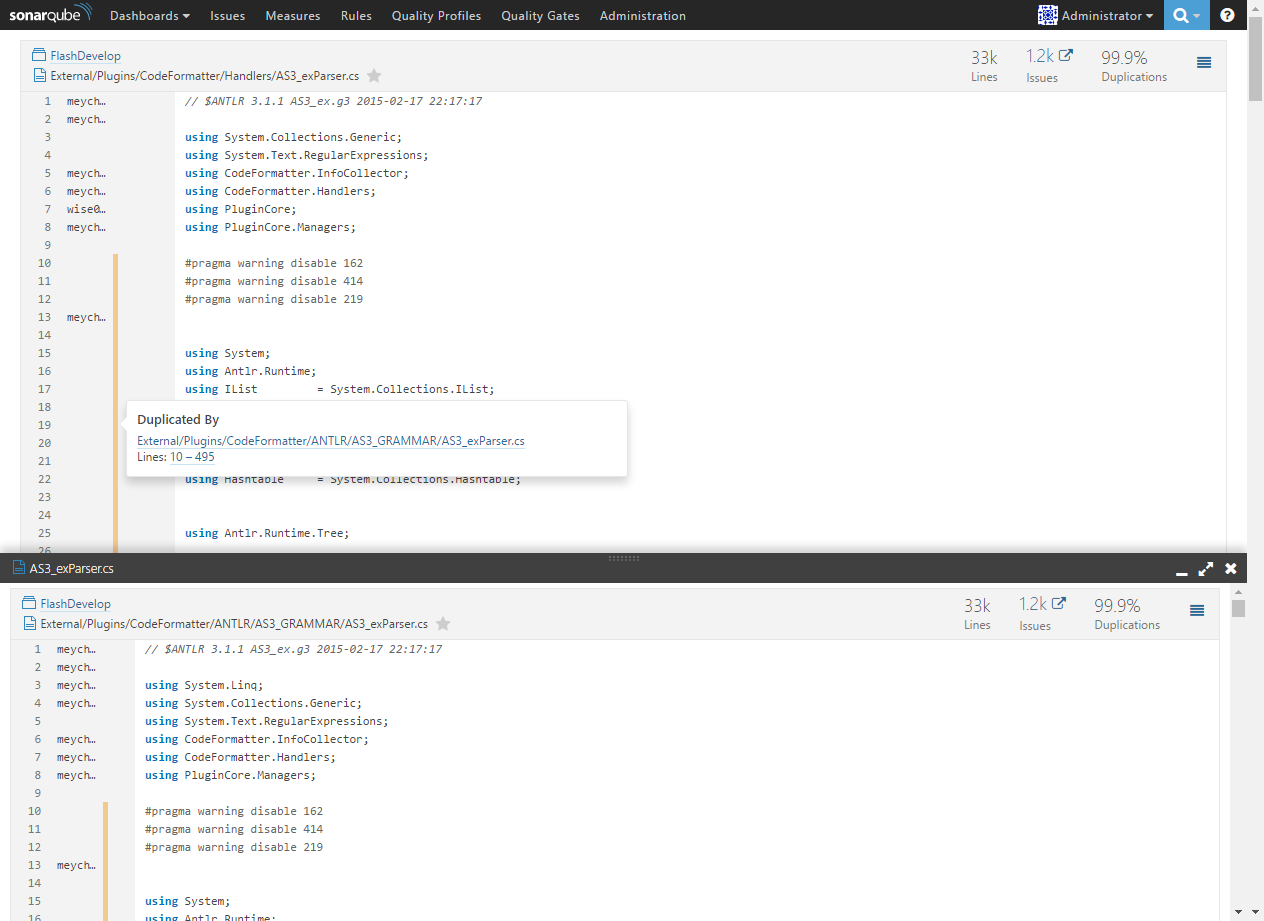
With this metric, you can easily find duplicate lines, blocks of code, and even entire files:
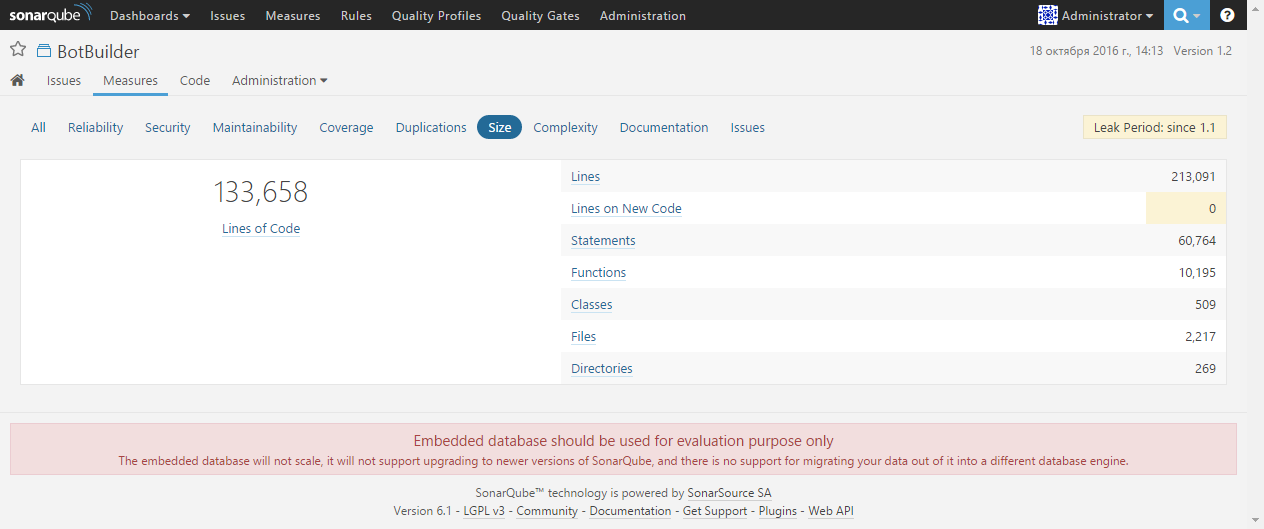
The Size page contains information about the size of the project: the number of lines of code, expressions, functions, classes, files and directories:
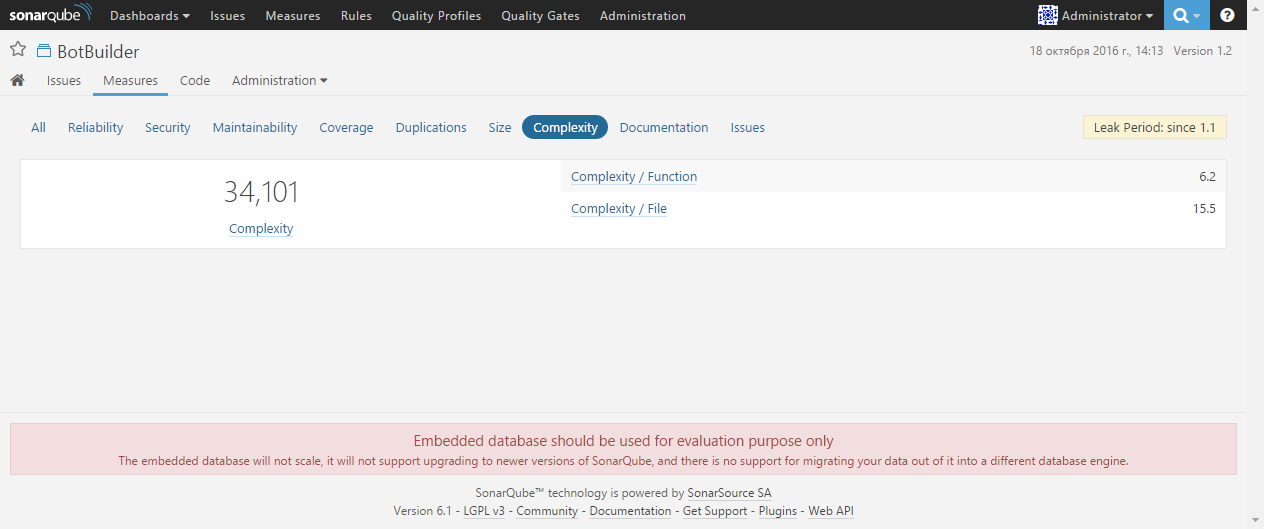
The Complexity page provides information on the total cyclomatic complexity of the project, as well as on the average complexity of functions and files:
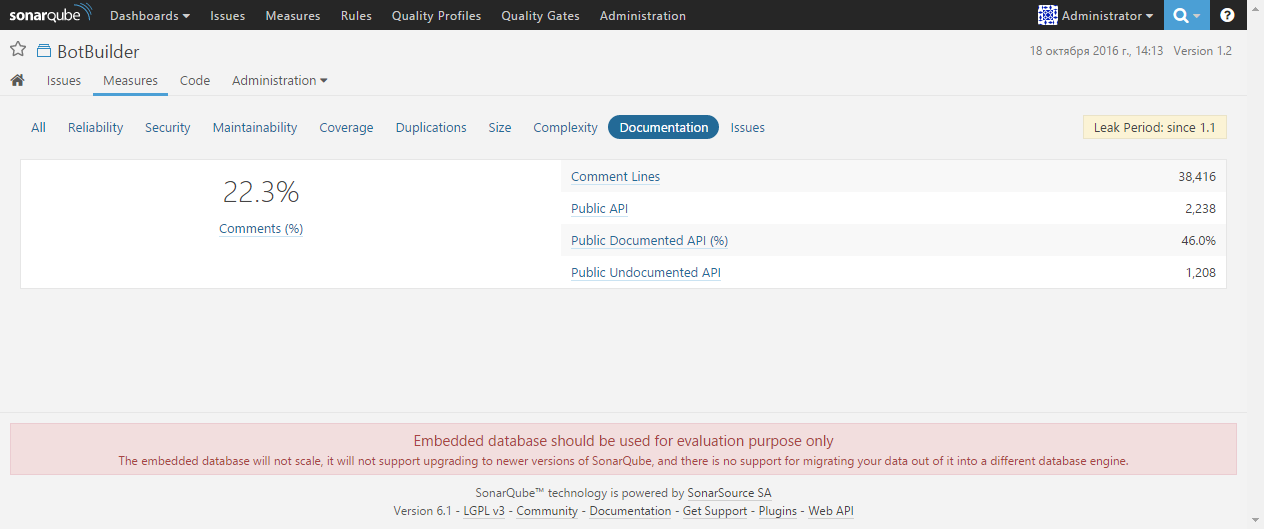
The Documentation page provides information about comments in the code: the ratio of lines with comments to the total number of lines in a project, the number of lines with comments, the number of public APIs and the level of documentation of public APIs:
The last tab in the project metrics section - Issues - contains the total number of problems found in the code (the sum of the number of bugs, vulnerabilities and code smells), as well as the distribution of problems according to the state: open, reopened, confirmed, false positives and won't fix:

Error and Code Navigation
After analyzing the code metrics, let's see how SonarQube allows you to work with the problems found in the code. To do this, go to the Issues section:
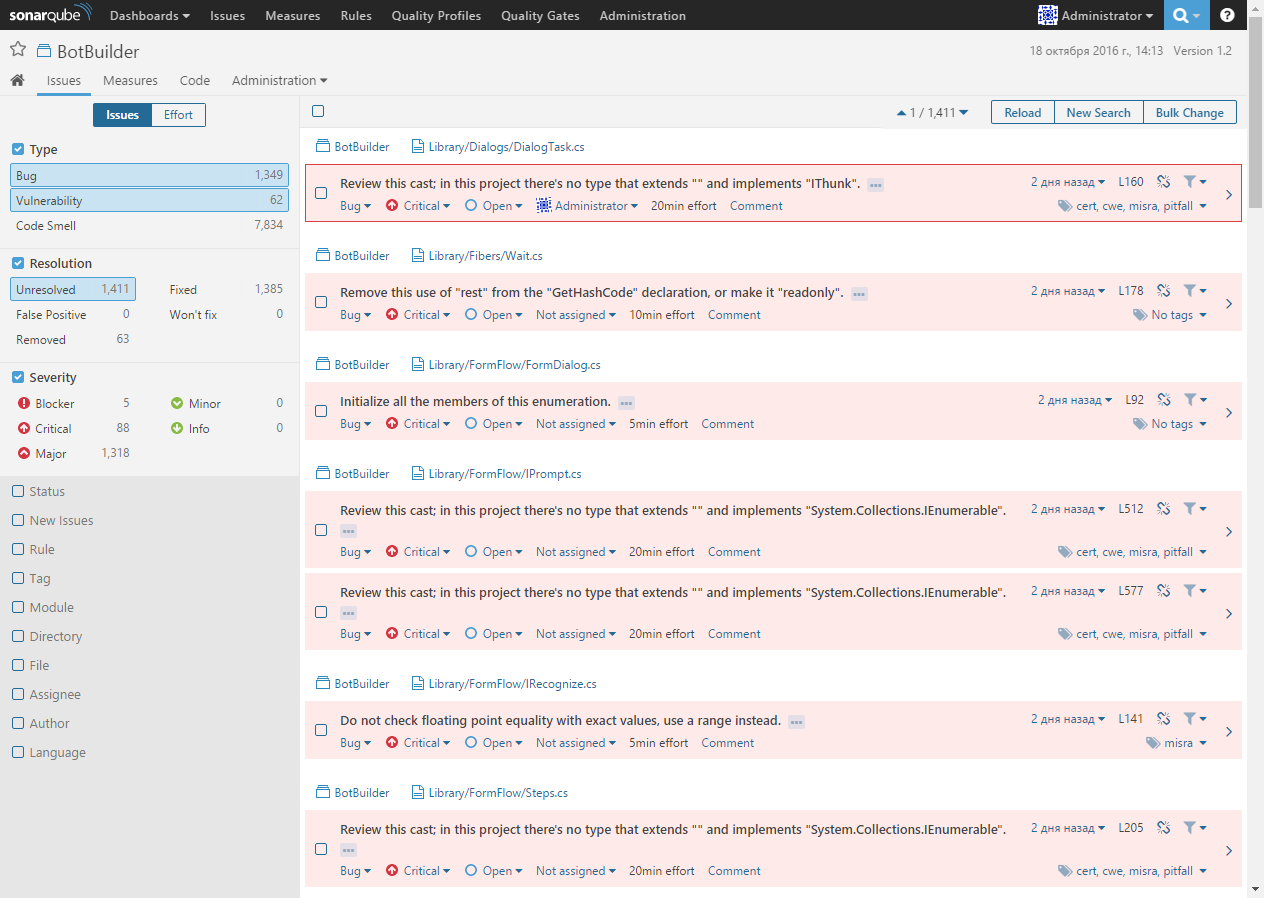
Here are all the problems found in the code with extensive filtering capabilities, which allows you to focus on the most important problems. It should be noted that SonarQube allows you to save filter settings to reuse them.
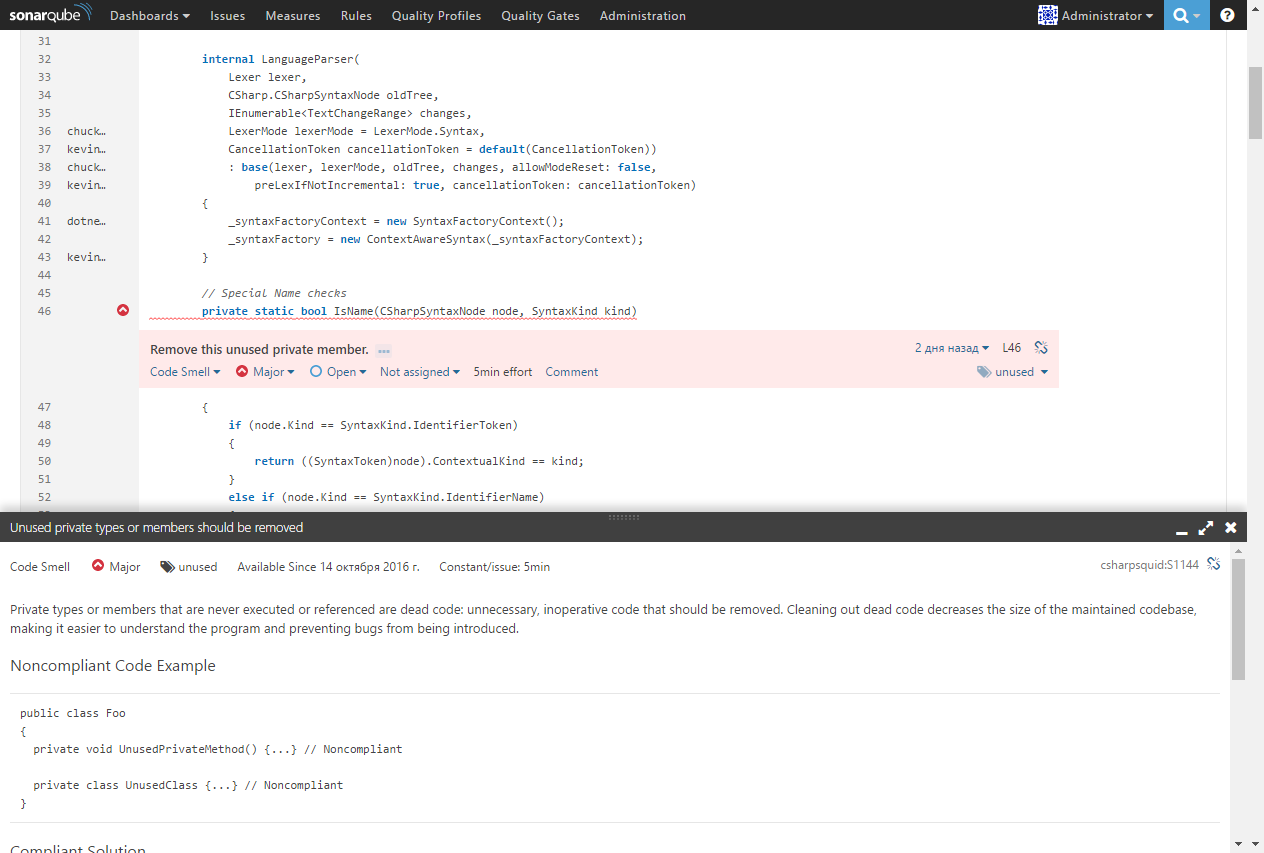
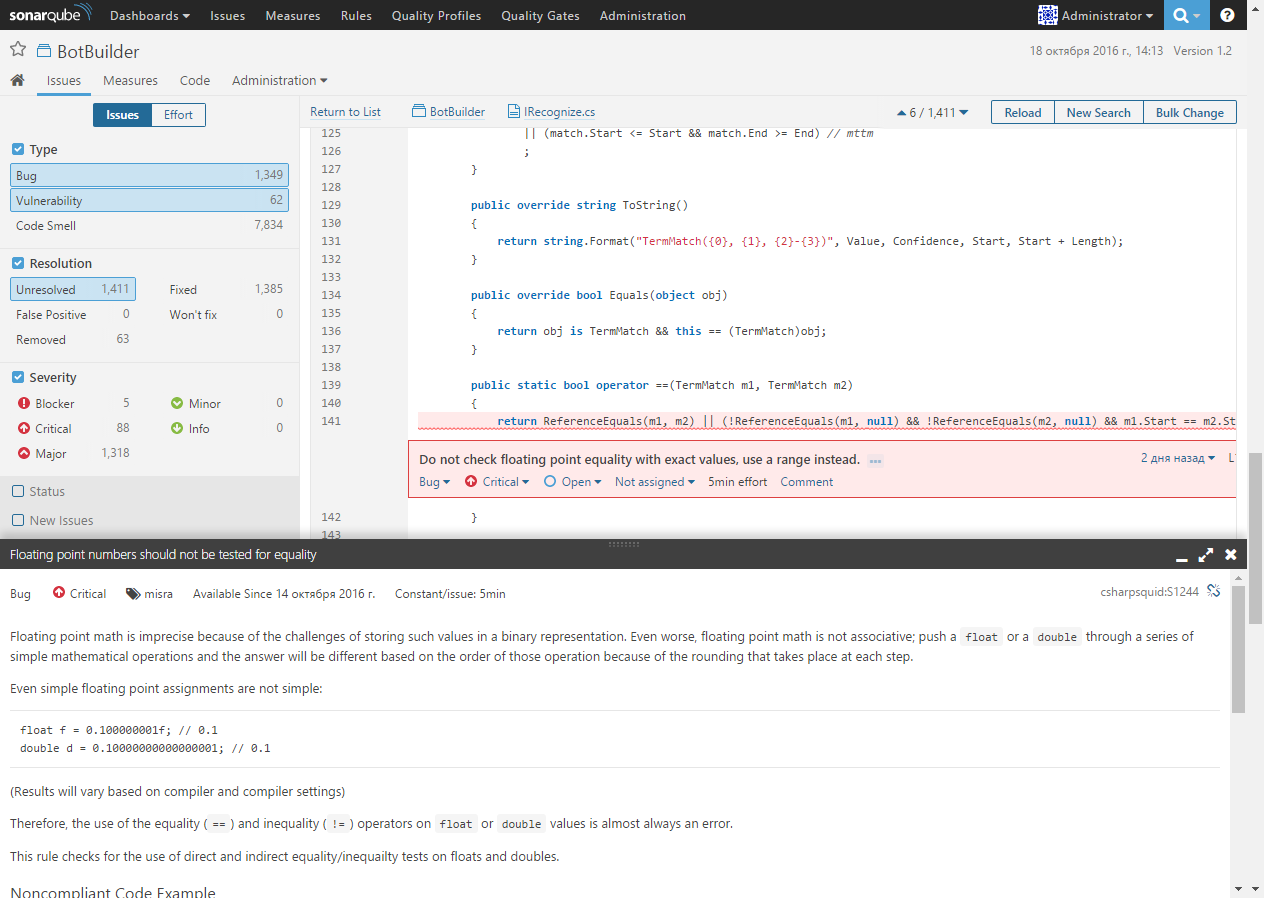
By double clicking on the error message, you can go to the code where the problem was found. Also available is a detailed description of the error and recommendations how to fix it:
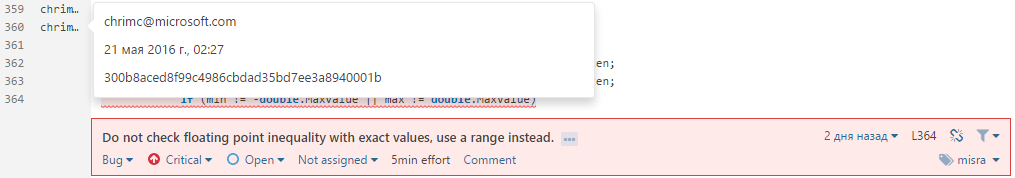
Please also note that, thanks to the integration with version control systems, you can see who and when made changes to the code that triggered the analyzer:
Integration with version control systems also allows you to automatically assign bugs in SonarQube to those developers who have allowed them. You can also assign bugs to developers manually, change their type (bug, vulnerability or code smell), importance, tags, add comments. For more convenience, the function of mass change of bugs is available:

Rules, Quality Profiles and Quality Gates
Diagnostic Rules (Rules), Quality Profiles (Quality Profiles) and Quality Limits (Quality Gates) are key understandings of the SonarQube platform. Each plug-in for SonarQube, which performs static code analysis, contains a repository with a description of the diagnostic rules that this plug-in executes. Violations of these rules are used to determine the technical duty in the code and calculate the time to troubleshoot problems. For ease of use, the rules are combined into quality profiles (Quality Profiles). By default, SonarQube creates a default quality profile for each supported language, but you can create your own quality profiles with a set of diagnostic rules that you may find useful. For example, to analyze critical projects whose code quality requirements are the most stringent, you can define a quality profile containing all available diagnostics, and for less critical projects you can define a less strict quality profile containing only serious errors, which will allow you not to be distracted by minor code. smells.
Quality Gate is an indicator of compliance (or inconsistency) of the project code with the specified threshold metrics. By default, all projects added to SonarQube use the standard quality gate, which defines the following metrics and their thresholds:
- New bugs = 0
- New vulnerabilities = 0
- Ratio of technical debt on the new code <= 5%
- Coverage of the new code> = 80%
Based on your own requirements for the quality of the source code, you can change the standard quality gate or create a new one by adding or removing those metrics and their threshold values that are of interest to you.
PVS-Studio and SonarQube
To import the analysis results to SonarQube, we have developed a sonar-pvs-studio-plugin plugin. Using the plug-in allows you to add messages found by the PVS-Studio analyzer to the message base of the SonarQube server. The plugin contains a repository with a description of the diagnostics that our static analyzer performs. After you add our plug-in to SonarQube, you will see a repository called PVS-Studio for C, C ++ and C # languages:

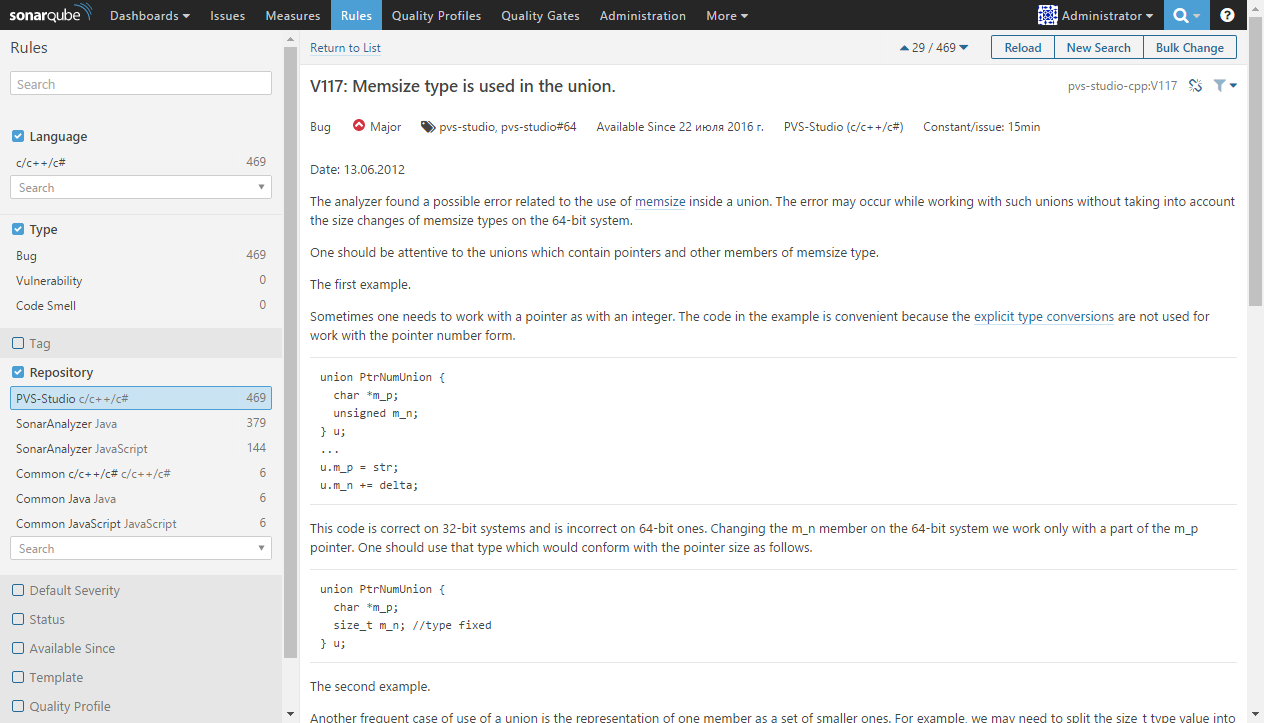
Diagnostic messages of PVS-Studio in the plugin repository are accompanied by detailed error descriptions with code examples and recommendations for resolving the problem:
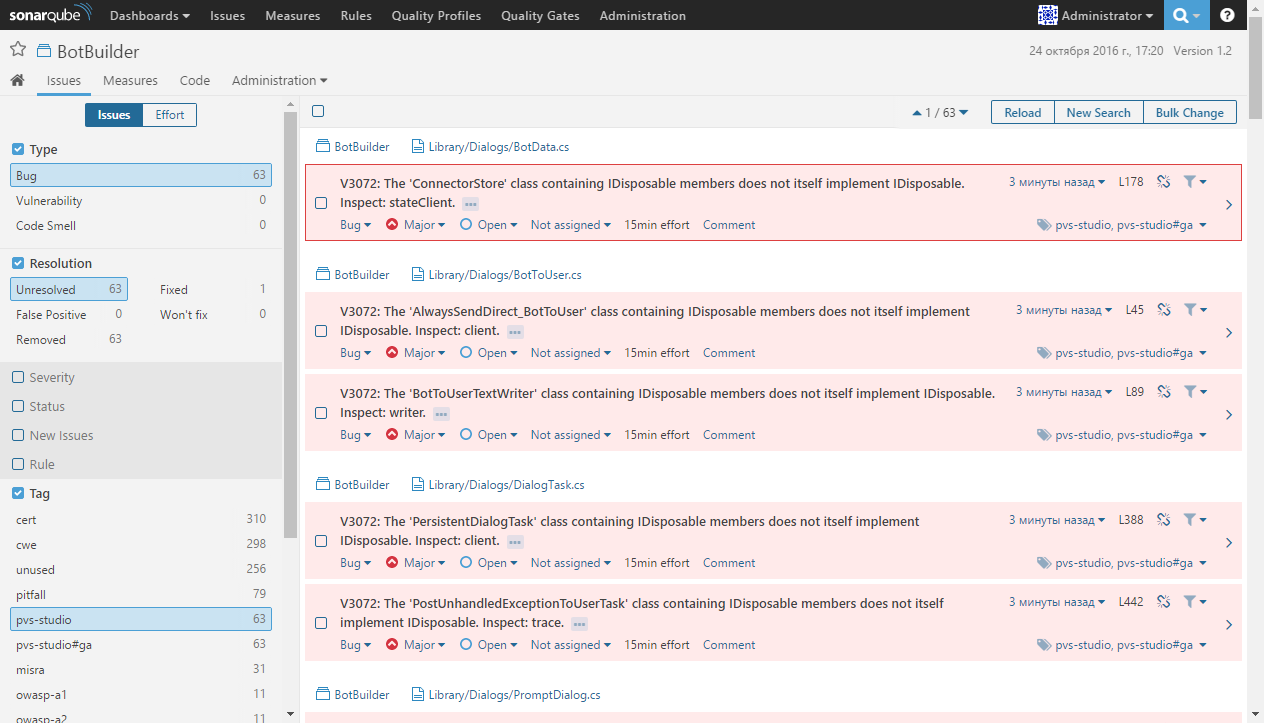
After static analysis of the project code and importing the results into SonarQube, using filters you can, for example, select all the unresolved problems found by PVS-Studio:
To add the PVS-Studio analysis results to SonarQube, just install the sonar-pvs-studio-plugin plugin, add the PVS-Studio diagnostics from the plugin's repository to the Quality Profile and pass the path to the PVS-Studio report file in the sonar.pvs-studio.reportPath property when you start the scanner SonarQube.
SonarQube developers recommend using SonarQube Scanner for MSBuild to analyze MSBuild projects. This scanner is a wrapper over the standard SonarQube scanner and facilitates the process of creating the configuration file of the sonar-project.properties scanner, automatically adding modules (projects in the solution) to it and recording the paths to the source files that need to be analyzed.
However, we are faced with important, from our point of view, limitations of the SonarQube Scanner for MSBuild.
First, when analyzing C / C ++ projects, this scanner will add to the list of files for analysis only those files that have been added to the ClCompile and ClInclude properties of the project file .vcxproj. If, for example, the header file is not explicitly included in the project and is included in the code of one of the source files, this file will be ignored, and the results of the analysis of this file will be missing in the SonarQube.
Secondly, SonarQube Scanner for MSBuild does not add for analysis the source files located higher in the directory tree than the directory in which the project file is located. Messages for such files will also be missing in SonarQube.
, PVS-Studio SonarQube. sonar-project.properties . Analyzing with SonarQube Scanner .
, SonarQube , , (.sln) (.vcxproj/.csproj). , , , sonar.projectBaseDir ( , ), sonar.sources , ( ).
sonar.sources , — . , , SonarQube.
, code smells, SonarQube Security Maintainability . , Duplications, Complexity Documentation.
Conclusion
, SonarQube . (, , ): if you can't measure it, you can't improve it. , , , , , . «-. » :
" « » ( , ) . , . , . « », . , , , .
, , , . , , , , .
, « » . , . . ".
SonarQube « ». SonarQube, , , , « », . SonarQube , . , , , .
SonarQube , ALM-, . . PVS-Studio, SonarQube, .
SonarQube , . SonarQube .
, C/C++ C#, PVS-Studio .
useful links

, : Pavel Kusnetsov. Control source code quality using the SonarQube platform .
Read the article and have a question?
Often our articles are asked the same questions. We collected answers to them here: Answers to questions from readers of articles about PVS-Studio, version 2015 . Please review the list.
Source: https://habr.com/ru/post/315422/
All Articles