How to create PVS-Studio under Linux

Introduction
In general, the console core of the PVS-Studio analyzer has been compiled under Linux for quite some time. For about three years now. I will immediately answer the question about the absence of such a version in the public domain - to make a software product, even on the basis of an existing one, it is a lot of work and a lot of man-hours, a lot of unforeseen problems and nuances. Then we only foresaw this, so the official support of the analyzer for Linux systems did not start.
As the author of many articles on project validation, unlike my colleagues, I often found inspiration in Linux projects. This environment is very rich in large and interesting open source projects that are either very difficult to build in Windows or not at all. It is within the framework of such tasks of checking some open source project that PVS-Studio for Linux has been developing until today.
It took a couple of months to port the PVS-Studio kernel code to Linux with small forces. Replacing several calls to system functions and debugging on the Chromium project gave a well-functioning console application. This version of the analyzer was added to regular nightly builds, and also tested with the Clang Static Analyzer. Periodic inspections of open projects and assembly control allowed the analyzer to exist seamlessly for several years and sometimes it even seemed that this tool could already be sold. But you still do not know how I had to check the projects at that time ...
')
About using static analysis tools

Before continuing the story about the development of our tool, I would like to talk a little bit about the very methodology of static analysis. Thus, immediately answering the questions in the style: “Why use third-party tools, if you can immediately write code without errors and make a review with colleagues?”. Unfortunately, this question sounds quite often.
Static code analysis allows you to detect errors and shortcomings in the source code of programs. Regardless of the tools used, this is an excellent methodology for code quality control of future applications. If possible, it is useful to combine different tools of static analysis.
Among our readers, users, or listeners at conferences there are people who believe that reviewing code with colleagues is more than enough to identify errors at an early stage of writing code. And something in such "inspections" certainly manages to find. But all this time we are talking about the same thing. After all, static analysis can be viewed as an automated code review process. Imagine that a static analyzer is another colleague of yours. A sort of virtual human robot, who tirelessly participates in all reviews of the code and points to suspicious places. Isn't that helpful ?!
In many branches of production, automation is resorted to in order to exclude the so-called “human factor”. And code quality control is no exception. We do not urge to refuse manual code-review if you practice it. Just using a static analyzer will help identify even more errors at an early stage.
Another important point - the program does not get tired and not lazy. Errors of a different nature are entered into the code. Typos? They are very difficult to distinguish eyes. Language errors? Strongly dependent on the qualification of the examiner. The situation is aggravated by modern code volumes. Many functions do not fit entirely even on large monitors. When the context is incomplete, the inspector's vigilance is reduced. Plus, after 15 minutes of attentive reading, a person starts to get tired. And the further, the stronger. Hence the popularity of automatic analysis tools, which is growing every year.
What did PVS-Studio users ask for from the Linux version?

Our product has always been interesting to people, one way or another connected with the development of programs. These are Windows users who could immediately try the analyzer. Not programmers in general or programmers of other platforms and languages who also follow our activity with interest. Such attention is expected, since Many errors are common to many programming languages.
Linux users have long and hard asked about the work of the analyzer on this platform. Questions and arguments can be summarized as follows:
- Command line utility - “IDE integration is not needed!”
- The installer is not needed - "We will install everything ourselves!"
- Documentation is not needed - "Run it yourself!"
A further story will repeatedly confirm the inconsistency of user statements with their expectations.
The Myth of Understanding Assembly Scripts

After talking with people from large commercial projects, it turned out that quite a few developers are not familiar with building projects, and in fact such knowledge is not always needed in full. How to build / debug your project / module every developer knows. But usually all this knowledge is in the recruitment of several magic commands that programmers perform. Figuratively speaking, they have a large button, which is enough to press and at the output they get the assembled modules. But how it all works inside, they have only a general idea. And the assembly scripts are often followed by a special person.
In such cases, a tool is needed to verify the project without integration, at least to familiarize yourself with the analyzer.
The Linux version of the analyzer appeared just after we made a compiler monitoring system in Windows that allowed us to check any projects on this platform. As it turned out, there are a lot of serious projects that are built using the compiler from Microsoft, but they do not have a project for Visual Studio. So we wrote articles about checking Qt, Firefox, CryEngine5 and even collaborated with Epic Games, correcting errors in their code. Our research has shown that if you know the information about the compiler: the launch directory, command line parameters and environment variables, then this information is enough to call the preprocessor and perform the analysis.
When planning to check Linux projects, I immediately realized that I would not understand the integration of the analyzer into each specific project, so I made a similar monitoring system for ProcFS (/ proc / id's). I took the code from the Windows plug-in and ran it in mono to analyze the files. For several years, this method has been used to test projects, the largest of which is the Linux and FreeBSD kernel . Despite the long-term use of such a method, it is in no way suitable for mass use. The product is not yet ready.
Choice of monitoring technology

Having decided on the necessity and importance of such a functional, we began to make prototypes and choose.
- (-) Clang scan-build - by looking at the Clang scripts, we made a prototype, which in a similar way wrote the analyzer's call into CC / CXX variables. We have come across the fact that in this way it is not possible to check some open projects using the Clang Static Analyzer. Having understood this method better, we realized that often in projects, compilation flags are added to these variables in these variables. And at redefinition of variables it is not possible to save them. Therefore, we abandoned this method.
- (+) strace - the utility produces a fairly detailed trace log, in which most of the logged processes are not related to compilation. Also in the output format of this utility there is no working directory of the process that we need. But the directory was found by linking the child and parent processes, and an application in C ++ parses such a file very quickly, launching the analysis of the files found in parallel. So you can check the projects with any build system and get acquainted with the analyzer. For example, we recently rechecked the Linux Kernel again, now it is easy and simple.
- (+) JSON Compilation Database - this format can be obtained for the CMake project by specifying one additional flag. It has all the necessary information for analysis without unnecessary processes. Supported.
- (±) LD_PRELOAD — analyzer integration through function substitution. This method will not work if the project is already being built this way. There are also utilities to get the JSON Compilation Database for non-CMake projects using LD_PRELOAD (for example, Bear ). They have a slight difference from CMake, but we also supported them. And if the project does not depend on any set environment variables, then we will also be able to check the project. Therefore ±.
The appearance of regular tests
There are different ways to test software. To test the analyzer and diagnostics, the most effective are the runs on a large code base of open projects. To begin with, we selected about 30 large open source projects. Earlier, I mentioned that the compiled Linux analyzer existed for more than a year and the projects for the articles were checked regularly. Everything seemed to work well. But just starting the full test, we saw a complete picture of the shortcomings of the analyzer. Before starting the analysis, it is necessary to analyze the code in order to find the necessary constructions. Despite the insignificant influence of a nonseparable code on the quality of analysis, the situation is still unpleasant. Non-standard extensions exist in all compilers, but MS Visual C / C ++ we have long supported them, and with GCC we had to start this struggle almost from the very beginning. Why almost? In Windows, we have long supported the work with GCC (MinGW), but it is not so widely distributed there, therefore, neither we nor the users had any problems.
Compiler extensions

In this section, we will focus on the code that you, I hope, will not see anywhere else: code that uses GCC extensions. It would seem, why we may need them? In most cross-platform projects, they are unlikely to be used. First, as practice shows, they are used. Developing a system for testing projects under Linux, we met this code. But the main problem arises when parsing the standard library code: extensions are used there to the fullest. In preprocessed files from your project, you can never be sure: for the sake of optimization, the familiar memset function may turn out to be a macro consisting of a statement expression. But first things first. What new designs have we met while testing projects under Linux?
Noted initializers were one of the first extensions encountered. Using them you can initialize the array in any order. This is especially useful if it is indexed by enum : we explicitly specify the index, thereby increasing readability and reducing the likelihood of making a mistake when modifying it further. It looks very nice and simple:
enum Enum { A, B, C }; int array[] = { [A] = 10, [B] = 20, [C] = 30, } For the sake of sporting interest, let's complicate an example:
enum Enum { A, B, C }; struct Struct { int d[3]; }; struct Struct array2[50][50] = { [A][42].d[2] = 4 }; That is, any sequence of indexations and calls to members of the structure can be used as an initializer in this construction. The range can also be specified as an index:
int array[] = { [0 ... 99] = 0, [100 ... 199] = 10, } A small but very useful from a security point of view, the GCC extension is associated with a null pointer. Many words have already been said about the problem of using NULL , I will not repeat it. For GCC, the situation is slightly better, because NULL in C ++ is declared as __null . Thus, GCC saves us from such leg shots:
int foo(int *a); int foo(int a); void test() { int a = foo(NULL); } When compiling we get the error:
test.c: In function 'void test()': test.c:20:21: error: call of overloaded 'foo(NULL)' is ambiguous int a = foo(NULL); ^ test.c:10:5: note: candidate: int foo(int*) int foo(int *a) { ^ test.c:14:5: note: candidate: int foo(int) int foo(int a) { GCC has the ability to set __attribute __ (()) attributes. There is a whole list of attributes for functions, variables, and types with which you can control linking, alignment, optimizations, and many other things. One of the interesting attributes is transparent_union . If we make such a union a function parameter, then not only the union itself, but also the pointers from this enumeration can be passed as an argument. This code will be correct:
typedef union { long *d; char *ch; int *i; } Union __attribute((transparent_union)); void foo(Union arg); void test() { long d; char ch; int i; foo(&d); //ok foo(&ch); //ok foo(&i); //ok } An example that transparent_union uses is the function wait : it can accept both int * and union wait * . This is done in favor of compatibility with POSIX and 4.1BSD.
You probably heard about the nested functions in GCC. They can use variables declared before the function. Another nested function can be passed on a pointer (although it is not necessary, for obvious reasons, to call it on this pointer after the completion of the main function).
int foo(int k, int b, int x1, int x2) { int bar(int x) { return k * x + b; } return bar(x2) - bar(x1); } void test() { printf("%d\n", foo(3, 4, 1, 10)); //205 } But did you know that from such a function you can make a goto into a “parent function”? Especially effectively it looks in combination with the transfer of such a function to another.
int sum(int (*f)(int), int from, int to) { int s = 0; for (int i = from; i <= to; ++i) { s += f(i); } return s; } int foo(int k, int b, int x1, int x2) { __label__ fail; int bar(int x) { if (x >= 10) goto fail; return k * x + b; } return sum(bar, x1, x2); fail: printf("Exceptions in my C?!\n"); return 42; } void test() { printf("%d\n", foo(3, 4, 1, 10)); //42 } In practice, however, such code can lead to extremely sad consequences: exception safety is a rather complicated topic even for C ++ with RAII, not to mention C. Therefore, it is better not to do so.
Speaking of goto. In GCC, labels can be stored in pointers and navigated. And if you write them into an array, you get the transition table:
int foo(); int test() { __label__ fail1, fail2, fail3; static void *errors[] = {&&fail1, &&fail2, &&fail3}; int rc = foo(); assert(rc >= 0 && rc < 3); if (rc != 0) goto *errors[rc]; return 0; fail1: printf("Fail 1"); return 1; fail2: printf("Fail 2"); return 2; fail3: printf("Fail 3"); return 3; } And this is a small Clang extension. PVS-Studio has been able to work with this compiler for a long time already; nevertheless, even now we do not cease to be surprised at new constructions appearing in the language and compilers. Here is one of them:
void foo(int arr[static 10]); void test() { int a[9]; foo(a); //warning int b[10]; foo(b); //ok } With such a record, the compiler checks that the passed array has 10 or more elements and issues a warning if this is not the case:
test.c:16:5: warning: array argument is too small; contains 9 elements, callee requires at least 10 [-Warray-bounds] foo(a); ^ ~ test.c:8:14: note: callee declares array parameter as static here void foo(int arr[static 10]) ^ ~~~~~~~~~~~ Closed testing Beta version. Wave 1
Having prepared a stable version of the analyzer, documentation and several ways to test projects without integration, we started closed testing.
When we started issuing the analyzer to the first testers, it turned out that it was not enough to provide an analyzer with an executable file. We received feedback from "You have a great product, we found a bunch of errors" to "I do not trust your application and will not install it in / usr / bin!". Unfortunately, the latter were more. Thus, the arguments of the members of the forum about the possibility of independent work with the executable file were exaggerated. In this form, not everyone can or does not want to work with the analyzer. You need to use some common ways to distribute software in Linux.
Closed testing Beta version. Wave 2
After receiving the first reviews, we stopped testing and plunged into hard work for almost 2 weeks. Testing on someone else's code revealed even more problems with compilers. Since compilers and cross-compilers for various platforms are created on the basis of GCC, then we began to use our analyzer to check anything, even software of different pieces of hardware. In principle, the analyzer coped with its duties, and we received thank-you reviews, but the analyzer missed some code fragments due to extensions that we had to maintain.
False alarms are inherent in any static analyzer, but in Linux their number has increased slightly. Therefore, we started to work out diagnostics for a new platform and compilers.
A big improvement was the creation of Deb / Rpm packages. After their appearance, discontent with the installation of PVS-Studio disappeared. There was probably only one person who was outraged by installing a package using sudo. Although this way put almost all the software.
Closed testing Beta version. Wave 3
We also made a short break for revision and made the following changes:
- Rejection of configuration files for a quick check - after the introduction of Deb / Rpm packages, the first place was taken by the problem of filling in the configuration file for the analyzer. It was necessary to modify the quick check mode of projects without a configuration file with only two required parameters: the path to the license file and the path to the analyzer report. The possibility of advanced settings of this mode remained.
- The work with the strace utility log was improved - initially the strace utility log was processed by a Perl script on which the prototype was made. The script was working slowly and badly parallelizing the analysis. After rewriting this functionality in C ++ file processing accelerated, it also became easier to maintain all the code in one programming language.
- Completion of Deb / Rpm packages - because For the quick check mode, you need the strace utility and the first packages included Perl / Python scripts, we did not immediately correctly write all the dependencies, and later completely abandoned the scripts. Later, several people wrote warnings when installing the analyzer through graphical managers, and we quickly eliminated them. Here I would like to note the benefits of the testing method that we have set up for ourselves: several dozens of Linux distributions are deployed in Docker and installed packages are installed in them. The ability to run installed programs was also checked. Such testing allowed us to promptly make new changes to the packages and test them.
- Other improvements on the analyzer and documentation. We reflected all our achievements in the documentation. Well, the work on finalizing the analyzer never stops: these are new diagnostics and the improvement of existing ones.
Closed testing Beta version. Wave 4 (Release Candidate)
In the last wave of the analyzer's mailing, users already have no problems with installing, running and configuring the analyzer. We receive thank-you reviews, examples of real errors found and examples of false positives.
Also, users have become more interested in the advanced settings of the analyzer. Therefore, we began to refine the documentation on how to integrate the analyzer into the Makefile / CMake / QMake / QtCreator / CLion. How it looks, I will show further.
Well-developed integration methods
Makefile Integration / Makefile.am
Despite the convenience of verifying a project without integration, there are several advantages directly to direct integration into an assembly system:
- Tweaking analyzer;
- Incremental analysis;
- Parallel analysis at the level of the assembly system;
- Other benefits from the assembly system.
When the analyzer is called in the same place as the compiler, then the analyzer has the environment, working directory and all parameters correctly configured. In this case, all the conditions for proper and qualitative analysis.
The integration in the Makefile looks like this:
.cpp.o: $(CXX) $(CFLAGS) $(DFLAGS) $(INCLUDES) $< -o $@ pvs-studio --cfg $(CFG_PATH) --source-file $< --language C++ --cl-params $(CFLAGS) $(DFLAGS) $(INCLUDES) $< CMake / CLion Integration
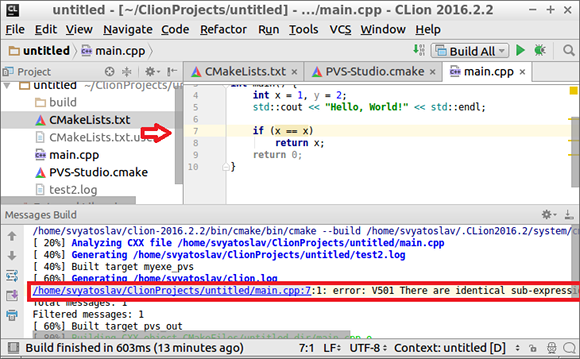
Having studied the integration of the analyzer in CMake, it became possible to use PVS-Studio in CLion. You can receive both the file with the analyzer report, and display warnings in the IDE to view problem areas.
CMake / QtCreator Integration
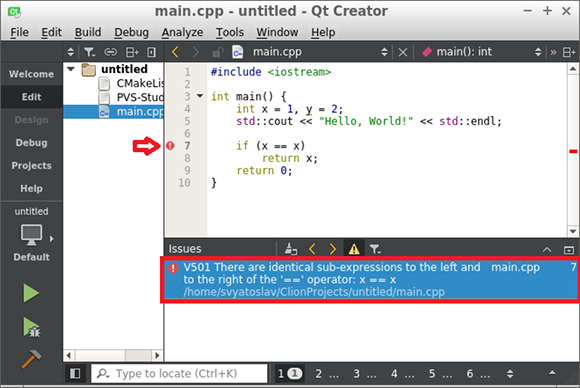
To work with CMake projects in QtCreator, you can also save a report in the same way or immediately view warnings in the IDE. Unlike CLine, QtCreator is able to open for viewing reports saved in the TaskList format.
Integration into QMake / QtCreator
For QMake projects, we also provided a simple integration method:
pvs_studio.target = pvs pvs_studio.output = true pvs_studio.license = /path/to/PVS-Studio.lic pvs_studio.cxxflags = -std=c++14 pvs_studio.sources = $${SOURCES} include(PVS-Studio.pri) Conclusion
What we came to during the development:
- The analyzer is easy to install from a package or repository;
- It is easy to get acquainted with the analyzer by running the test without integrating the analyzer into the assembly system;
- For regular use of the analyzer, you can configure incremental analysis on each developer's machine;
- Setting up a full scan on the build server;
- Integration with popular IDEs.
This tool can already be shown to people, which we did.
Download and try the analyzer can follow the link . Follow our news and send projects for verification, now in Linux!

If you want to share this article with an English-speaking audience, then please use the link to the translation: Svyatoslav Razmyslov: The Development History of PVS-Studio for Linux .
Read the article and have a question?
Often our articles are asked the same questions. We collected answers to them here: Answers to questions from readers of articles about PVS-Studio, version 2015 . Please review the list.
Source: https://habr.com/ru/post/315232/
All Articles