Overclocking the performance of iOS applications

Brake for the battleship USS Indiana BB-1, 1910. This thing should slow down the ship with a displacement of 10453 tons.
Original: iOS App Performance: Instruments & beyond
Posted by: Igor M
Users do not like to wait. They do not care (and should not) what the application needs for initialization; they just want to accomplish their task as quickly as possible. Your application should start almost instantly, its interface should be beautiful with smooth transitions. Application performance is one of the key advantages in a competitive software market.
')
As developers, we also want to be proud of our applications.
However, performance optimization is a complex issue. Most of the bottlenecks are counterintuitive. In the absence of proper measurements, it is extremely difficult to understand what slows down your application.
In order to be able to optimize the performance of your application, you must make data-based decisions. In this part, I will show how to get this data by measuring the performance of various parts of your application.
Tools that I will touch on:
- analytics of the use of CPU, GPU, memory and energy consumption by your application;
- responsiveness of the application;
- launch time;
- performance metrics collected from your users.
Analytics of CPU, GPU, Memory, and Energy Use by Your Application
The first task is to use the profiler to find inefficient code that misuses the CPU, GPU or memory. Apple has a great tool to accomplish this: “ Instruments .”
There are 4 main areas that should be used first:
- CPU ("Time Profiler" tool);
- GPU ("Core Animation" tool);
- memory usage ("allocations" tool);
- power consumption ("Energy diagnostics" tool).

WWDC videos are the best source for using Instruments for profiling your application.
Here are some options to get you started.
- Training Instruments .
- Productivity iOS 1 , 2 , 3 .
- Optimize your application with Instruments .
- Advanced Graphics and Animation for iOS applications .
- Depth profiling .
- Cocoa Touch best practices .
- IOS performance and power optimization with Instruments .
- Polishing your application .
Application responsiveness
The next important thing to measure is the responsiveness of the user interface. Sensory processing occurs in the mainstream. When you have lengthy operations there, your application becomes sluggish.
Some operations may take a long time, even if they do not use a processor. If you have synchronous calls in the main thread, then you should measure the time spent on these calls.
To measure, you can use an example:
CFAbsoluteTime startTime = CFAbsoluteTimeGetCurrent(); // Your method NSUInteger milliseconds = (NSUInteger)((CFAbsoluteTimeGetCurrent() — startTime) * 1000); NSLog(“Done in %lu ms”, milliseconds); Another approach has been described by Viber developers. They create a special stream that monitors the main stream and checks that it is not blocked for more than 400 ms.


More information can be found in their presentations (PDF, 7MB).
Use this data to detect calls that take too long (400 ms is a good threshold, you can read this book for more information) and either optimize them or move it from the main thread.
Start time
The next important thing to measure is how quickly your application starts. A typical user spends just a few minutes in your application. Long startup time leads to frustration.
There are 2 options for running your application.
- Cold start: the process of your application has not yet been launched, the launch is performed first through the OS.
- Warm start: your application has been minimized, but has not been killed. It is restored from the background.
This section is dedicated to cold loading, as it requires more resources and is hard work.
There is a startup sequence from an IOS application. Application launch phases (from documentation)
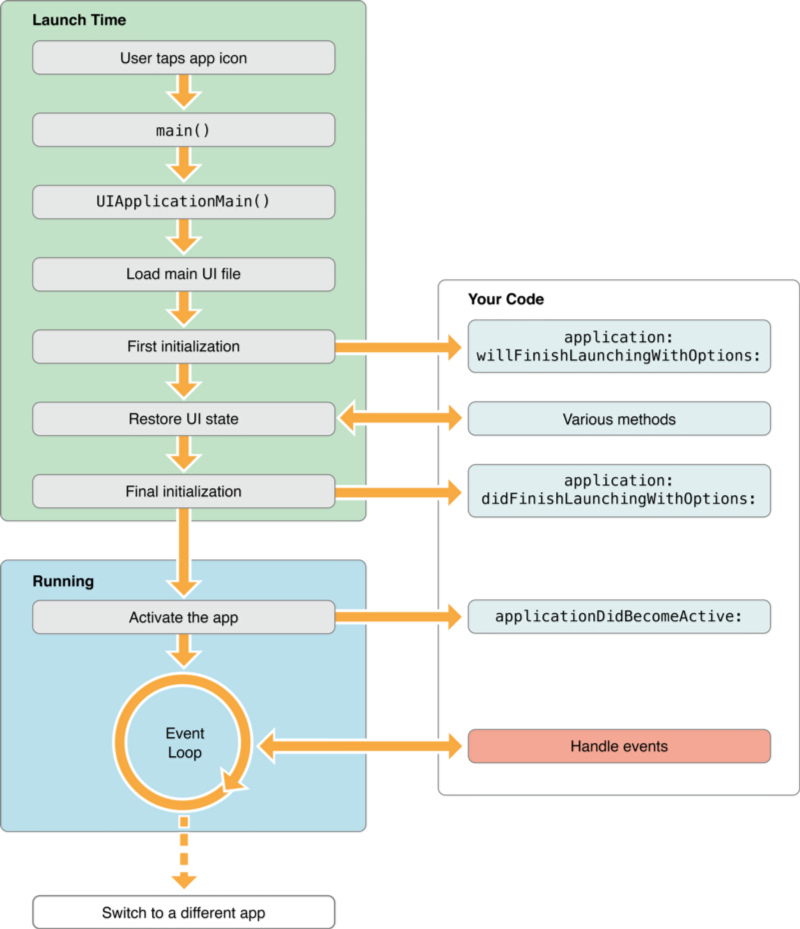
1. Measure the total time taken to start.
We need to measure the time from the beginning of main () to the end of the applicationDidBecomeActive :
main.m
int main(int argc, char * argv[]) { // Save the initial time for startup [[StartipTimeMonitor sharedMonitor] appWillStartLoading]; @autoreleasepool { return UIApplicationMain(argc, argv, nil, NSStringFromClass([AppDelegate class])); } } AppDelegate.m
- (void)applicationDidBecomeActive:(UIApplication *)application { // Your code // We assume that the app is loaded then the main thread become free // after this callback is finished. dispatch_async(dispatch_get_main_queue(), ^{ [[StartipTimeMonitor sharedMonitor] appDidFinishLoading]; }); } After adding the code, check that it doesn't get worse when you add new features to the application. Try to keep the cold start time up to 1 sec.
2. Measure the phase time at startup.
As a rule, it is not enough to know only the total time taken to start. It is also important to know which phase of the startup sequence slows it down.
The most important stages are:
- [AppDelegate application: didFinishLaunchingWithOptions:] - this method is called when the boot image or storyboard is shown. As soon as the execution point returns from this method, the actual loading of the user interface begins.
- [UIViewController loadView] - if your application creates its own UIView, this is where it is initialized.
- [UIViewController viewDidLoad] - UIView was loaded; time for final initialization.
- [AppDelegate applicationDidBecomeActive:] - the user interface has already been initialized, but it is still blocked until the call to this method is completed. This method is also called when the application is restored from the background.
If some of the methods take too much time, then you need to optimize them.
3. Measure launch time "under pressure"
There is one important difference between the real world and the typical test environment.
Your application does not live in isolation in the real world. The user usually enters your application from another application. “Other application” can be very heavy.
It is really important to measure the launch time in the conditions when your application is launched while another, heavy application is at the same time taken to the background and trying to save its data. This testing may reveal some unexpected results. Code that was completely harmless before can slow down your application significantly under these conditions.
- 4. The application has already started, but still useless
If your application does not work after the user interface is loaded, then you need to assume that in fact the startup phase is not yet complete. Even if the loaded user interface is responsive, but there is data that needs to be loaded, then this should also be considered part of the launch phase.
Performance indicators to be assembled from users
All previous measurements are possible in a test environment. They are necessary, but not sufficient. If your application is popular, if the base of your users is spread around the globe, some of your users may have an environment that is very different from what you expected.
They may have different:
- network conditions;
- hardware;
- software (OS version, jailbreak ...);
- the amount of free space on the device;
- etc.
They may use the application in an unusual way.
You can get a “one star” rating when reviewing complaints (“Your app is slow!”). Even if all the metrics that you measure in the lab are in the safe zone.
What to do with it?
Determine a set of performance indicators (KPIs) and collect them from your real users. You can use almost any analytics package to do this.
Here are examples of key performance indicators that you can get from users:
- total cold start time;
- total warm start time;
- phase start time;
- the time spent on downloading the necessary data from the server;
- the number of times the main thread is blocked for more than 400 ms;
- Number of low memory warnings
- number of FOOMS ;
- the duration of operations when the interface is locked, or is unusable.
Analytics packages will allow you to distribute these indicators into segments, along with the type of device, country, or network operator. This will help get an idea of what performance problems users have and how to fix it.
findings
As you can see, performance measurements go beyond just launching Instruments.app. There are other important points to analyze. Some of the described methods of analysis are quick and easy to implement, others require more time and effort. However, they will help you monitor the performance of the application to find and fix problems and make your application more enjoyable to use.
Achieving high performance scrolling, for example Facebook application
Original: Delivering high scroll performance
Posted by: Clément Genzmer
One of our goals on Facebook is to maximize the user experience of using our iOS app. One of the tasks is to make sure that the news feed scrolls smoothly, but in a complex UIScrollView, with very diverse content, there are currently no good ways in iOS to determine why the frame rate has decreased. We have developed an identification strategy that works very well in practice and helps us maintain high scrolling performance. Next, we describe in detail how it works.
Measure scroll performance on device
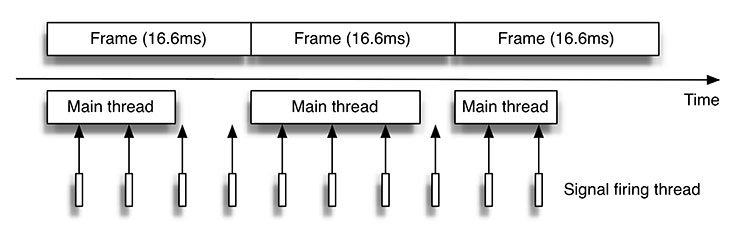
The first step in most of the work is to measure performance and measuring instruments. Apple's tools allow you to measure the frame rate of your application, but it's still difficult to simulate all the interactions that occur while the application is running. Another approach would be to measure the scroll performance directly on the device.
We measure the frame rate on a device using Apple's CADisplayLink API. Every time a frame is outlined, we measure the time it took to do this. If it took more than one sixtieth of a second (16.6 ms), the frame rate was low and the scrolling jerked.
[CADisplayLink displayLinkWithTarget:self selector:@selector(_update)];
[_displayLink addToRunLoop:[NSRunLoop mainRunLoop] forMode:NSRunLoopCommonModes];
Detecting and fixing regression
Unlike video games, the Facebook application does not use the GPU very intensively. It displays mostly text and images, and thus most frames fall due to processor overhead. To maintain the high performance of the processor, we want to make sure that all operations that make up the data rendering in the News Feed are performed in less than 16.6 milliseconds. In practice, frame rendering consists of several stages, and an application, as a rule, has only 8 to 10 ms in the main stream until the frame rate drops.
Knowing where the main thread spends most of the time on the CPU allows you to get the best scrolling performance. You can use the Time Profiler tool to estimate where the main thread spends most of the time, but it can be difficult to recreate the exact conditions on the device when the frame rate drops.
Another approach is to collect data while the application is running to help determine the most likely cause of a frame drop. That is, we can say that the application profiles itself. To do this, you need to use signals. The data obtained may not be accurate, but this allows you to get profiling data in an isolated environment. This is not possible with traditional profiling on iOS using standard tools such as Instruments and DTrace.
Signals and profiling on the device
In order to understand what the thread is doing, we pause it by sending a signal to it, which has a callback function registered to the signal.
static void _callstack_signal_handler(int signr, siginfo_t *info, void *secret) { callstack_size = backtrace(callstacks, 128); } struct sigaction sa; sigfillset(&sa.sa_mask); sa.sa_flags = SA_SIGINFO; sa.sa_sigaction = _callstack_signal_handler; sigaction(SIGPROF, &sa, NULL); Operations that are safe when dealing with signals are quite limited. Allocating memory, for example, is not a safe operation, so the only thing we do in the signal handler is to capture the current stack trace.
Trigger signal
After the signal is set, we need a mechanism to trigger the signal. This cannot be sent from the main stream, since we are trying to track this stream. GCD is an excellent abstraction for controlling the flow of execution. However, dispatch sources, the standard mechanism for supporting execution blocks, will be executed with a time resolution no more than every 10 ms. NSThread offers the necessary granularity with higher temporal resolution.
When the main thread is heavily loaded, and as a result, the frame rate drops, it will consume most of the processor execution time. Unfortunately, this means that our reporting flow will be awakened when the main flow has already completed all labor-intensive operations, and we will miss the moment of intensive use. To get around this problem, we give the telling thread a priority that is higher than in the main thread. This ensures that we can capture the trace, even when the main thread is maximally loaded.
_trackerThread = [[NSThread alloc] initWithTarget:[self class] selector:@selector(_trackerLoop) object:nil]; _trackerThread.threadPriority = 1.0; [_trackerThread start]; As is often the case with performance measurement, the act of measuring affects an application and may have additional implications for application performance. Capturing a trace on the iPhone 4S takes about 1 microsecond, and when you have only 16 milliseconds, it would seem that this is quite a bit. In addition, the act of suspending the main thread (sending a signal) generates more context switches between threads and can slow down the application as a whole.
Thus, it is important to choose an ideal measurement policy only when absolutely necessary. In our case, we made a number of optimizations, while measuring. For example, a signal should be sent only when the user scrolls. Another change we made is the performance measurement only on the internal assembly, which is used only by employees, so the measurement will not affect our public version of the program.
Reporting and symbolization
After the trace is captured, we collect this data on the device and send it to the server in batch mode. Tracing, of course, is unreadable - a collection of addresses - and should be symbolized, for which there are a number of tools. Apple, Atos API, Google Breakpad and atosl Facebook are some examples. After symbolization, we aggregate call stacks using a data visualization tool to identify parts of the system on which to focus our efforts to prevent regression, as we continue to improve the efficiency of our scrolling.
Below is an example showing the CPU usage of two versions of the Facebook application:

try it
This strategy allowed us to discover a very large number of regressions before they hit the release version. We put a sample of this implementation on github . We hope you find it useful in your projects.
Read more
- 27 open-source nishtyachkov for iOS developer
- 8 principles of development planning, simplifying life
- Developing fast mobile apps on Android
The EDISON Software portfolio has 8 projects related to Android development and 4 major projects related to iOS development:
- Service delivery of banking notifications on smartphones
- Vivaldi application for working with the electronic library
- Viral distribution of information
- Mobile applications for access to corporate infrastructure
Source: https://habr.com/ru/post/315150/
All Articles