Using MS Cognitive Services to analyze your Instagram profile
Hello to all! In this article I would like to talk about MS Cognitive Services and how I decided to build an infographic on instagram.
To begin with, I would like to tell you what inspired me to write this article. I really love “fun” technologies, as they are, if not the ideal tool for teaching people about programming, then at least the best way to involve people in this rather exciting profession. From my own experience I can say that when you start learning programming, it may seem insanely boring. It is not entirely clear how all these variables, classes and objects are connected with such an interesting thing as, say, games. Previously, I considered game development using various engines to be one of the best ways to engage people in something interesting, but then I stumbled upon another “fun” technology - these are cognitive services that also allow you to simply get interesting and visual results.
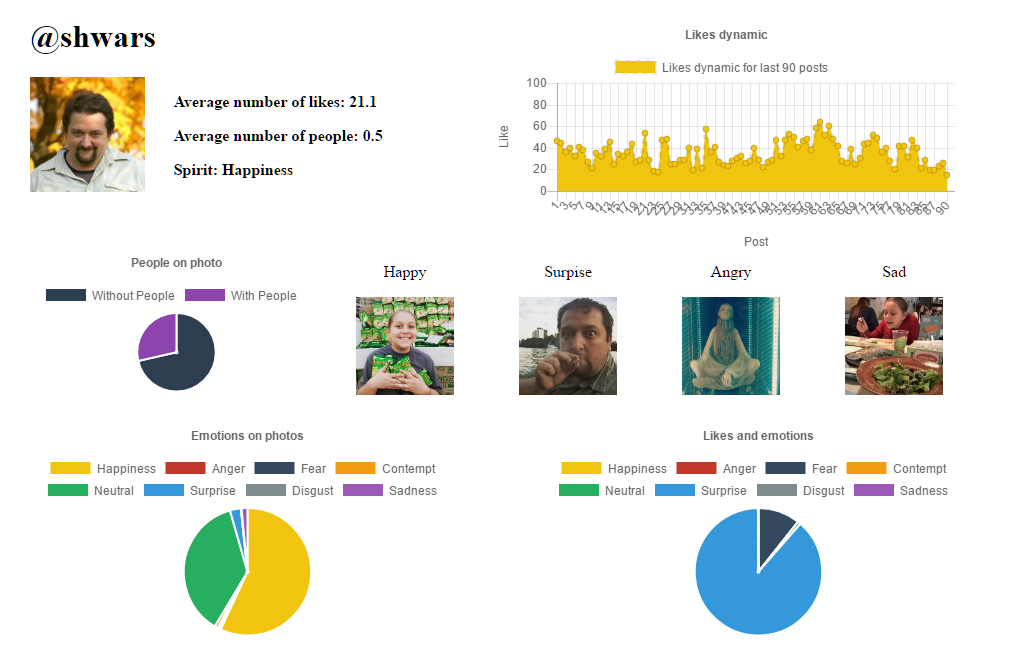
In order to understand the technology, I invented a task for myself that it would take me a short time to solve. I decided to take an instagram profile of a person and build an infographic based on the data obtained using the Emotions API.
')
Here the first problems arose due to the fact that “honestly” is not so easy to get data from an instagram. The fact is that to get them through the Instagram API, you need to register the application and get a token, which will wait about a week. Moreover, the token is needed even for collecting data from open profiles. It did not suit me - I set myself three days to solve the problem. I do not want to focus on this, as a result of the help of colleagues, three unsuccessful ideas and Google, the first part of the problem was solved in a few hours.

Then it was necessary to deal with the Emotions API. At first everything was pretty simple. I created a UWP project, downloaded the required set of libraries through NuGet. Got a token for the API. Instructions can be found here . At that moment, I was glad that it could work with urls, since it meant that I could just take urls from instagram and not sweat about it. What is the Emotions API? In fact, these are two classes:
If there are several faces in the photo, the EmotionServiceClient will return an array from Emotion when requested, where each element of the array will be a face in the photo. The Emotion API can handle up to 64 people in one photo at a time.
First of all, I decided to make a wrapper over the Emotions API, which will accept input from the instagram, and output data on emotions partially combined with data from the instagram.
For this, a static class EmoUtils was written, in which the method is implemented
You may notice a delay, subject to the condition that we have a trial version of the Cognitive API. The fact is that on the trial version you can do only 20 requests per minute.
Everything, the data is received, as I spoke with the API, everything is very simple, so this part was implemented in a few hours. And then the fun began. Building infographics using the data.
In the course of the endless searches and surveys among my friends, I never found a single good C # library with documentation that would allow me to make a nice infographic. Then I got the idea to use Python, but I didn’t like the fact that you need to run a separate script. Yes, and make a beautiful layout and save in png an infographic made using the same MatPlotLib is not so simple. The task remained at that time of the day. By that time, I had already implemented serialization in JSON, so that once again I wouldn’t pull instagram and Emotion API, so MS Power BI came to mind. In general, a good program for data visualization, but again you need to run a separate application each time you receive data, at the same time you need to know Power Query at a high enough level to work with JSON. Thoughts were spinning in my head ... Convenient layout and beautiful visualization ... Convenient layout ... Imposition ... Web! I thought that there must be a sea of solutions on the subject of data visualization on the web, it would be convenient to impose them, and there is no need to run any separate applications. We give a web template at the entrance, and at the output we get millions of pages with infographics. And I was right, the Chart.js library was ideal for this purpose. For a couple of hours, I wrote a simple tagging system that allowed you to insert the right data into the right places on the page. The decision could have been more beautiful, but there was little time, and the terms were burning. And I was able to meet! Data from instagram is collected and obtained in the form of a curious infographic.


As a result, I can say that MS Cognitive Services Emotions is a very easy to use API. In addition, it can be accessed from Python, which is also described quite well in the documentation. It gives very good results. In my opinion, if students come up with a simpler task, they will be interested, because the result is “on the face”, and while Microsoft provides the opportunity to use their API completely free of charge - this is a great chance to give students a little play around with interesting technology and in some way learn something.
This solution can be found in my githab profile .
Thanks for attention!
To begin with, I would like to tell you what inspired me to write this article. I really love “fun” technologies, as they are, if not the ideal tool for teaching people about programming, then at least the best way to involve people in this rather exciting profession. From my own experience I can say that when you start learning programming, it may seem insanely boring. It is not entirely clear how all these variables, classes and objects are connected with such an interesting thing as, say, games. Previously, I considered game development using various engines to be one of the best ways to engage people in something interesting, but then I stumbled upon another “fun” technology - these are cognitive services that also allow you to simply get interesting and visual results.
In order to understand the technology, I invented a task for myself that it would take me a short time to solve. I decided to take an instagram profile of a person and build an infographic based on the data obtained using the Emotions API.
')
Here the first problems arose due to the fact that “honestly” is not so easy to get data from an instagram. The fact is that to get them through the Instagram API, you need to register the application and get a token, which will wait about a week. Moreover, the token is needed even for collecting data from open profiles. It did not suit me - I set myself three days to solve the problem. I do not want to focus on this, as a result of the help of colleagues, three unsuccessful ideas and Google, the first part of the problem was solved in a few hours.
Then it was necessary to deal with the Emotions API. At first everything was pretty simple. I created a UWP project, downloaded the required set of libraries through NuGet. Got a token for the API. Instructions can be found here . At that moment, I was glad that it could work with urls, since it meant that I could just take urls from instagram and not sweat about it. What is the Emotions API? In fact, these are two classes:
EmotionServiceClient is the class that is responsible for communicating with the service.
Emotion - a class that stores data about the position of the face and the likelihood of what emotion is on the face.
If there are several faces in the photo, the EmotionServiceClient will return an array from Emotion when requested, where each element of the array will be a face in the photo. The Emotion API can handle up to 64 people in one photo at a time.
First of all, I decided to make a wrapper over the Emotions API, which will accept input from the instagram, and output data on emotions partially combined with data from the instagram.
For this, a static class EmoUtils was written, in which the method is implemented
Implemented method
private static async Task<List<EmoInfo>> GetDataFromMsCognitive( List<InstaInfo> instaInfo, string apiKey, bool isApiKeyTrial) { // API EmotionServiceClient _EmoClient = new EmotionServiceClient(apiKey); List<EmoInfo> emoInfoList = new List<EmoInfo>(); Emotion[] emoInfo; for (int i = 0; i < instaInfo.Count; i++) { try { if (isApiKeyTrial) { await Task.Delay(3000); } // API emoInfo = await _EmoClient.RecognizeAsync(instaInfo[i].PostImageUrl); EmoInfo info = new EmoInfo(); info.ProfileFullName = instaInfo[i].ProfileName; info.ImageUrl = instaInfo[i].PostImageUrl; info.CommentsCount = instaInfo[i].CommentsCount; info.LikesCount = instaInfo[i].LikesCount; info.Emotions = emoInfo.ToList(); emoInfoList.Add(info); System.Diagnostics.Debug.Write($"Photo number: {i}\n"); } catch { } } System.Diagnostics.Debug.Write("Success!\n"); return emoInfoList; } You may notice a delay, subject to the condition that we have a trial version of the Cognitive API. The fact is that on the trial version you can do only 20 requests per minute.
Everything, the data is received, as I spoke with the API, everything is very simple, so this part was implemented in a few hours. And then the fun began. Building infographics using the data.
In the course of the endless searches and surveys among my friends, I never found a single good C # library with documentation that would allow me to make a nice infographic. Then I got the idea to use Python, but I didn’t like the fact that you need to run a separate script. Yes, and make a beautiful layout and save in png an infographic made using the same MatPlotLib is not so simple. The task remained at that time of the day. By that time, I had already implemented serialization in JSON, so that once again I wouldn’t pull instagram and Emotion API, so MS Power BI came to mind. In general, a good program for data visualization, but again you need to run a separate application each time you receive data, at the same time you need to know Power Query at a high enough level to work with JSON. Thoughts were spinning in my head ... Convenient layout and beautiful visualization ... Convenient layout ... Imposition ... Web! I thought that there must be a sea of solutions on the subject of data visualization on the web, it would be convenient to impose them, and there is no need to run any separate applications. We give a web template at the entrance, and at the output we get millions of pages with infographics. And I was right, the Chart.js library was ideal for this purpose. For a couple of hours, I wrote a simple tagging system that allowed you to insert the right data into the right places on the page. The decision could have been more beautiful, but there was little time, and the terms were burning. And I was able to meet! Data from instagram is collected and obtained in the form of a curious infographic.
As a result, I can say that MS Cognitive Services Emotions is a very easy to use API. In addition, it can be accessed from Python, which is also described quite well in the documentation. It gives very good results. In my opinion, if students come up with a simpler task, they will be interested, because the result is “on the face”, and while Microsoft provides the opportunity to use their API completely free of charge - this is a great chance to give students a little play around with interesting technology and in some way learn something.
This solution can be found in my githab profile .
Thanks for attention!
Source: https://habr.com/ru/post/314904/
All Articles