Decompiling Java methods on a productive application under load - myth or reality?
Testing is undoubtedly one of the whales on which application development stands. As with any characteristic whale, testing can be fouled with bugs and does not stop for a long time. But the main question is the sufficiency of the test coverage - will all the bugs on the written test cases be caught? Perhaps some will appear only under user load. To identify these, as a rule, the user’s request is detonated and the following chain reaction is activated: the Help Desk specialist, the second line of support and, if lucky, the message of abnormal work falls into the hands of the developer. Yes, an incident may also come from the APM monitoring system (if you have one, of course). But all these things will not allow to unambiguously determine what values the variables took before the exception occurred. In the post we will just talk about the decision, designed to help in such situations.

Sit back. Let's talk about OverOps - a solution for detecting errors in the operation of applications in Java, Scala, Clojure and Groovy. I will show some screenshots and tell you about the main features of the product. In the introduction, it was not by chance that we talked about testing. Errors. arising in a production environment does not necessarily appear in the development and testing environment. And the load of real user activity can produce hitherto unseen exceptions.
')
The essence of OverOps work is as follows:
1) when you start the JVM, the OverOps agent starts next to it;
2) the agent is able to monitor the occurrence of exceptions in the code (both processed and not processed);
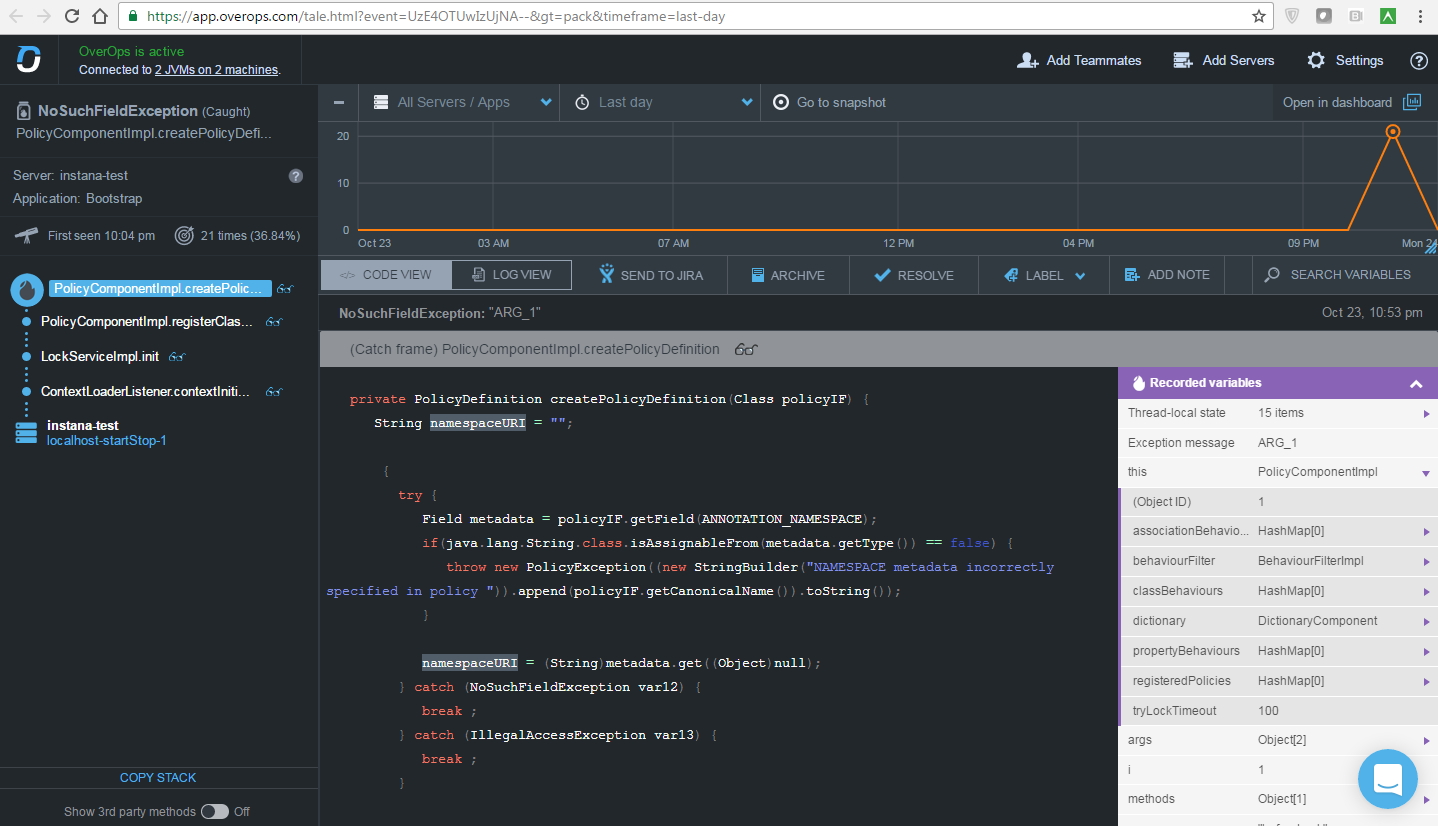
3) the agent at the time of the exception removes the heapdump and imposes it on the decompiled bytecode.
As a result, you can see what values the variables took until the time the exception occurred. When an agent is running, the vendor claims its maximum overhead is 3%. At our laboratory stand, with a small load, it was not possible to approach this indicator very strongly, so for now we believe in the word.
I do not know how anyone, but I especially enjoy the monsters that occasionally flash here and there in the interface. It turns out that OverOps has a whole monster set , individual representatives of which materialize when corresponding errors occur. Funny, yes?

In the interface itself, it looks like this:
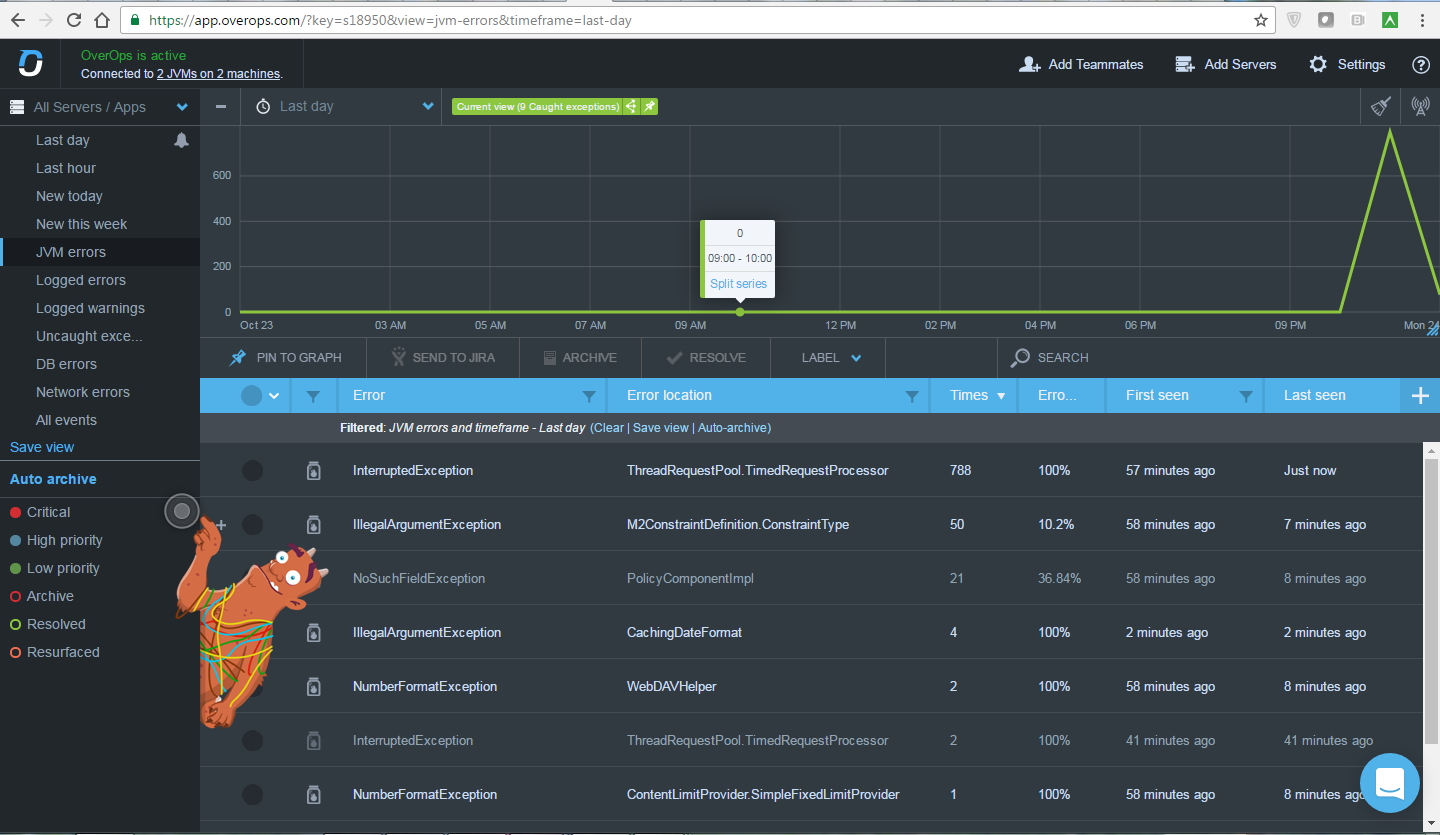
The system collects snapshots on a periodic basis (i.e., we will not see all the errors, but we will see their number). You can create rules, for example, “10 mistakes of this kind”: “report there” (“get a bug in Jira”, “schekani in Slack”,“post it in Twitter” , etc.). The full list of integrations can be viewed at the link .
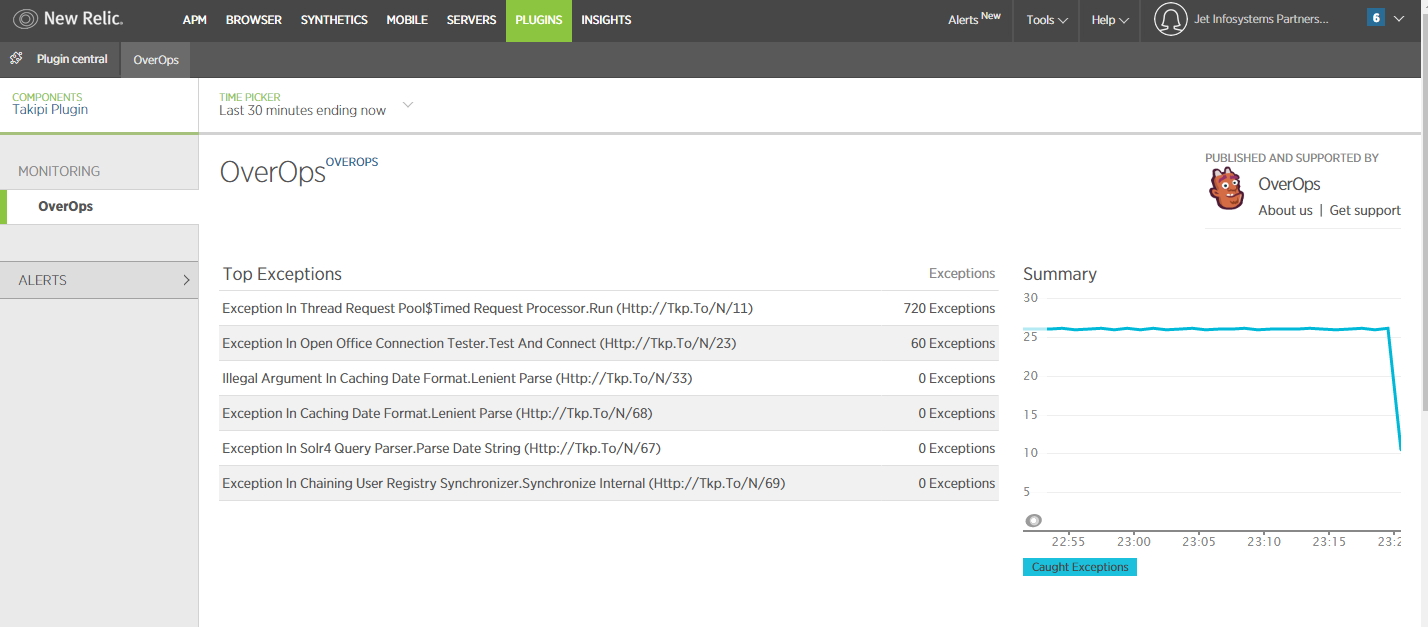
Here is an example of my test integration with NewRelic. Details are displayed on the Plugins tab and are accompanied by a direct link to OverOps, which, frankly, is very convenient:
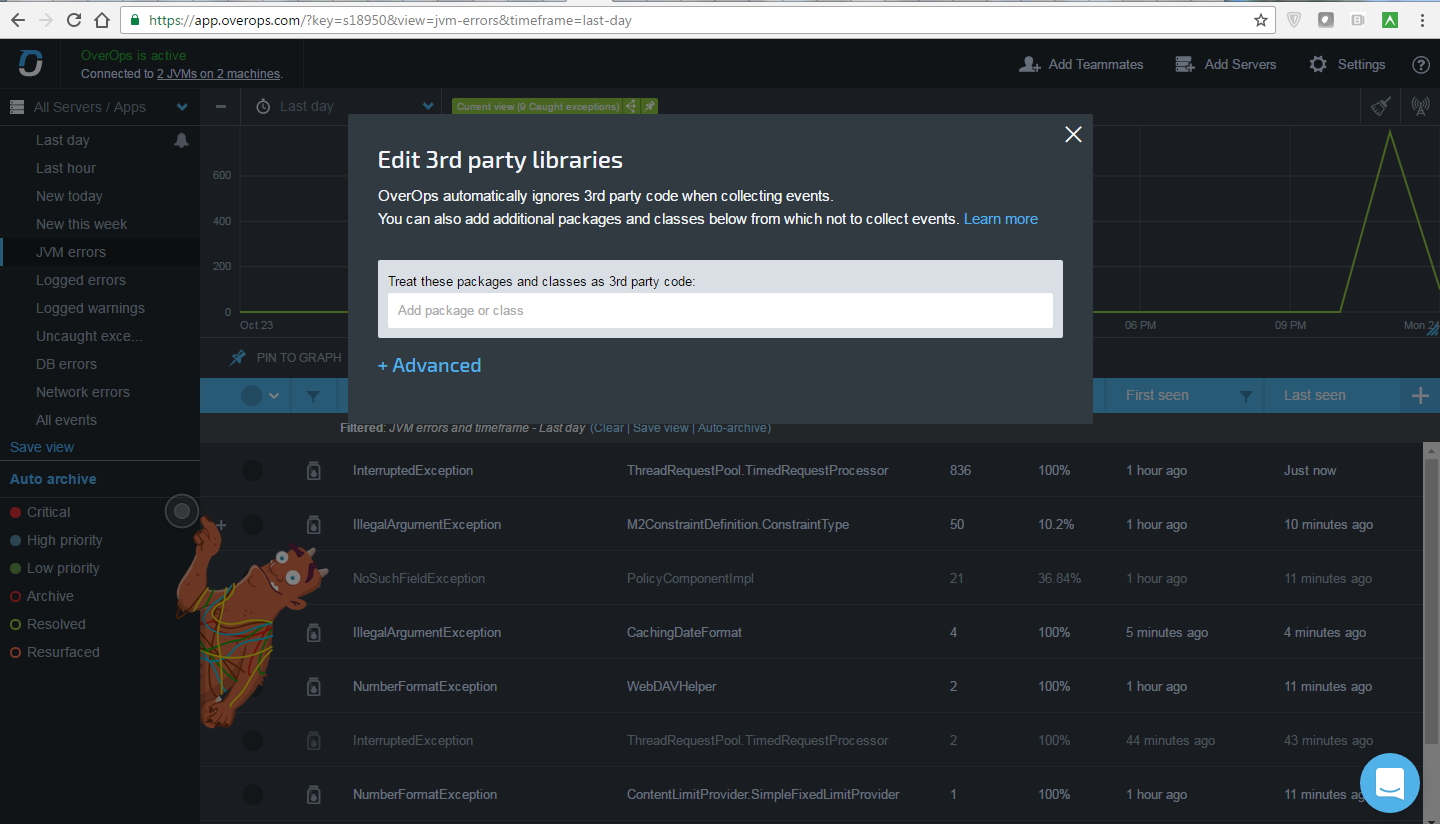
OverOps can filter third-party libraries to exclude them from monitoring. In the interface itself, it looks something like this:
Another of the functionality: the attachment of the source code from the outside, filtering errors, if they contain personal data (configured using regular expressions). From small minuses: do not know how to show the type of the object, if it was inherited from the base type, and the method signature accepts the base type.
By the type of installation of the solution, all possible scenarios are provided: SaaS, Hybrid, On-Premise.
Now, of course, it’s too late to say that OverOps would be very useful in the high season, as it is during periods of increased load that there are great chances to catch various errors that didn’t show themselves at any other time. But for the following holidays and peak attendance relevant to them, it is still worth thinking about carefully monitoring your retail system. Please contact us with questions in the comments. And if the task requires a slightly more thoughtful approach, our consulting, like the light in a window in a blizzard and blizzard , always appears at the right moment.
Author of the article: Anton Kasimov , architect of control systems, Jet Infosystems.
Sit back. Let's talk about OverOps - a solution for detecting errors in the operation of applications in Java, Scala, Clojure and Groovy. I will show some screenshots and tell you about the main features of the product. In the introduction, it was not by chance that we talked about testing. Errors. arising in a production environment does not necessarily appear in the development and testing environment. And the load of real user activity can produce hitherto unseen exceptions.
')
The essence of OverOps work is as follows:
1) when you start the JVM, the OverOps agent starts next to it;
2) the agent is able to monitor the occurrence of exceptions in the code (both processed and not processed);
3) the agent at the time of the exception removes the heapdump and imposes it on the decompiled bytecode.
As a result, you can see what values the variables took until the time the exception occurred. When an agent is running, the vendor claims its maximum overhead is 3%. At our laboratory stand, with a small load, it was not possible to approach this indicator very strongly, so for now we believe in the word.
I do not know how anyone, but I especially enjoy the monsters that occasionally flash here and there in the interface. It turns out that OverOps has a whole monster set , individual representatives of which materialize when corresponding errors occur. Funny, yes?
In the interface itself, it looks like this:
The system collects snapshots on a periodic basis (i.e., we will not see all the errors, but we will see their number). You can create rules, for example, “10 mistakes of this kind”: “report there” (“get a bug in Jira”, “schekani in Slack”,
Here is an example of my test integration with NewRelic. Details are displayed on the Plugins tab and are accompanied by a direct link to OverOps, which, frankly, is very convenient:
OverOps can filter third-party libraries to exclude them from monitoring. In the interface itself, it looks something like this:
Another of the functionality: the attachment of the source code from the outside, filtering errors, if they contain personal data (configured using regular expressions). From small minuses: do not know how to show the type of the object, if it was inherited from the base type, and the method signature accepts the base type.
By the type of installation of the solution, all possible scenarios are provided: SaaS, Hybrid, On-Premise.
Now, of course, it’s too late to say that OverOps would be very useful in the high season, as it is during periods of increased load that there are great chances to catch various errors that didn’t show themselves at any other time. But for the following holidays and peak attendance relevant to them, it is still worth thinking about carefully monitoring your retail system. Please contact us with questions in the comments. And if the task requires a slightly more thoughtful approach, our consulting, like the light in a window in a blizzard and blizzard , always appears at the right moment.
Author of the article: Anton Kasimov , architect of control systems, Jet Infosystems.
Source: https://habr.com/ru/post/314874/
All Articles