The basis of the system business - basic analytics
One day, a man was driving along the freeway in his car ... Fog everywhere. As they say, he was driving "on intuition" ... Okay, fog, so also the car without headlights, speedometer, only wheels, steering wheel and body ... Bach! Wall, accident, repair, broken fate, costs.
The story is fantastic, isn't it? Then why are 90% of companies moving absolutely and blindly? Counting only on intuition and without understanding what is really happening in the company?

')
Many founders, entrepreneurs and startups have heard about the essence and benefits of “digitizing” a business, the vision of key indicators. Many have heard and know about RoiStat, SmallData, BigData and so on.
But at the same time, either all this is not implemented, or is not used at 100%. And it often happens that there are many indicators, but in fact they are not used. Moreover, the online broadcast of two energetic guys, who “beautifully” convey all these senses from the stage, is becoming the main reason for the unconscious introduction. Or simply "it is fashionable."
Result: some indicators are going, like they are clear, but “how to use them all in practice?”.
I share a simple practical model with examples.
So, here are 2 typical problems in the market:
1) There is no business intelligence at all
2) BA is, but not used in practice
The whole point in the simple thesis is "the conscious understanding and application of analytics."
Catch examples:
1. History. One company with whom we worked engaged in the manufacture of blinds, worked a wide advertising front. One of the channels is TV advertising, which at one time produced brilliant results. As time went on, advertising and budgets grew. Grew company profits. And "out of habit" (keyword) - advertising continued to be placed on local channels.
We set up a business analyst - it became obvious that spending on TV does not correlate with profit growth, unlike in previous periods. That is, TV advertising simply “devoured” 100,000 rubles each monthly. And so it went on for 5-6 months.
Simply transferring the same budgets to the “context” with ROI (return on investment) of about 400% (each ruble invested 4 rubles) would have been an amazing result:
4 x 100,000 rubles = 400,000 rubles of revenue (every month).
Of course, there are nuances with the volume of requests for contextual advertising and there are a number of other criteria, and the result would be much better.
2 story. It's simple. As we grew 4 months in a row (from the history of our company).
1 month , start, first sales - 38,000 rubles of net profit.
2 month - 55 000 rubles
3 month - 119 000 rubles
4 month - 220 000 rubles
True, 5 month - 58 000 rubles
Although, this is simply because of laziness)) But, thanks to well-established business analytics, we have learned by numbers to identify only 20% of actions that give 80% of the result.
That is, with less workload, get more returns. The average time spent in 4 months of work is 16 working hours per week.
Otherwise, it is an opportunity to see and assess the situation not subjectively, at the level of intuition, but objectively, at the level of numbers.
The simplest, basic set of indicators for the analyst includes 5 main figures and their product, equal to the net profit of the enterprise (often EBITDA for the main indicator here (from the English. Earnings before interest, taxes, depreciation and amortization)), it is called "The main equation business. "

Number of calls - the total number of incoming calls, applications, company visitors for a selected period of time, for example, for 1 month. Example: 200 calls for January.
Conversion into transactions - the ratio of the number of customers who made payment in the company to the number of requests as a percentage, also for a selected period of time. It is important to note that customers who have already made purchases in a company outside the selected period of time are also among the first payments (if the customer has already completed the transaction in January and made it again in February, this is considered 1 payment).
Example: 60 first paid / 200 calls = 30% (conversion value).
The average check is the ratio of the amount of the company's revenue received during the reporting period to the number of all transactions over the same period of time. Example: 300 000 rubles / 90 transactions ~ 3 333 rubles.
The number of repeated purchases - the ratio of purchases (actual payments) again to the first payment within the selected period of time. Example: 60 purchases are perfect for the first time this month, 30 people purchased products again this month. The coefficient is 30/60 + 1 = 1.5.
Profitability -% of the total revenue of the company, representing net profit. Calculated: (revenue - (fixed + variable costs)) / revenue x 100%
Example: 200 (calls) x 30% (conversion) x 3 333 rubles (average bill) x 1.5 (repeat purchases) x 30% (profitability) = 89,991 rubles (net profit).
Influencing each digit separately, the net profit grows. For example, by adding additional items to the basket of an online store using the module “with this product they also take” - the average check has increased 2 times. With the same value of the other indicators and an average check of 6,666 rubles, the profit became equal to about 180,000 rubles.
As a result, it is much easier to do conscious, systemic targeted actions.
This basic model is universal and fits almost any company. The model is maximally simplified and divided into separate criteria, affecting each individual changes in the size of the company's net profit.
Many are familiar with this model, but for some reason, even such a simple system is not implemented in fact. Because the “yes I know that!” System is turned on.
3 story. Familiar to many. Right now, you, the reader of this article, have in your head a fan of great ideas, "hypotheses" and assumptions - and each of them is "sound."
But for one reason or another, these ideas are not realized.
- “It's time to start a normal site!”
- “It's time to implement CRM”
- “Where are our 2 new sales managers?”
And you very often postpone them. Why?
Because their business benefits are "not obvious." It is difficult to evaluate it in numbers.
1) Which of the 5 main indicators will affect your "hypothesis" when it will be executed (directly or indirectly)? To increase conversion, to increase the average check?
2) And what volume will the indicator change? How many hits will the site with contextual advertising? Complex issue? Then first answer or perplex the contractor.
Here is what it might look like:
In wordstate, 20,000 key requests x 5% CTR (average click-through rate of ads from experience) x 7% site conversion “from visitor to application” x 30% conversion “from application to transaction” x 10,000 rubles average check x 30% (business profitability ) = 63 000 rubles
Such a sum can potentially bring the launch of this hypothesis, on a monthly basis. Naturally, there is a cost of time and money to launch. Plus, the budget for clicks per month is deducted from the amount of profit. But now, according to this model, you can compare several models with each other. These calculations will take no more than 1 hour. But you can save a lot of time and money.
Now it will be much less “empty” actions, because now you have a certain “filter”. Make "the main equation of your business" at least for the last 3 months and you will "begin to see clearly."
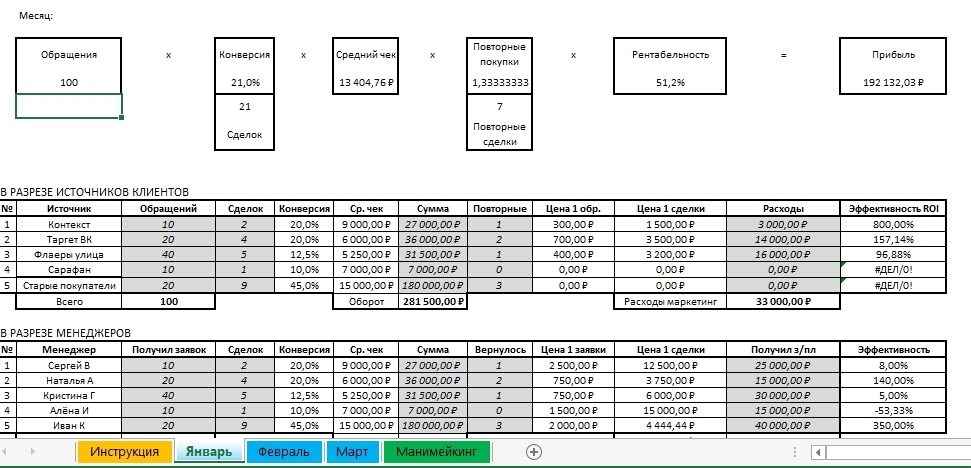
PS A more detailed file for basic analytics may look like this (in our company):
PPS From the experience of implementation, the most difficult indicator to take into account is to get the "Number of hits". If the topic is useful to you - in the next posts I will tell about it in more detail.
The story is fantastic, isn't it? Then why are 90% of companies moving absolutely and blindly? Counting only on intuition and without understanding what is really happening in the company?
')
Many founders, entrepreneurs and startups have heard about the essence and benefits of “digitizing” a business, the vision of key indicators. Many have heard and know about RoiStat, SmallData, BigData and so on.
But at the same time, either all this is not implemented, or is not used at 100%. And it often happens that there are many indicators, but in fact they are not used. Moreover, the online broadcast of two energetic guys, who “beautifully” convey all these senses from the stage, is becoming the main reason for the unconscious introduction. Or simply "it is fashionable."
Result: some indicators are going, like they are clear, but “how to use them all in practice?”.
I share a simple practical model with examples.
So, here are 2 typical problems in the market:
1) There is no business intelligence at all
2) BA is, but not used in practice
The whole point in the simple thesis is "the conscious understanding and application of analytics."
Catch examples:
1. History. One company with whom we worked engaged in the manufacture of blinds, worked a wide advertising front. One of the channels is TV advertising, which at one time produced brilliant results. As time went on, advertising and budgets grew. Grew company profits. And "out of habit" (keyword) - advertising continued to be placed on local channels.
We set up a business analyst - it became obvious that spending on TV does not correlate with profit growth, unlike in previous periods. That is, TV advertising simply “devoured” 100,000 rubles each monthly. And so it went on for 5-6 months.
Simply transferring the same budgets to the “context” with ROI (return on investment) of about 400% (each ruble invested 4 rubles) would have been an amazing result:
4 x 100,000 rubles = 400,000 rubles of revenue (every month).
Of course, there are nuances with the volume of requests for contextual advertising and there are a number of other criteria, and the result would be much better.
2 story. It's simple. As we grew 4 months in a row (from the history of our company).
1 month , start, first sales - 38,000 rubles of net profit.
2 month - 55 000 rubles
3 month - 119 000 rubles
4 month - 220 000 rubles
True, 5 month - 58 000 rubles
Although, this is simply because of laziness)) But, thanks to well-established business analytics, we have learned by numbers to identify only 20% of actions that give 80% of the result.
That is, with less workload, get more returns. The average time spent in 4 months of work is 16 working hours per week.
Now "meat"
The purpose of business intelligence is to interpret a large amount of data, focusing only on key performance factors, modeling the outcome of various options for action, and tracking the results of decision making in measured indicators.- Wikipedia
Otherwise, it is an opportunity to see and assess the situation not subjectively, at the level of intuition, but objectively, at the level of numbers.
The simplest, basic set of indicators for the analyst includes 5 main figures and their product, equal to the net profit of the enterprise (often EBITDA for the main indicator here (from the English. Earnings before interest, taxes, depreciation and amortization)), it is called "The main equation business. "
Number of calls - the total number of incoming calls, applications, company visitors for a selected period of time, for example, for 1 month. Example: 200 calls for January.
Conversion into transactions - the ratio of the number of customers who made payment in the company to the number of requests as a percentage, also for a selected period of time. It is important to note that customers who have already made purchases in a company outside the selected period of time are also among the first payments (if the customer has already completed the transaction in January and made it again in February, this is considered 1 payment).
Example: 60 first paid / 200 calls = 30% (conversion value).
The average check is the ratio of the amount of the company's revenue received during the reporting period to the number of all transactions over the same period of time. Example: 300 000 rubles / 90 transactions ~ 3 333 rubles.
The number of repeated purchases - the ratio of purchases (actual payments) again to the first payment within the selected period of time. Example: 60 purchases are perfect for the first time this month, 30 people purchased products again this month. The coefficient is 30/60 + 1 = 1.5.
Profitability -% of the total revenue of the company, representing net profit. Calculated: (revenue - (fixed + variable costs)) / revenue x 100%
Example: 200 (calls) x 30% (conversion) x 3 333 rubles (average bill) x 1.5 (repeat purchases) x 30% (profitability) = 89,991 rubles (net profit).
Influencing each digit separately, the net profit grows. For example, by adding additional items to the basket of an online store using the module “with this product they also take” - the average check has increased 2 times. With the same value of the other indicators and an average check of 6,666 rubles, the profit became equal to about 180,000 rubles.
As a result, it is much easier to do conscious, systemic targeted actions.
This basic model is universal and fits almost any company. The model is maximally simplified and divided into separate criteria, affecting each individual changes in the size of the company's net profit.
Now let's be honest
Many are familiar with this model, but for some reason, even such a simple system is not implemented in fact. Because the “yes I know that!” System is turned on.
3 story. Familiar to many. Right now, you, the reader of this article, have in your head a fan of great ideas, "hypotheses" and assumptions - and each of them is "sound."
But for one reason or another, these ideas are not realized.
- “It's time to start a normal site!”
- “It's time to implement CRM”
- “Where are our 2 new sales managers?”
And you very often postpone them. Why?
Because their business benefits are "not obvious." It is difficult to evaluate it in numbers.
Only 2 simple questions
1) Which of the 5 main indicators will affect your "hypothesis" when it will be executed (directly or indirectly)? To increase conversion, to increase the average check?
2) And what volume will the indicator change? How many hits will the site with contextual advertising? Complex issue? Then first answer or perplex the contractor.
Here is what it might look like:
In wordstate, 20,000 key requests x 5% CTR (average click-through rate of ads from experience) x 7% site conversion “from visitor to application” x 30% conversion “from application to transaction” x 10,000 rubles average check x 30% (business profitability ) = 63 000 rubles
Such a sum can potentially bring the launch of this hypothesis, on a monthly basis. Naturally, there is a cost of time and money to launch. Plus, the budget for clicks per month is deducted from the amount of profit. But now, according to this model, you can compare several models with each other. These calculations will take no more than 1 hour. But you can save a lot of time and money.
Now it will be much less “empty” actions, because now you have a certain “filter”. Make "the main equation of your business" at least for the last 3 months and you will "begin to see clearly."
PS A more detailed file for basic analytics may look like this (in our company):
PPS From the experience of implementation, the most difficult indicator to take into account is to get the "Number of hits". If the topic is useful to you - in the next posts I will tell about it in more detail.
Source: https://habr.com/ru/post/314764/
All Articles