Profiling PHP Applications With xdebug
Welcome to the third article on xdebug. Already now you should have tried xdebug, if not, do it today ;-).
The first article explained how to install and configure xdebug, described some simplest features, such as improving the output of the var_dump () function or outputting a call stack trace when an error message was received. In the second part, we looked at the possibility of xdebug as a trace. Trace contains all calls of functions and methods in the program, start time, optional memory size, transmitted and returned parameters. The trace log can help you understand the paths of a complex program. Instead of inserting the debugging code inside the program, you turn on or off the trace in the right place, and then use utilities like grep or the actual PHP applications to analyze the log file.
In this article we will look at profiling. Profiling at first glance looks like a trace. Profiling log does not intend for people, is not intended to visualize the flow of the program, but it provides us with data for statistical analysis of the running program.
Creating a profiling log
Below is a short excerpt from the profiling log created by xdebug:
As you can see, the profiling log is not possible to read directly. We will use additional tools to visualize and analyze the data. So, profiling shows how many times this or that line was run and how long it took to start.
Creating a profiling log greatly degrades performance, like creating a trace log, because you need to describe the passage of each line. Therefore, just like in the case of tracing, do not run profiling on the combat servers ... However, there are cases when the profiling needs to be run on the live system. In this case, be careful to run xdebug at the same time with other Zend extensions, such as bootloaders, optimizers, or caches.
In order for xdebug to start recording the profiling log add
Please note that you cannot run profiling during startup by running a command.
Since the profiling log is intended for reading by analyzer programs, there are no additional settings that allow you to display additional information, as in the case of the trace log. However, there are some settings that allow you to configure profiling, similar to those we used when setting up tracing.
First, by default xdebug writes a profiling log to the / tmp directory. If you are using Windows, you need to fix php.ini, like this:
By default, xdebug overwrites the existing profiling log. You can configure it to complement the existing one by adding the following command.
in php.ini. There are cases when you do not want to create a profiling log for all files, at the same time, activating profiling at run time is problematic. Instead of periodically turning profiling on and off, add the command
in php.ini. Now you can enable and disable profiling by passing the special GET or POST parameter XDEBUG_PROFILE to a PHP script. This will turn on profiling only for this PHP script. It is not necessary to set the value of this parameter; just remember to add this parameter to the test.php? XDEBUG_PROFILE address.
Profiling log name
The name that the default xdebug assigns to the profiling log "cachegrind.out." Is the process id. As in the case of the trace log, you can change the log names by adding the appropriate settings in php.ini. The name of the parameter xdebug.profiler_output_name. The argument is a string. which may contain various modifiers. Most important below:
Please note that the% s modifier is used only for xdebug.profiler_output_name. If you want to know the name of the profiling log, you can call the function xdebug_get_profiler_filename ().
Profiling log analysis
As mentioned above, additional programs for data visualization are needed to analyze the profiling log. All the profiling logs that xdebug creates are in a format similar to the Cachegrind format. Cachegrind is a profiler that is part of a more powerful program called Valgrind , a program for debugging and profiling software for Linux. Cachegrind was designed to analyze cache statistics, memory usage, and program commands. Another tool in the Valgrind program, Callgrind draws call graphs. With respect to PHP, we can use this application to visualize and analyze the profiling log.
The tool that is commonly used to analyze the profiling log created by xdebug is called KCachegrind . KCachegrind is free software licensed under the GPL (works only on Unix systems). However, there is a simple program for Windows - WinCachegrind , which is also free. Let's look first at the Windows version.
WinCacheGrind: analysis of profiling logs in Windows
The current version (at the time of writing by the author of this article) WinCachegrind - 1.0.0.12. This version is dated back to 2005, which suggests that WinCachegrind has not been developed for a long time. If you look at release notes for release notes, the authors write that there are errors in the program that sometimes make its behavior strange.
Therefore, I recommend using KCachegrind running on the basis of the virtual machine on the latest Linux distribution, for example Ubuntu (the translator’s note, generally speaking, is a strange recommendation, I would recommend simply installing Linux instead of making a fuss). There are a huge number of virtual machines available under Windows. If it is not possible to use Unix or a virtual machine for any reason, you can continue to use WinCachegrind for a simple profiling log analysis. WinCachegrind does not draw call graphs, unlike KCachegrind.
Installing Wincachegrind is extremely simple. Run the installer, click on the button to accept the license and the installation is complete. Now you can run the program, open one of the cachegrind profiling logs created by xdebug in it.

By clicking on the clock or sigma icon, you can switch between displaying information in absolute values and percentages. The percentage display shows how much time as a percentage of the total time it takes to call a function in a given block.
Two useful settings Profiler -> Hide Fast Functions and Profiler -> Hide Library Functions. The first switch hides the functions whose time contribution to the total program execution time is insignificant.
The second setting, Profiler -> Hide Library Functions, hides the built-in PHP functions from the general analysis. When both of these settings are enabled, you see less data, so you can focus on those parts of the code that need optimization.
The main window contains two tabs: Line by line and Overall. Both tabs show the same information, but the Overall tab aggregates information for a better view. Self time displays the start time of the code in the current block, while Cumulative time (Cum.) Shows the total run time of the functions in this block.
KCacheGrind: Unix profiling analysis
The Unix version of KCachegrind provides more functionality than WinCachegrind. KCachegrind visualizes the data and builds a call graph.
To start using, you must install KCachegrind. Current version 0.4.6 . A newer version (0.10.1) is available, however, it is part of the Valgrind package.
If possible, use the package manager to install the KCachegrind package. KCachegrind uses GraphViz to draw call graphs, so you must also install the GraphViz package if your package manager does not automatically install the dependent packages.
If you have not found the KCachegrind binary package, you need to compile KCachegrind yourself. After downloading the source, run
As you can note, you need to register the path to the current installation of the KDE library. If you don't know where the KDE libraries are on your system, use
to display the path to the KDE libraries.
After installation, you can run KCacheGrind from the command line.
Tabular display of data in KCachegrind is very similar to WinCachegrind. You can also switch between absolute and percentage values. Some features of KCachegrind are not intended for PHP. The picture below shows the call graph of the phpMyAdmin program:
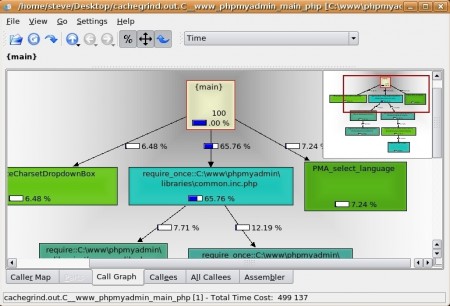
As you can see, most of the launch time was inside common.inc.php. The following screenshot shows the visualization of function calls inside common.inc.php:
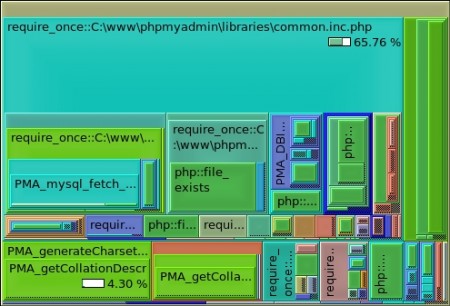
In this block of code, two require_once are run, which is half the time for starting common.inc.php. Clicking twice on any rectangle will bring you deeper into the data analysis.
Code optimization based on profiling data
Always profile your applications before optimization. You can start optimization yourself, in the place where it seems to you that this optimization will bring effect, but this is not always true. Optimization mainly has an effect only in those parts that take the most time in the implementation process.
If you run multiple copies of a program at the same time, you may still need to optimize that part of your program that takes up most of the execution time. In this case, optimization will not make servicing one individual request faster, but will allow your server to withstand a high load, consuming less resources for servicing such requests.
When you look at the launch duration according to the profiler data, keep in mind that absolute values are less important than relative values. Measured on different systems, absolute values may vary. However, before proceeding with code optimization, consider the following things.
An important rule in optimization is reducing the number of I / O operations. Some I / O operations take a lot of time compared to computations. Reducing such operations can be very effective by speeding up your program. Removing a single I / O call can result in more effective improvement than a bunch of hours of code optimization. Therefore, you must first focus on I / O operations before you proceed with the code.
Also before optimization you can increase the number of your servers. You can buy a huge, which will allow you to slightly increase productivity. Development time is more expensive than the price of a new server. And if you increase the amount of iron, you can be sure that you will get an increase immediately without any impact on the PHP code. When a developer spends one or two days on optimizing a code, you will never say how much productivity will increase. And in the end, you can no longer be sure that optimization will not bring any errors.
Converting some pages to static is one way to achieve greater performance. Suppose there is a site with a lot of traffic, where the PHP script for each request creates the first page by selecting information from a database or an XML file. If the data on the page is changed often enough, you can recreate its static copy. If the conversion to a static view is not possible for the page (some personal information is displayed on the page), you can convert some blocks to static.
Another level of optimization does not require changing PHP code. As we know PHP is an interpreted language. This means that his commands are translated at run time into an intermediate code. The translation is repeated every time the script is run. This makes PHP slower compared to languages like C or Java, which do not require parsing the code every time you start it. For PHP, you can use intermediate view caches (see my translation ....) to save and reuse intermediate code, this makes startup and execution faster.
All this does not mean that there is no time or place to optimize PHP code. Some code optimizations can greatly increase performance. However, always remember that changing the code always carries the risk of introducing additional errors and security issues. Also do not forget that code optimization makes it less readable.
Conclusion
Creating and visualizing a profiling log is one of the important conditions for optimizing PHP code. You need to know which places in the program require the most time, and it is there to start optimizing.
In the next article we will look at debugging using xdebug. xdebug can provide you with the ability for remote debugging. Using a client that implements this feature, for example, Eclipse PDT, you can debug your code without changing it, set breakpoints, jump through sections of code, look at how and where variables change values.
The first article explained how to install and configure xdebug, described some simplest features, such as improving the output of the var_dump () function or outputting a call stack trace when an error message was received. In the second part, we looked at the possibility of xdebug as a trace. Trace contains all calls of functions and methods in the program, start time, optional memory size, transmitted and returned parameters. The trace log can help you understand the paths of a complex program. Instead of inserting the debugging code inside the program, you turn on or off the trace in the right place, and then use utilities like grep or the actual PHP applications to analyze the log file.
In this article we will look at profiling. Profiling at first glance looks like a trace. Profiling log does not intend for people, is not intended to visualize the flow of the program, but it provides us with data for statistical analysis of the running program.
Creating a profiling log
Below is a short excerpt from the profiling log created by xdebug:
fl = php: internal
fn = php :: define
106 3
')
fl = C: \ www \ drupal \ includes \ bootstrap.inc
fn = require_once :: C: \ www \ drupal \ includes \ bootstrap.inc
1,648
cfn = php :: define
calls = 1 0 0
13 6
cfn = php :: define
calls = 1 0 0
18 4
cfn = php :: define
calls = 1 0 0
23 2
As you can see, the profiling log is not possible to read directly. We will use additional tools to visualize and analyze the data. So, profiling shows how many times this or that line was run and how long it took to start.
Creating a profiling log greatly degrades performance, like creating a trace log, because you need to describe the passage of each line. Therefore, just like in the case of tracing, do not run profiling on the combat servers ... However, there are cases when the profiling needs to be run on the live system. In this case, be careful to run xdebug at the same time with other Zend extensions, such as bootloaders, optimizers, or caches.
In order for xdebug to start recording the profiling log add
xdebug.profiler_enable = On
Please note that you cannot run profiling during startup by running a command.
Since the profiling log is intended for reading by analyzer programs, there are no additional settings that allow you to display additional information, as in the case of the trace log. However, there are some settings that allow you to configure profiling, similar to those we used when setting up tracing.
First, by default xdebug writes a profiling log to the / tmp directory. If you are using Windows, you need to fix php.ini, like this:
xdebug.profiler_output_dir = "c: \ traces"
By default, xdebug overwrites the existing profiling log. You can configure it to complement the existing one by adding the following command.
xdebug.profiler_append = On
in php.ini. There are cases when you do not want to create a profiling log for all files, at the same time, activating profiling at run time is problematic. Instead of periodically turning profiling on and off, add the command
xdebug.profiler_enable_trigger = On
in php.ini. Now you can enable and disable profiling by passing the special GET or POST parameter XDEBUG_PROFILE to a PHP script. This will turn on profiling only for this PHP script. It is not necessary to set the value of this parameter; just remember to add this parameter to the test.php? XDEBUG_PROFILE address.
Profiling log name
The name that the default xdebug assigns to the profiling log "cachegrind.out." Is the process id. As in the case of the trace log, you can change the log names by adding the appropriate settings in php.ini. The name of the parameter xdebug.profiler_output_name. The argument is a string. which may contain various modifiers. Most important below:
- % p - process ID
- % r is a random number
- % u - time
- % H - the value of $ _SERVER ['HTTP_HOST']
- % R - the value of $ _SERVER ['REQUEST_URI']
- % s - the name includes the full path, slashes are converted to underscores
Please note that the% s modifier is used only for xdebug.profiler_output_name. If you want to know the name of the profiling log, you can call the function xdebug_get_profiler_filename ().
Profiling log analysis
As mentioned above, additional programs for data visualization are needed to analyze the profiling log. All the profiling logs that xdebug creates are in a format similar to the Cachegrind format. Cachegrind is a profiler that is part of a more powerful program called Valgrind , a program for debugging and profiling software for Linux. Cachegrind was designed to analyze cache statistics, memory usage, and program commands. Another tool in the Valgrind program, Callgrind draws call graphs. With respect to PHP, we can use this application to visualize and analyze the profiling log.
The tool that is commonly used to analyze the profiling log created by xdebug is called KCachegrind . KCachegrind is free software licensed under the GPL (works only on Unix systems). However, there is a simple program for Windows - WinCachegrind , which is also free. Let's look first at the Windows version.
WinCacheGrind: analysis of profiling logs in Windows
The current version (at the time of writing by the author of this article) WinCachegrind - 1.0.0.12. This version is dated back to 2005, which suggests that WinCachegrind has not been developed for a long time. If you look at release notes for release notes, the authors write that there are errors in the program that sometimes make its behavior strange.
Therefore, I recommend using KCachegrind running on the basis of the virtual machine on the latest Linux distribution, for example Ubuntu (the translator’s note, generally speaking, is a strange recommendation, I would recommend simply installing Linux instead of making a fuss). There are a huge number of virtual machines available under Windows. If it is not possible to use Unix or a virtual machine for any reason, you can continue to use WinCachegrind for a simple profiling log analysis. WinCachegrind does not draw call graphs, unlike KCachegrind.
Installing Wincachegrind is extremely simple. Run the installer, click on the button to accept the license and the installation is complete. Now you can run the program, open one of the cachegrind profiling logs created by xdebug in it.
By clicking on the clock or sigma icon, you can switch between displaying information in absolute values and percentages. The percentage display shows how much time as a percentage of the total time it takes to call a function in a given block.
Two useful settings Profiler -> Hide Fast Functions and Profiler -> Hide Library Functions. The first switch hides the functions whose time contribution to the total program execution time is insignificant.
The second setting, Profiler -> Hide Library Functions, hides the built-in PHP functions from the general analysis. When both of these settings are enabled, you see less data, so you can focus on those parts of the code that need optimization.
The main window contains two tabs: Line by line and Overall. Both tabs show the same information, but the Overall tab aggregates information for a better view. Self time displays the start time of the code in the current block, while Cumulative time (Cum.) Shows the total run time of the functions in this block.
KCacheGrind: Unix profiling analysis
The Unix version of KCachegrind provides more functionality than WinCachegrind. KCachegrind visualizes the data and builds a call graph.
To start using, you must install KCachegrind. Current version 0.4.6 . A newer version (0.10.1) is available, however, it is part of the Valgrind package.
If possible, use the package manager to install the KCachegrind package. KCachegrind uses GraphViz to draw call graphs, so you must also install the GraphViz package if your package manager does not automatically install the dependent packages.
If you have not found the KCachegrind binary package, you need to compile KCachegrind yourself. After downloading the source, run
./configure --prefix = / opt / kde3
make
make install
As you can note, you need to register the path to the current installation of the KDE library. If you don't know where the KDE libraries are on your system, use
kde-config --prefix
to display the path to the KDE libraries.
After installation, you can run KCacheGrind from the command line.
opt / kde3 / bin / kcachegrind &
Tabular display of data in KCachegrind is very similar to WinCachegrind. You can also switch between absolute and percentage values. Some features of KCachegrind are not intended for PHP. The picture below shows the call graph of the phpMyAdmin program:
As you can see, most of the launch time was inside common.inc.php. The following screenshot shows the visualization of function calls inside common.inc.php:
In this block of code, two require_once are run, which is half the time for starting common.inc.php. Clicking twice on any rectangle will bring you deeper into the data analysis.
Code optimization based on profiling data
Always profile your applications before optimization. You can start optimization yourself, in the place where it seems to you that this optimization will bring effect, but this is not always true. Optimization mainly has an effect only in those parts that take the most time in the implementation process.
If you run multiple copies of a program at the same time, you may still need to optimize that part of your program that takes up most of the execution time. In this case, optimization will not make servicing one individual request faster, but will allow your server to withstand a high load, consuming less resources for servicing such requests.
When you look at the launch duration according to the profiler data, keep in mind that absolute values are less important than relative values. Measured on different systems, absolute values may vary. However, before proceeding with code optimization, consider the following things.
An important rule in optimization is reducing the number of I / O operations. Some I / O operations take a lot of time compared to computations. Reducing such operations can be very effective by speeding up your program. Removing a single I / O call can result in more effective improvement than a bunch of hours of code optimization. Therefore, you must first focus on I / O operations before you proceed with the code.
Also before optimization you can increase the number of your servers. You can buy a huge, which will allow you to slightly increase productivity. Development time is more expensive than the price of a new server. And if you increase the amount of iron, you can be sure that you will get an increase immediately without any impact on the PHP code. When a developer spends one or two days on optimizing a code, you will never say how much productivity will increase. And in the end, you can no longer be sure that optimization will not bring any errors.
Converting some pages to static is one way to achieve greater performance. Suppose there is a site with a lot of traffic, where the PHP script for each request creates the first page by selecting information from a database or an XML file. If the data on the page is changed often enough, you can recreate its static copy. If the conversion to a static view is not possible for the page (some personal information is displayed on the page), you can convert some blocks to static.
Another level of optimization does not require changing PHP code. As we know PHP is an interpreted language. This means that his commands are translated at run time into an intermediate code. The translation is repeated every time the script is run. This makes PHP slower compared to languages like C or Java, which do not require parsing the code every time you start it. For PHP, you can use intermediate view caches (see my translation ....) to save and reuse intermediate code, this makes startup and execution faster.
All this does not mean that there is no time or place to optimize PHP code. Some code optimizations can greatly increase performance. However, always remember that changing the code always carries the risk of introducing additional errors and security issues. Also do not forget that code optimization makes it less readable.
Conclusion
Creating and visualizing a profiling log is one of the important conditions for optimizing PHP code. You need to know which places in the program require the most time, and it is there to start optimizing.
In the next article we will look at debugging using xdebug. xdebug can provide you with the ability for remote debugging. Using a client that implements this feature, for example, Eclipse PDT, you can debug your code without changing it, set breakpoints, jump through sections of code, look at how and where variables change values.
Source: https://habr.com/ru/post/31468/
All Articles