Introducing xdebug
This article is the first in a series of articles describing xdebug , a free library for PHP developers. xdebug is an PHP extension written by Derick Rethans, one of the developers of the PHP language. This article describes how to install xdebug and describes its basic features. In the following parts, we take a closer look at the main features of xdebug, namely, tracing, profiling, debugging code.
Installing the xdebug extension
First of all, we need to install xdebug. When this article was written, xdebug was version 2.0.1. Since the PHP APIs may have changed, you must be sure that the version of xdebug is supported by the version of PHP you are using.
xdebug does not work with PHP versions below 4.3, and probably will not work with PHP 6. But this is not a big problem, since the PHP 4 branch ended its life at the end of 2007, and PHP 6 may not be released before the end of 2008.
Unix installation
')
Before diving into xdebug features, let's talk about installation. On Unix, you can try installing xdebug from the PHP extension library. This type of installation does not work on all systems. If this happens on your system, you must compile the xdebug extension from source. But first try installing from PECL:
As mentioned above, if the installation from PECL does not work on your system, you must compile xdebug from source. In addition to the C compiler, you must have the appropriate versions of the application to build (Autoconf, Automake, and Libtool). If you don’t have them, you need to install them ...
In addition, in PHP there are two necessary programs phpize and php-config, which are parts of PHP, they will also be needed for installation. If you have not compiled PHP from source, then you may need to install a development package (php5-dev).
Please note that phpize and php-config must match your version of PHP, so do not copy them into your system from another. When you have verified that all the necessary programs are present, you can download and compile xdebug:
The path to php-config may be different on your system. Depending on your Apache settings, you must copy xdebug.so to the correct directory. However, instead of copying a file, you can create a symbolic link to it.
Installation in Windows
If you are using Windows, you can copy the compiled DLL from xdebug.org. Select the PHP version you are using and click on the appropriate link.
I recommend saving the downloaded DLL in the directory for ext extensions.
Activation of the xdebug extension
Now you have a ready-made xdebug extension, which is either a shared object in Unix or a DLL in Windows. To activate it, you need to add an entry in php.ini.
The path to the directories in which the PHP and Apache extensions are located may be different on your system. Make sure you use absolute paths.
Please note that in the Windows example, we use zend_extension_ts, which means that the thread-safe extension is loaded, while for Unix, we load a non-thread-safe extension. Depending on the settings of your system, you must decide when you need a particular state. If you do not know in what mode your PHP is running, look at the Thread Safety tab in the output of the phpinfo () command.
You cannot download other Zend extensions to work with xdebug because they will use the same internal mechanism of the Zend engine, which can lead to problems. Not all Zend extensions work in conjunction with xdebug. It is preferable to use xdebug on the developer’s machine rather than on production due to severe limitations. An important rule is not to use other PHP extensions for debugging with xdebug.
Restarting your web server, because we changed php.ini, see the output of the phpinfo () command or run php -m on the command line. In each case, xdebug should be displayed twice, once as a PHP extension, another time as a Zend extension

Be careful when updating PHP with xdebug installed. If the internal APIs change in PHP versions, the new PHP version may not start or show strange errors. If this happens, temporarily disable xdebug, wait for a newer version of PHP and xdebug and enable xdebug again.
There are several switches in php.ini for configuring xdebug, most of them have reasonable defaults, so you don't have to worry about xdebug. We will review the most important configuration options.
Improved var_dump () output
Let's see, one of the most widely used debugging methods is calling the var_dump () function. There is nothing wrong with using var_dump (). I do it all the time. The obstacle is that in order to debug using this function, it is necessary to modify the program code.
xdebug provides an interesting alternative to using var_dump () for debugging purposes, we will look at this in future articles. But now you’ll be happy to hear that even xdebug improves the performance of your favorite var_dump debugger.
When the xdebug extension is loaded, the output of the var_dump () function automatically becomes much better to improve readability, the screenshot is shown below:
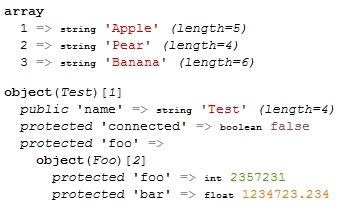
You can configure how xdebug should form the output of the var_dump () function using various settings in php.ini. First, you can change the length of the output string. The default value is 512; longer lines are cropped automatically.
Depending on whether or not to display the entire string, depends on the situation and the data you are working with. If you are working with large lines, the output of the var_dump () function may be too long and hard to read, so the idea of shortening the line looks pretty nice. In contrast, if you work with specific values, you most likely go to see the value completely.
To change the length of the string xdebug to display, add
Installing the xdebug extension
First of all, we need to install xdebug. When this article was written, xdebug was version 2.0.1. Since the PHP APIs may have changed, you must be sure that the version of xdebug is supported by the version of PHP you are using.
xdebug does not work with PHP versions below 4.3, and probably will not work with PHP 6. But this is not a big problem, since the PHP 4 branch ended its life at the end of 2007, and PHP 6 may not be released before the end of 2008.
Unix installation
')
Before diving into xdebug features, let's talk about installation. On Unix, you can try installing xdebug from the PHP extension library. This type of installation does not work on all systems. If this happens on your system, you must compile the xdebug extension from source. But first try installing from PECL:
pecl install xdebug
As mentioned above, if the installation from PECL does not work on your system, you must compile xdebug from source. In addition to the C compiler, you must have the appropriate versions of the application to build (Autoconf, Automake, and Libtool). If you don’t have them, you need to install them ...
In addition, in PHP there are two necessary programs phpize and php-config, which are parts of PHP, they will also be needed for installation. If you have not compiled PHP from source, then you may need to install a development package (php5-dev).
Please note that phpize and php-config must match your version of PHP, so do not copy them into your system from another. When you have verified that all the necessary programs are present, you can download and compile xdebug:
wget xdebug.org/link.php?url=xdebug201
tar -xzf xdebug-2.0.1.tgz
cd xdebug-2.0.1
phpize
./configure --enable-xdebug --with-php-config = / usr / bin / php-config
make
cp modules / xdebug.so /usr/lib/apache2/modules/xdebug.so
The path to php-config may be different on your system. Depending on your Apache settings, you must copy xdebug.so to the correct directory. However, instead of copying a file, you can create a symbolic link to it.
Installation in Windows
If you are using Windows, you can copy the compiled DLL from xdebug.org. Select the PHP version you are using and click on the appropriate link.
I recommend saving the downloaded DLL in the directory for ext extensions.
Activation of the xdebug extension
Now you have a ready-made xdebug extension, which is either a shared object in Unix or a DLL in Windows. To activate it, you need to add an entry in php.ini.
For Windows: zend_extension_ts = "c: \ php \ ext \ php_xdebug-2.0.1-5.2.1.dll"
For Unix: zend_extension = "/ usr / lib / apache2 / modules / xdebug.so"
The path to the directories in which the PHP and Apache extensions are located may be different on your system. Make sure you use absolute paths.
Please note that in the Windows example, we use zend_extension_ts, which means that the thread-safe extension is loaded, while for Unix, we load a non-thread-safe extension. Depending on the settings of your system, you must decide when you need a particular state. If you do not know in what mode your PHP is running, look at the Thread Safety tab in the output of the phpinfo () command.
You cannot download other Zend extensions to work with xdebug because they will use the same internal mechanism of the Zend engine, which can lead to problems. Not all Zend extensions work in conjunction with xdebug. It is preferable to use xdebug on the developer’s machine rather than on production due to severe limitations. An important rule is not to use other PHP extensions for debugging with xdebug.
Restarting your web server, because we changed php.ini, see the output of the phpinfo () command or run php -m on the command line. In each case, xdebug should be displayed twice, once as a PHP extension, another time as a Zend extension
Be careful when updating PHP with xdebug installed. If the internal APIs change in PHP versions, the new PHP version may not start or show strange errors. If this happens, temporarily disable xdebug, wait for a newer version of PHP and xdebug and enable xdebug again.
There are several switches in php.ini for configuring xdebug, most of them have reasonable defaults, so you don't have to worry about xdebug. We will review the most important configuration options.
Improved var_dump () output
Let's see, one of the most widely used debugging methods is calling the var_dump () function. There is nothing wrong with using var_dump (). I do it all the time. The obstacle is that in order to debug using this function, it is necessary to modify the program code.
xdebug provides an interesting alternative to using var_dump () for debugging purposes, we will look at this in future articles. But now you’ll be happy to hear that even xdebug improves the performance of your favorite var_dump debugger.
When the xdebug extension is loaded, the output of the var_dump () function automatically becomes much better to improve readability, the screenshot is shown below:
You can configure how xdebug should form the output of the var_dump () function using various settings in php.ini. First, you can change the length of the output string. The default value is 512; longer lines are cropped automatically.
Depending on whether or not to display the entire string, depends on the situation and the data you are working with. If you are working with large lines, the output of the var_dump () function may be too long and hard to read, so the idea of shortening the line looks pretty nice. In contrast, if you work with specific values, you most likely go to see the value completely.
To change the length of the string xdebug to display, add
xdebug.var_display_max_data =
in php.ini and restart your web server. Alternatively, you can change this setting in your script using the ini_set function, you can addini_set ('xdebug.var_display_max_data',);
at the beginning of your script. Make sure that the ini_set call is before the first var_dump () call. The xdebug configuration at runtime saves you from restarting the web server every time you change php.ini and allows you to configure it more flexibly.
You can also control the number of elements in the array and the properties of the objects that xdebug will output. This can be achieved by modifying xdebug.var_display_max_children (default value 128). This value will be quite enough to display the properties of your object, but if you work with arrays, it may be necessary to increase the value ...
If you work with nested objects or arrays, you can modify xdebug.var_display_max_depth. This setting has a default value of 3, which means that three dimensions are displayed in the array and three levels of nesting in the object.
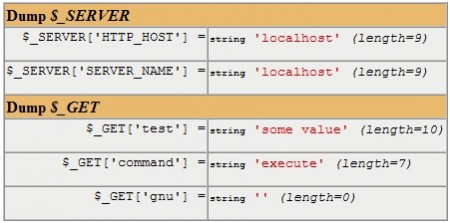
You can also output the superglobal variable values using the xdebug_dump_superglobals () function. Since superglobal arrays, especially $ _SERVER, are arrays containing a large number of values, you must explicitly tell xdebug which key of the array you want to see. To do this, install xdebug.dump., Where it is one of the following names GET, POST, SERVER, COOKIE, FILES, REQUEST or SESSION. Use the keys of the arrays that you want to output with xdebug as arguments, if you want to display several values, then list them with a comma. You can use * as a template for displaying keys, which can be especially useful for outputting $ _GET and $ _POST.
Useini_set ('xdebug.dump.SERVER', 'HTTP_HOST, SERVER_NAME')
in your PHP script or xdebug.dump.SERVER = HTTP_HOST, SERVER_NAME settings in php.ini to display the values $ _SERVER ['HTTP_HOST'] and $ _SERVER ['SERVER_NAME']. To display all the GET values that were passed to the script, usexdebug.dump.GET = *
By default, xdebug does not display undefined variables. To still display undefined variables, set the xdebug.dump_undefined parameter to On. I suggest setting this parameter to on.
More beautiful error messages
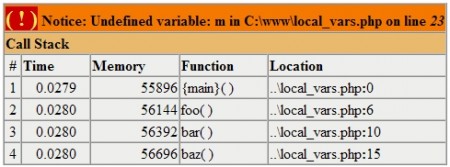
xdebug also improves the display of errors in PHP by automatically displaying a call stack next to each error message or warning. This call list displays the call history of functions until an error message appears. While PHP programs are becoming more and more object-oriented, errors most often occur deep inside libraries. The call list will allow you to quickly find the piece of code in which the error occurred, and from where this piece was called.
Since PHP 5.0, the debug_print_backtrace () function has appeared in PHP, which displays a list of function calls, but you cannot call this function explicitly whenever an error occurs, which means you need to create your own error handler. The call list created by xdebug is easy to read, in contrast to the output of PHP functions.
Like PHP, xdebug displays errors only when the display_erorrs parameter is set to On in php.ini.
Look at this call list, you will see that the function foo () was first called, then bar (), then baz (). In addition to the names of the called functions and the location in the source code, xdebug displays the time and amount of memory used by the script at the time of calling these functions.
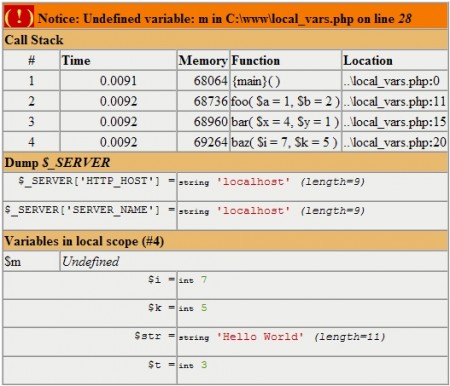
Above, we have already learned how to configure xdebug to display the values of superglobal variables. In addition, you can configure xdebug to display the current values of local variables. In order to display the values of local variables when an error message occurs, add the following linexdebug.show_local_vars = 1
in php.ini. You can also use ini_set.
So the php.in xdebug.var_display_max_data, debug.var_display_max_children and xdebug.var_display_max_depth parameters that we used above to format the output of the var_dump () command also affect the error output format.
Using the xdebug.collect_params parameter, you can customize the display of information about the parameters that are passed to the functions. xdebug.collect_params has a numeric value: 0 means no information, and 4 means displaying the names of variables and complete information on all parameters of the functions. Values from 1 to 3 are also available, meaning different granularities in the output of debug information.
Here is the configuration used to display the screenshot:xdebug.show_local_vars = On
xdebug.dump.SERVER = HTTP_HOST, SERVER_NAME
xdebug.dump_globals = On
xdebug.collect_params = 4
Please note that the more information you ask xdebug to collect for you, the more memory it will consume, and the longer the execution time will be. Make sure you use xdebug for development purposes only, and not on combat servers. It is wrong to use error messages in HTML format on the combat servers, it is not good to output information on the login and password to the database if you have not defined the variable .
While superglobals do not change at runtime (the translator’s note is a strange statement, I saw quite a few scripts that changed them, but we will not discuss this in the context of this article), xdebug displays them by default only at the time of the first message about the error. If you want to repeat their output every time, use the following setting.xdebug.dump_once = Off
I draw your attention to the fact that extended error reporting does not work if you define your own error handler using register_error_handler (), everything happens because xdebug uses the same internal mechanism. If you want to use your own error handler, you can use the xdebug_get_function_stack () function to display a function call list.
The object-oriented approach uses exceptions. Since exceptions are not errors, xdebug does not output a list of calls if an exception has occurred, except when such an exception is not intercepted. An uncaught exception is a fatal error. To see the function call when exceptions occur, usexdebug.show_exception_trace = On
Recursion limit
Another useful feature is the restriction of recursion steps, which prevents an endless sequence of recursive calls.
xdebug prevents endless recursion by stopping the script at a predefined step. In principle, this is a limit to the size of the call stack. The default value of this parameter is 100, and this feature is enabled by default. You can change the setting if your program means deeper recursion.xdebug.max_nesting_level =
However, xdebug does not prevent infinite for, while, and similar loops, since they do not increase the call stack. In addition, you can use the counter inside each cycle and kill the script whenever the counter value exceeds the allowed number. I advise you to use this approach on combat servers, because there should not be endless cycles.
Conclusion
xdebug is a small but very useful PHP developer tool, it should be installed on every PHP installation used for development. You should not use xdebug on combat servers, as this interferes with performance.
The next article will be devoted to Tracing PHP Applications with xdebug and will be translated somewhere later this week.

Source: https://habr.com/ru/post/31452/
All Articles