Software Cost Estimation: Dan Galloth and SEER-SEM
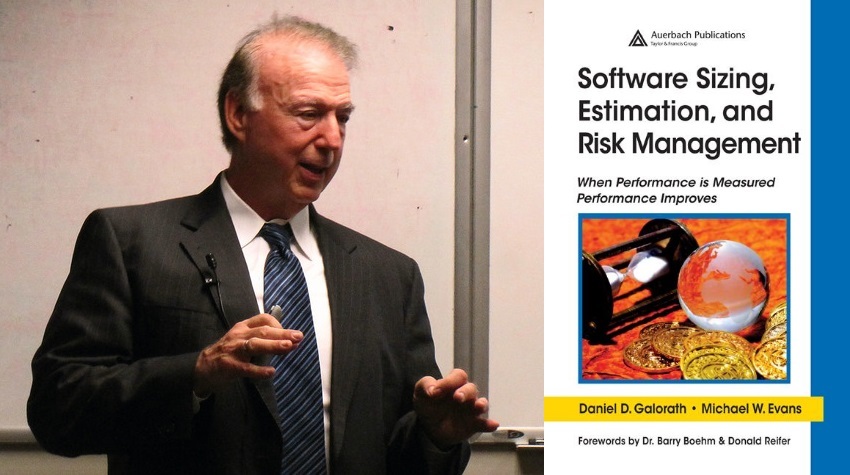
Daniel D. Galorath is President and CEO of Galorath Incorporated and Senior Developer of SEER-SEM, a project management software solution.
He is considered an expert in software evaluation and the author of Software, Evaluation and Risk Management (Software Sizing, Estimation, and Risk Management).
')
“The book helps determine the best way to invest in improving software performance.”
- Berry Boeham, author of the spiral model and COCOMO
Biography
Dan Galorath studied at the University of California, from which he graduated in 1980 with a degree in management. After university, Galorat worked in software development. His first attempt at developing software evaluation programs was to collaborate with Don Reifer on software Softcost for NASA's Jet Propulsion Laboratory. This program was used throughout the 1980s and is considered one of the progenitors of modern software evaluation systems.
In 1984, Dan Galorath became a consultant at Computer Economics, Inc. (CEI), where he became acquainted with the modifications of Rendell Jensen (Dr. Randall Jensen) model Putnam. Although the modifications clearly improved the model, they were not suitable for commercial use. For CEI, Galorat has developed a more user-friendly software evaluation program, the so-called CEI System-3.
In 1998, Dan's company Galorath Inc. formed the SEER Technology Department, in which Galorat became the leading developer of the platform, subsequently named SEER-SEM.
The resulting software product used CEI System-3, base of precedents and a graphical interface. These improvements allowed project managers to use SEER-SEM to improve the assessment of their program requirements.
Since that time, Galorat and his company have made many improvements to the original version of SEER-SEM, adding a library containing examples of the implementation of thousands of different projects. As a result, companies from various industries began to use the program, for example, aircraft manufacturers Lockheed Martin and Northrup Grumman, Siemens electronics, and even the US Department of Defense.
In 2009, Galorat received an award from the Society for valuing and analyzing value for his services in the field of parametric modeling of price, graphics, risk, reliability, and maintenance of software.
Projects
JPL Softcost
Softcost was originally developed for NASA's Jet Propulsion Laboratory and is considered one of the first software evaluation models. In accordance with the name of the method, it gave accurate forecasts of time and price, but was later replaced by JPL due to the lack of a risk assessment option.
CEI System-3
As a consultant, Galorat developed System-3. Basically, the model was based on the work of Rendell Jenson on the modification of the Putnam model. Some features of both models were similar, for example, uncertain possibilities for estimating the minimum amount of time. CEI's System-3 has significantly increased the possibilities of using the Jenson model, opening up access to the market for paid services in evaluating project implementation.
SEER-SEM
The initial version of SEER-SEM consisted of 22 thousand lines of code and worked only on Windows 2.0. The current version has grown to 200 thousand lines of code, allows you to work with Microsoft Project and IBM Rational. Current SEER modifications are widely used in various fields of activity: banking, automotive, aircraft manufacturing, electronics manufacturing, and also used by the US Department of Defense. The program deals with all aspects of software development: timing, labor intensity, cost, risk.
SEER-SEM
System for event evaluation and review - method, system of (expert) assessments and review of events.
SEER for software - SEER SEM - is an algorithmic project management application designed specifically to evaluate, plan and monitor the efforts and resources required to develop and / or maintain software.
SEER, which means “visionary” in English, is based on parametric algorithms, accumulated knowledge, simulation of probabilities and historical precedents, which allows project managers, engineers and price analysts to accurately determine the cost and duration of the project, the associated risks and the necessary efforts to start a project .
Story
Predecessors
- 1966 - the system model of corporate development.
- 1980 - a study by Don Reifer and Dan Galorath, which led to the creation of the JPL Softcost model. This model, being an early example of software evaluation, made it possible to analyze risks automatically. Subsequently, Softcost became the commercial product of Reifer Consultants.
- 1984 Galorat developed System-3 based on the Jensen-2 model (Computer Economics JS-2).
System-3 and other modeling systems, such as Barry Boehme’s COCOMO and Doty Associates ’early work, directly and indirectly contributed to the development of its software by Galorat in the late 1980s.
Version 1.0
In 1998, Galorath Incorporated began work on the initial version of SEER-SEM, which on completion consisted of about 22 thousand lines of code. SEER-SEM version 1.0 was released on thirteen 5-inch diskettes and was one of the first programs running on Windows 2. Developing SEER-SEM under Windows was considered a risky decision, since this operating system still had to prove itself to be a viable competitor of Microsoft’s MS-DOS at the time. Time has shown that this was the right decision, because SEER-SEM could boast an intuitive user interface. Gelorat chose Windows because it allowed to demonstrate the main stages and dynamics of projects development.
Next versions
After the release of the first version in 1988, SEER-SEM was repeatedly updated to meet new technologies, its consumer qualities and forecast accuracy improved. For example, version 4.0, released in 1994, included an improved mathematical model that worked with projects in real time, and not just with the Rayleigh approximation curve, as well as many other developments, including recent advances in software and program complexity indicators. .
In 2003, such important functions as goal setting and risk management were added.
Version 6.0 already allowed to import and export data from SEER to various Microsoft software products, for example, to Excel.
Version 7.0 allows you to better manage projects, increasing their potential.
Present tense
SEER version 7.3 is a much more advanced tool than its earlier versions. The size of the program has grown to 200 thousand lines of code. Now it is not just a tool for estimating the complexity of the work to be done using parametric modeling, but a system that calculates the probability using the method of constructing simulation models, including on the basis of more than 20 thousand similar precedents.
SEER has specifications:
- SEER for information technology - SEER-IT - version to help IT-specialists in evaluating the development, creation and maintenance of information systems infrastructure and service project management;
- SEER for equipment, electronics and systems - SEER-H - version for estimating the cost of equipment, taking into account its shelf life;
- SEER for production - SEER-MFG is a version adapted for estimating production costs, using extensive data on cutting-edge practical advances in manufacturing processes.
Users
SEER for software is used by thousands of licensed users, including large companies in the field of aviation, banking, financial, insurance and manufacturing. For example, among the company's customers listed
Bank of America, Boeing, Ford Motor Company, Lockheed Martin, National Oceanic and Atmospheric Administration, Northrop Grumman, Siemens, Raytheon and the United States Department of Defense.
Technical details
SEER for software (SEER-SEM) is designed to work in the Windows environment, and since version 6.0 it is fully adapted to interact with Microsoft Office. The application programming interface relies on Microsoft Automation. The program itself is written in C and C ++.
Model groups
SEER-SEM consists of groups of models, the coordinated work of which allows us to estimate the scope of work, duration, staffing and shortcomings of the project. These models can be briefly described with questions to which they respond:
- Size : what is the estimated scope of the project (number of lines of code, scoring functional evaluation, use cases)?
- Technology : what is developer productivity (capabilities, tools, experience, etc.)?
- Calculation of the volume and timing : how much work? How long does it take to complete a project? What will happen to the project when limiting or reducing the time and / or staff?
- Distribution of duties : how will labor responsibilities be distributed?
- Cost Estimation : Given a given scope of work, the duration of the project and the distribution of responsibilities, how much will its implementation cost?
- Assessment of deficiencies : given the type of product, project duration and other information, what is the expected quality of the final product?
- Service Cost Estimation : How much effort will be required to adequately maintain and update this computer system?
- Progress : how are the current results of the project implementation evaluated, given the time frame?
- Justification : Is it possible to implement the project using available technologies?
Determination of software size
Sizing software is a key parameter of any evaluation model . The metric includes the number of lines of program code (SLOC), function points , etc., and is transformed into an internal program indicator (
 ), which allows for an analysis of the process of developing a new or ready-for-use code. In general, the calculation is as follows:
As stated above,
increases in direct proportion to the number of new software, as well as depending on the amount of work on redesign, reuse and recheck.Determining the number of function points
Although determining the number of lines of code is a proven method of evaluation, measuring the number of function points can greatly improve the accuracy of the forecast.
The SEER-SEM model not only amends in accordance with the features of a programming language, but also takes into account such factors as the evaluation phase, the operating environment, the type of application and its complexity. The entropy index ranges from 1.04 to 1.2, depending on the type of software being developed.

Calculation of labor and time
The model takes into account the interrelation of the labor intensity and the project deadlines according to the following formula:

Where,
- the size given earlier; - technology efficiency - a composite indicator that reflects the productivity or efficiency of people, processes involved in the development of the project.
 - the degree of integration of employees - an indicator of the complexity of the project in terms of the number of people involved.
 - entropy
When the indicator of labor intensity is received, the following terms are determined:

It is seen that with increasing complexity of the project, the timing of its implementation increases, but not in proportion (^ 0.4).
Sources
Source: https://habr.com/ru/post/314100/
All Articles