Required RMM monitors: how to detect incidents before they become problems in the IT network
Availability of remote access tools is not enough for effective IT network management. To detect problems on endpoints in time, a remote monitoring system is needed.

Problem: it is often too late
It is quite obvious that nowadays companies are more dependent on IT than before: email programs and applications that directly affect employee productivity, financial data stored on servers, the loss of which can negatively affect a company's reputation, etc.
Unfortunately, in many small and medium-sized enterprises (let's hope that in very large organizations this is no longer the case!) IT departments work reactively, but not in the sense of their “reactive” work speed, but in the sense that they react to certain IT events as they occur. Those. when something has already happened, and this something has already had a negative impact on the work of this or that computer, and, consequently, of the employee (or even the company).
It turns out that if an employee of your IT department received a call or a letter from another employee of your enterprise (or from a client, if you are servicing their PC) with information that a server is unavailable or some PC is not working correctly, then it indicates that it is already getting late, because the efficiency of the company is already decreasing, and the damage from idle / reduced productivity begins to grow. And, most likely, the problem is hardly serious, and it is eliminated quickly enough, but now if we knew about it in advance ... That, as they say, “would live in Sochi”.
If you find out in time about the appearance of the problem (at the initial stage it may still not be noticeable to end users), then you can prevent the incident or at least reduce the damage. And with this, monitoring systems can help you to track the performance of your IT systems so that you can detect incidents before they become problems.
Solution: complete monitoring system
As a solution to this problem, we propose to see how it is solved using the Panda Systems Management cloud RMM service. Its monitoring system as a whole allows you to automatically report on the possibility of problems, monitoring the operation of the device and reporting it using alerts, information panels, schedules, tickets, etc. All this allows you to detect incidents beforehand and efficiently manage time, automatically assigning the incident to the appropriate IT specialist and documenting all actions. This is the only way to reduce response time and prevent serious problems that could adversely affect a company's performance and finances.
What we will tell you today in this article:
- What are monitors and monitoring policies
- What monitors are already available / recommended and how can they be imported
- Manual and automatic creation of monitors for devices that support the installation of the Panda Systems Management agent
- Special monitors for SNMP-compatible devices and ESXi servers
What are monitors
Today we will not consider the entire monitoring system as a whole, but will focus only on the so-called monitors - the main components of the system, which allow you to “keep abreast” and monitor the values of all necessary parameters on monitored devices.
Monitors monitor attributes, processes and events on the devices on which they are deployed, and raise an alarm if the device stops working within the specified parameters.
Monitors can be applied to a single device, to the entire site (a group of devices, some company division or the entire company) and / or to the entire account (consists of many sites) as part of the monitoring policy, or applied to any selected group of devices at any level .
A monitoring policy is a way to apply one or more monitors to different devices within a site, group, sample, or to all devices in an account.
• Monitoring policies can be configured at the account or site level.
• Monitoring policies can be exported or imported when information on configured monitors and trigger threshold parameters, as well as their severity level, is transmitted.
As a result, after setting up monitors on users' devices, the system will warn you about abnormal situations and, depending on the settings, automatically run the required scripts to solve the problem.
The monitor consists of four groups of parameters:
• Monitor type: sets its function.
• Monitor Details: monitor parameters that describe the conditions when the trigger should trigger to trigger certain automatic actions.
• Response: automatic actions that can be triggered by the monitor. Currently, two types of actions are supported:
- launch the required component
- sending emails
• Ticket: generating a ticket (contacting the IT department about the incident)
Monitors can be generated automatically or manually.
You can register a trial version of Panda Systems Management on the website for free and test the service in your IT environment.
How to quickly implement the solution in your IT environment can be found in our previous review article .
Import of recommended monitors
Fortunately for many administrators, you already have ready-made monitors at your disposal, which were created by Panda Security based on the best practices used in “combat” conditions. So you can safely import them :
These monitors will help you significantly speed up the process of setting up the entire monitoring system, allowing you to monitor a wide range of devices and servers.
Below is a table with a list of available monitors and supported products.
| Monitor name | Controlled Products | Size, KB | Description |
|---|---|---|---|
| Monitoring Policy Backup Monitoring | Symantec Backup Exec, Microsoft Windows Backup, Storagecraft, ArcServe, Microsoft Small Business Server, Acronis, Veeam | 2.6 | Controls the “Application” tab in Event Viewer, looking for messages with “Critical”, “Error” or “Warning” event levels for processes belonging to supported backup systems: Backup Exec, NTBackup, ShadowProtectSvc, Microsoft-Windows-Backup, ArcServ, SmallBusinessServer , Windows Backup, Veeam MP, Acronis Backup Agent Core |
| Monitoring Policy DHCP Server Monitoring | DHCP IP service | 1.0 | Controls the System and Application tabs in Event Viewer, looking for messages with the Critical, Error, or Warning event levels generated by the Microsoft-Windows-DHCP-Server process. Determines if the dhcpserver service is stopped for more than 1 minute, and tries to start it automatically. |
| Monitoring Policy DNS Server Monitoring | DNS Domain name service | 1,3 | Controls the System tab in Event Viewer, looking for messages with the Critical, Error, or Warning event levels generated by the Microsoft-Windows-DNS-Server-Service, DnsApi, and DNS processes. Determines if DNS service is stopped for more than 1 minute, and tries to start it automatically. |
| Monitoring Policy Domain Controller Monitoring | Domain controller servers | 2.1 | Controls the System tab in Event Viewer, looking for messages with the Critical, Error or Warning event levels, and with the 1955 event codes for the following processes: NTDS, Microsoft-Windows-GroupPolicy, Microsoft-Windows-Security- Auditing, NPS, Active Directory and DFSR. Determines if the ntds service is stopped for more than 1 minute, and tries to start it automatically. |
| Monitoring Policy Exchange Server Monitoring | Exchange mail server | 6 | Monitors the System and Application tabs in Event Viewer, looking for messages with the Critical, Error or Warning event levels for the following processes: MSExchangeIS, MSExchangeAL, MSExchangeMGMT, MSExchangeSA, MSExchangeTransport, POP3Svc, UMCore, SMTPSVC and ClusSvc . Detects if MSExchangeES, MSExchangeIS, MSExchangeMGMT, IMAP4Svc, MSExchangeMTA, POP3Svc, RESvc, and MSExchangeSA services are stopped for more than 1 minute and tries to start automatically. |
| Monitoring Policy Hyper-V Server Monitoring | Hyper-V virtual machine server | 3.7 | Controls the System and Application tabs in Event Viewer, looking for messages with the Critical, Error, or Warning event levels for the following processes: Microsoft-Windows-Hyper-V-VmSwitch, Microsoft-Windows-Hyper-V -VID-Admin, Microsoft-Windows-Hyper-V-HyperVisor-Admin, Microsoft-Windows-Hyper-V-Config-Admin, Microsoft-Windows-Hyper-V-VMMS-Admin, vmicheartbeat, vmickvpexchange, vmicrdv, vmicshutdown, vmictimesync and vmicvss. Determines if the vmms service is stopped for more than 1 minute, and tries to start it automatically. |
| Monitoring IIS Webserver Monitoring | IIS Web server | 1.0 | Monitors the System and Application tabs in Event Viewer, looking for messages with the Critical, Error, or Warning event levels for the W3SVC and Microsoft-Windows-IIS processes. Determines if the W3SVC service is stopped for more than 1 minute, and tries to start it automatically. |
| Monitoring Policy Linux Monitoring | Devices with Linux operating system | 0.9 | Controls the consumption of CPU and memory on the device, carrying out a search for the consumption level of 95% and higher for 10 minutes or more. Determines if the device is offline for more than 5 minutes. |
| Monitoring Policy Mac OSX Monitoring | Mac OS X Devices | 0.7 | Controls the consumption of the CPU on the device, searching for a consumption level of 95% and higher for 10 minutes or more. Controls the memory consumption on the device by searching for the consumption level of 95% and higher for 20 minutes or more. |
| Monitoring Policy Physical Server Monitoring | Servers with Microsoft Windows installed | 8.2 | Controls the System and Application tabs in Event Viewer, looking for messages with the Critical, Error or Warning event levels for the following processes: APCPBEAgent, Compaq, cpq, DELL Open Manage Server, Foundation Agents, HP, NIC Agents, pedge, perc, Server Administrator, Server Agents, Storage Administrator, Adaptec Storage Manager agent, acpi, adpu, afamgt, Disk, Ntfs, ServeRAID Manager Agent, SysMgmt, UPS, vxio, iScsiPrt, Dell Baseboard Agent, HPQILO2, HP Storage Server Management Service, Dell? Application Update, Dell? System Update and Cissesrv. |
| Monitoring Policy SQL Server Monitoring | Microsoft SQL Server servers | 1.1 | Controls the System and Application tabs in Event Viewer, looking for messages with the Critical, Error, or Warning event levels for the following processes: MSSQLServer. Determines if the MSSQLServer and SQLAgent% services are stopped for more than 1 minute, and tries to start them automatically. |
| Monitoring Policy Terminal Server Monitoring | Terminal server | 2.2 | Controls the System and Application tabs in Event Viewer, looking for messages with the Critical, Error or Warning event levels for the following processes: Citrix, Microsoft-Windows-Terminal-Services-RemoteConnectionManager, Microsoft-Windows-Terminal-Services-RemoteConnectionManager , TermService and TermServLicensing. Determines if TermService services are stopped for more than 1 minute, and tries to start them automatically. |
| Monitoring Policy Windows Server Monitoring | Servers with Microsoft Windows installed | 7.5 | Controls several parameters on the main server type: Controls the System tab in Event Viewer, looking for messages with the Critical, Error or Warning event levels for the following processes: Microsoft-Windows-FailoverClustering, Srv, ClusSvc, Microsoft-Windows-FailoverClustering, W32Time, Windows Product Activation , Microsoft-Windows-SystemHealthAgent and Microsoft-Windows-RestartManager. Monitors the System tab in Event Viewer, looking for messages with Event Critical, Error, or Warning levels and with the description “failed terminated” for Service Control Manager. Determines if the W32time, NetLogon, RPCSS, Spooler, DnsCache, and Eventlog services are stopped for more than 1 minute and tries to start them automatically. Controls the System tab in Event Viewer, searching for messages with event code 6008 for the Eventlog process. Controls the System tab in Event Viewer, searching for messages with event code 1995 for the NTDS process. Controls the System tab in Event Viewer, searching for messages with event code 1000 for Save Dump. Controls the System tab in Event Viewer, searching for messages with event code 5719 for the NETLOGON process. Monitors device performance: CPU consumption (95% over 25 minutes), memory consumption (100% over 15 minutes), free disk space on the storage system (up to 5 GB for more than 10 minutes), and alerts if the storage capacity exceeds 92% on any device for more than 10 minutes. Determines if the device is offline for more than 10 minutes. |
| Monitoring Policy Windows Workstation Monitoring | Computers (workstations) with Microsoft Windows installed | 3.0 | Determines if the RPCSS, NETLOGON, W32Time, DNSCache, Spooler, and Eventlog services are stopped for more than 5-10 minutes, and tries to start them automatically. Controls the System and Application tabs in Event Viewer, looking for messages with the Critical, Error, or Warning event levels for the following processes: Windows Product Activation. Monitors and alerts if storage capacity exceeds 92% on drive C for more than 5 minutes. |
How to import a monitor
To do this, you must perform a number of simple actions:
- Download the required monitor from the page.
- Go to the Panda Systems Management management console.
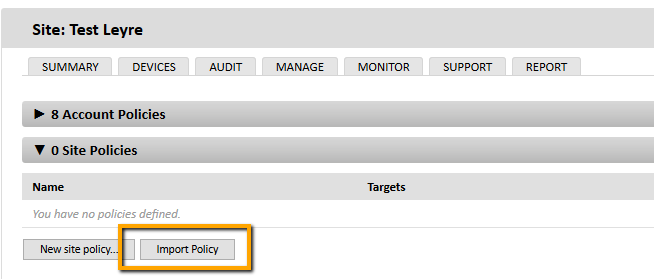
- Go to Account → Policies or Sites → click on the site name → Policies

- Click the Import Policy button.
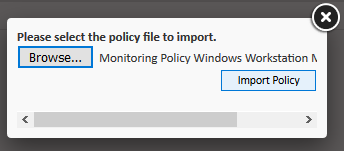
- Find the required .pcy file with a monitor and click the Import Policy button.
- Change the required policy settings

- Click the Save button to save the changes, and then click the Push changes ... button to activate the policy.
Creating monitors manually
You can create monitors manually on any of the three available levels (account, site, device) depending on which devices you need to control:
• For entire account: select in the main menu Account , then the Policies tab, and click New account policy
• For a site: within a particular site, click New site policy on the Policies tab
• For a specific device: click Monitors on the Monitor tab
Steps to create a monitor
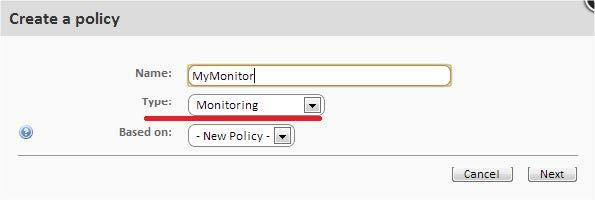
Step 1. Choose a policy type.
Since the monitor is added, then the type of policy should be Monitoring
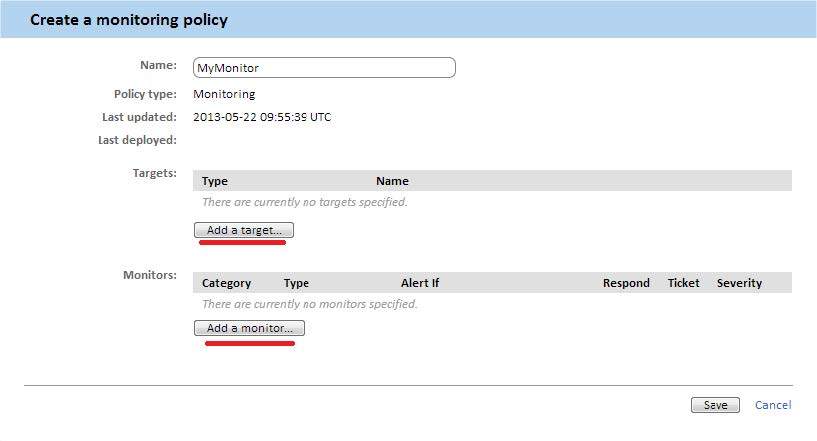
Step 2. Add monitoring target
Add the desired group / filter and monitor.

In this case, the policy may have several monitors associated with it. When you add a monitor, a 4-step wizard appears in which you can adjust the required parameters.
Step 3. Choose a monitor type
In this step, specify the monitor that will be added to the policy according to the resources on the user's device that you want to monitor.
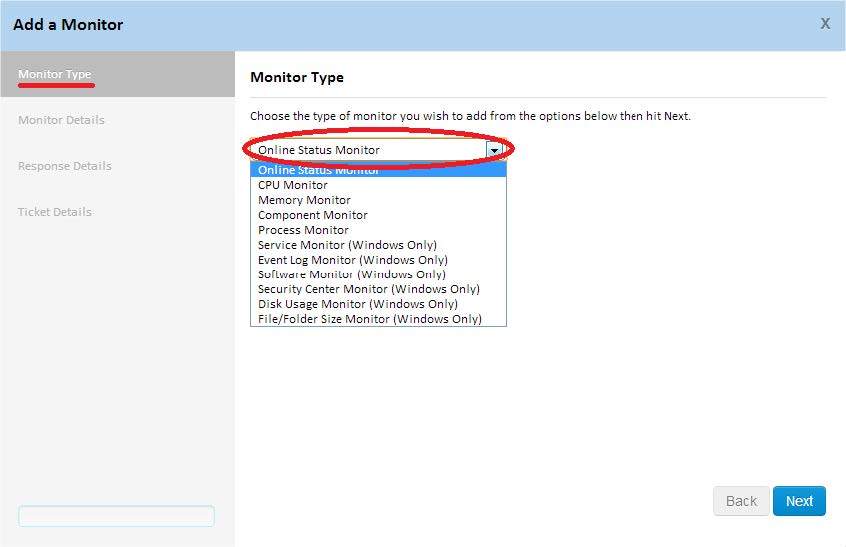
In this case, a wide list of monitor types is available to you, about the functions of which you can learn more from the following table:
| Monitor name | Function | Available for |
|---|---|---|
| Online Status Monitor | Checks if the device is online | Windows, Mac, Linux |
| CPU Monitor | Controls CPU usage. | Windows, Mac, Linux |
| Memory Monitor | Monitors memory consumption | Windows, Mac, Linux |
| Component Monitor | Runs the Monitor component from the ComStore or developed by the administrator. | Windows, Mac, Linux |
| Process Monitor | Monitors the status of a specific process. | Windows, Mac, Linux |
| Service Monitor | Monitors the status of a particular service. | Windows |
| Event log monitor | Controls the viewing of events | Windows |
| Software monitor | Controls the software installed on the device or uninstalled from it | Windows |
| Security center monitor | Monitors the status of the Security Center in the operating system | Windows |
| Disk Usage Monitor | Controls hard disk usage | Windows |
| File / Folder Size Monitor | Controls the size of files and folders. | Windows |
Step 4. Configure the monitor
Each monitor, depending on its functions, has slightly different parameters, so this step will depend heavily on the type of monitor previously selected.

In general, the following data is required at this step:
• Trigger Details: you need to specify additional monitor parameters and trigger trigger conditions
• Alert Details: You can select the priority of alerts to be generated (critical, high, medium, low, information)
• Auto Resolutions Details: Here you can specify the time required to consider this alert automatically resolved.
Step 5. Set the monitor response
In this step, you can choose an answer that will work after the limits set in step 4 are reached.

• Run the following component: In the drop-down list, select the component imported from the ComStore or developed by the administrator.
• Email the following recipients: You can specify recipients, subject, format, and email message. When the Default recipients option is enabled, letters are sent to the accounts defined on the Settings tab of the site to which the created monitor belongs, as well as to those that are defined at the global level in the main menu Accounts, Settings .
Step 6. Create Tickets
At this step, you can turn on automatic ticket generation as an answer created by the monitor to reach the limits set in step 4.
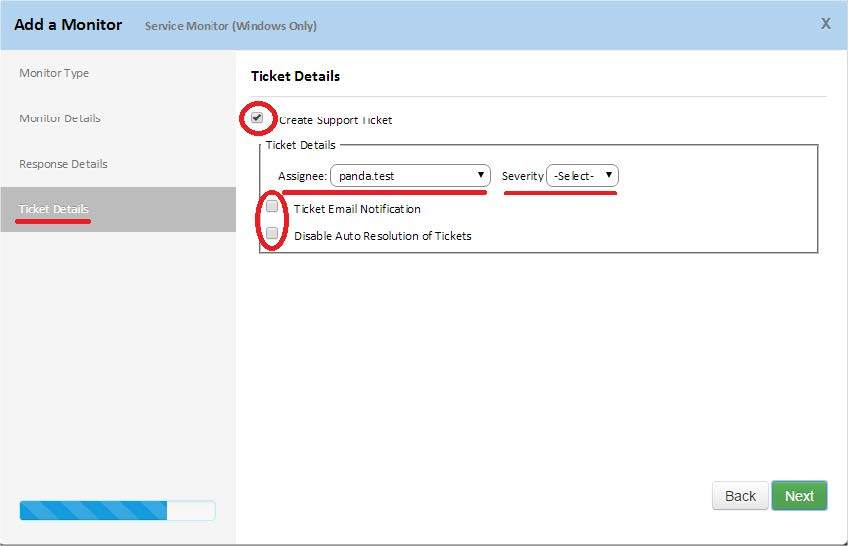
• Assignee: assigns to a technician the tickets created by the monitor
• Severity: allows you to change the level of criticality generated tickets
• Ticket Email Notification: Sends a notification email to a designated technician.
• Disable Auto Resolution of Tickets: disables automatically closing the ticket if the alert that this ticket generated has ceased to occur.
Automatic monitor creation
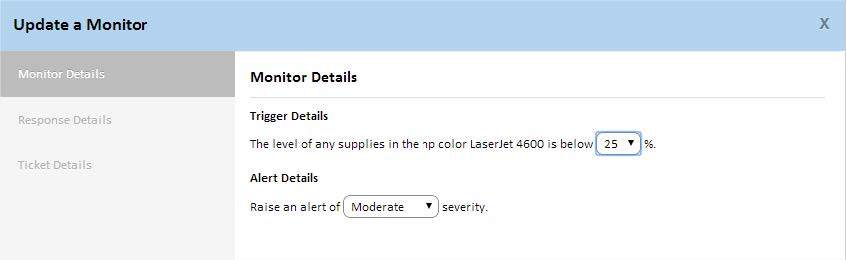
In the case of some devices that are monitored using Panda Systems Management , the system automatically automatically generates pre-configured monitors when such devices are added to the management console. For example, such a case is true for printers, so when you add a device such as a printer to the control console, the corresponding monitor automatically appears on the Policies tab.
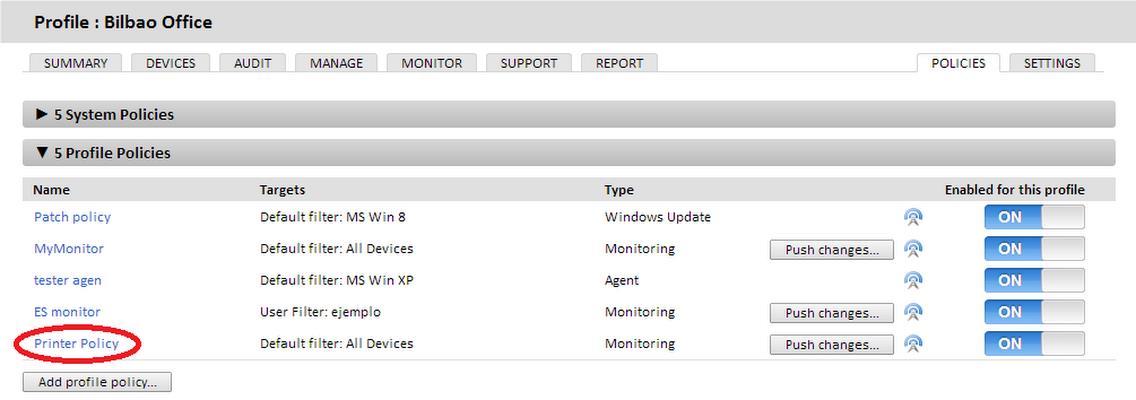
This monitor allows you to control the level of consumables (toner, ink), and if it falls below the established limits, you will immediately know about it through the appropriate alerts.
Creating SNMP Monitors
Monitors for network devices managed via the SNMP protocol are different from those created for devices that support the installation of the Systems Management agent. This is due to the fact that such monitors must meet a number of requirements related to SNMP technology.
What parameters can be monitored on devices managed via SNMP?
Most SNMP-compatible devices publish (in their MIBs) a lot of detailed information, which allows you to track various operating parameters, for example:
• Consumption of internal resources (memory, internal storage, CPU, etc.)
• Bandwidth communication channel.
• Internal device temperature.
• Description of the device and manufacturer (model, version, latest firmware update, etc.)
• Detection of specific errors with error codes.
• Changes in device configuration.
• Changes in device status: ports that are turned on or off on the switch via STP, lines available on the switch, etc.
Any data published in the device MIB can be read and interpreted by the Systems Management solution, although the manufacturer’s manual will determine what information can be used. In addition, it is important to know the units used in the published data, as well as to understand the threshold values that will determine whether the device is operating in a hazardous area on the verge of failure and whether it requires intervention from the service department.
Types of SNMP monitors available in Systems Management
SNMP monitors are divided into two groups:
• Offline Monitor: a simple monitor that checks whether the device is online or offline.
• Network Monitor: very flexible monitors that allow you to get one or more OID values from the monitored device MIB, comparing them with the reference values set by the administrator. If these values are not met, then an alert is triggered.
Steps for creating an SNMP monitor
To create a monitor on an SNMP device, follow these steps:
Step 1. Prepare the device for the monitor
Virtually every device connected to the data network can be monitored via SNMP. To do this, as a rule, you need to enable the SNMP protocol in certain parameters of the device and specify the Community to which it belongs (the default value is Public ).
Some devices may also need to configure the version of SNMP protocol being used (v1 / v2), as well as the IP addresses from which the monitored device will receive SNMP requests. In this case, the IP address will be the one that belongs to the device with the Systems Management agent installed and the Network Node role.
After SNMP is enabled on the monitored device, set the OIDs to be monitored. SNMP-compatible devices periodically dump internal data on the status of work in the structure of the MIB. You will need to check the manufacturer's documentation for this device to find out which OID nodes in the MIB structure contain useful information and write them down.
You can also get these OID nodes by viewing the MIB structure using Mibble or similar solutions.
Step 2. Assign a device with the Systems Management Agent installed as a Network Node
At this step, we will not stop separately, because it requires a certain distraction from the topic under consideration. Information on how to do this can be found in the administrator’s guide for Panda Systems Management.
By the way, it is recommended to check the communication between the agent assigned as the Network Node and the monitored device via TCP and UDP port 161 in both directions.
Step 3. Add the network device to the management console
For more information on how this can be done, it is also better to look in the Administrator's Guide, which describes how to add to the management console those devices that do not support the installation of the Systems Management agent.
Step 4. Create or integrate the SNMP monitor component
The OIDs that System Management reads from the device are installed through components already created or published in the ComStore , or through components specifically designed for devices that do not support current components.
To monitor most common network devices, it’s enough to check the components in the Network Monitors section of the ComStore . To use one of the available components, click ComStore → Network Monitors and select the appropriate monitor. Each component in Network Monitor tracks devices or a family of devices from a specific manufacturer. Review the component description to ensure that the component is suitable for monitoring the desired device.
After you have selected a component, click Buy (do not worry, in fact you don’t have to buy anything). In this case, the component will be added to the Components , and you can use it when creating an SNMP monitor.
For more information on how to create an SNMP monitor component, see the administrator’s guide.
Step 5. Create a monitor at the device level (Device Level).
On the network device, go to the Monitor tab, select Monitors and click Add a monitor .

Step 6. Select the monitor type and its associated Network Node
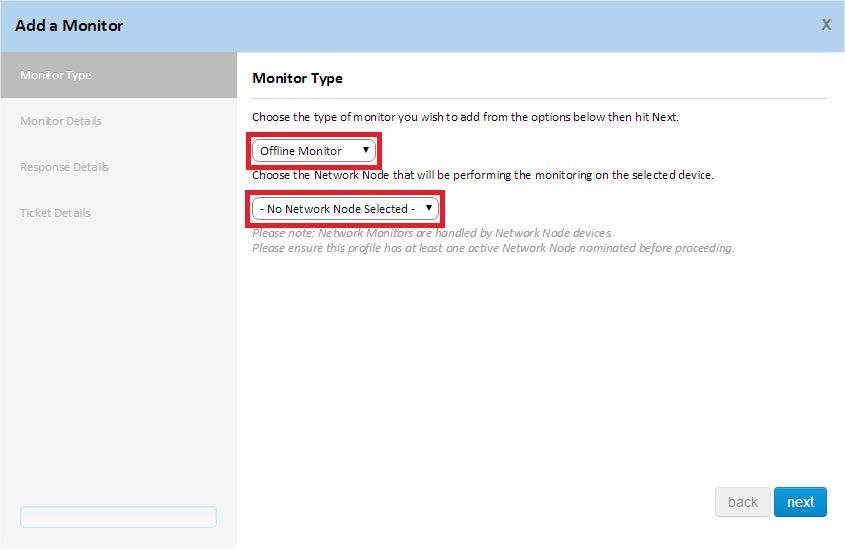
Step 7. Select the Network Monitor component.
Offline monitors (Offline Monitor) do not have related components, and therefore all you need to do is to set the monitor's response and create corresponding tickets in case the device “drops out” offline.
However, Network Monitors (Network Monitor) require that you select and assign the Network Monitor component. You can choose from Network Monitor components that were previously added from the ComStore, or among those components that you may have created manually.

Step 8. Enter the required information in the added component.
Depending on the type of Network Monitor component you select, you will need to specify certain thresholds that Systems Management will perceive as a level to create an alert. These values are displayed on the monitor settings screen.
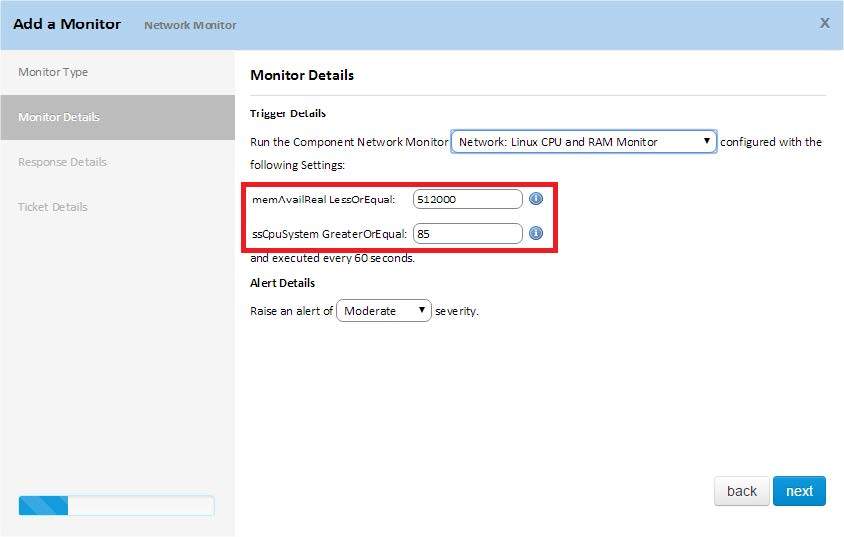
In our example above, we added the following ComStore component : Linux CPU and RAM Monitor. This component monitors the consumption of RAM and the CPU to determine whether the device is at risk of entering an error state.
For this, the component requests two values from the administrator:
• The minimum amount of free RAM on the device for its correct operation. If the value is below the set threshold, the system will consider that this device is malfunctioning, and therefore an alert will be created.
• Maximum consumption of CPU resources that can be used every minute. If this value is exceeded, the system will assume that this device is malfunctioning, and therefore an alert will be created.
After you have specified all the necessary data to create an SNMP component, the monitor configuration will be identical to the configuration of other types of monitors.
Systems Management SNMP components provide visibility into the internal status of managed devices that are incompatible with agent installation. Entries to MIB devices or receiving SNMP traps are not supported.
Creating ESXi Monitors
ESXi servers require a special type of monitor, other than those used to monitor devices that support agent installation.
How to create an ESXi monitor
Step 1. Choose a policy type.
Since it is about an ESXi monitor, then select ESXi.
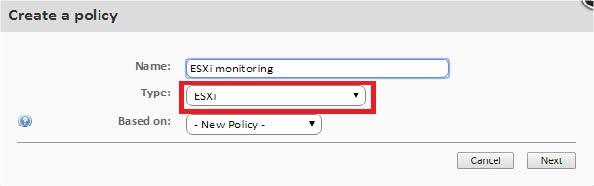
You can create ESXi policies at the account or site level, but you cannot create them at the device level.
Step 2. Choose a goal
Select the device or group of devices you want to monitor, as well as the type of monitor you want to add to the policy.
Click the Add a monitor button to go to the 4-step wizard to configure all the required parameters.
Step 3. Choose a monitor type
Specify the type of monitor you want to add to the policy, according to the resources you need to monitor on the ESXi server.

Below is a brief description of each type of monitor.
| Monitor name | Purpose |
|---|---|
| ESXi CPU Monitor | Tracks CPU consumption on an ESXi server |
| ESXi Memory Monitor | Monitors memory consumption on an ESXi server |
| ESXi Data Store Monitor | Monitors the amount of free / used disk space in the ESXi server storage system |
| ESXi Temperature Sensor Monitor | Monitors the temperature of the ESXi server |
| ESXi Fan Monitor | Monitors the work of fans on the server ESXi |
| ESXi Disk Health Monitor | Monitors the hard drive and monitors the appearance of any failures in the RAID-system. You must install CIM providers that will provide this information for monitor requests. |
| ESXi PSU Monitor | Tracks ESXi server power |
| Online Status Monitor | Monitors the online status of the ESXi server |
Step 4. Configure the monitor
To configure an ESXi monitor, follow the same steps as when setting up a monitor for a device compatible with installing the Panda Systems Management agent on it (see this article above).
Step 5. Set the monitor response
To configure the response of an ESXi monitor, follow the same steps as when setting up the monitor for a device compatible with installing the Panda Systems Management agent on it (see this article above).
Note that it is not possible to launch the ComStore component as a response to an event generated by an ESXi monitor.
Step 6. Create Tickets
To create tickets, follow the same steps as when setting up the monitor for a device compatible with installing the Panda Systems Management agent on it (see above in this article).
Conclusion
Good is the system administrator whom the employees of the enterprise do not see and do not know, but if only because everything works fine. And this can be achieved (including) with the help of a well-implemented IT network monitoring and incident response system.
Yes, I remember, 20 years ago, the administration of a network of 20-30 computers by one sysadmin was perceived as a labor feat by a soldier thrown at the IT bunker's embrasure. Someone was funny, someone felt sorry for these fighters of the invisible (and most often oh as the visible!) Front, and someone very much swore at them when a new problem occurred with the PC, resenting the fact that it was impossible to call again sysadmin because he always runs somewhere or hides. Although at that time there was something romantic about it when everything was new and again.
Nowadays, modern RMM-systems allow not only to automate the solution of almost all routine IT tasks, but they are also able to foresee the appearance (or even the possibility of occurrence) of IT incidents in order to solve them proactively, imperceptibly to users. And then many people will forget about the sysadmin. It's a shame you say? It is unlikely, because anyway someone will say, what a wonderful sysadmin we have, because everything works without problems!
As for romance, there is always room for it, especially when free time is available for this thanks to RMM systems.
Do more by doing less!
PS We will continue to publish practical articles on the topic "How to do ...". Next time we will try to write about MDM.
')
Source: https://habr.com/ru/post/313754/
All Articles