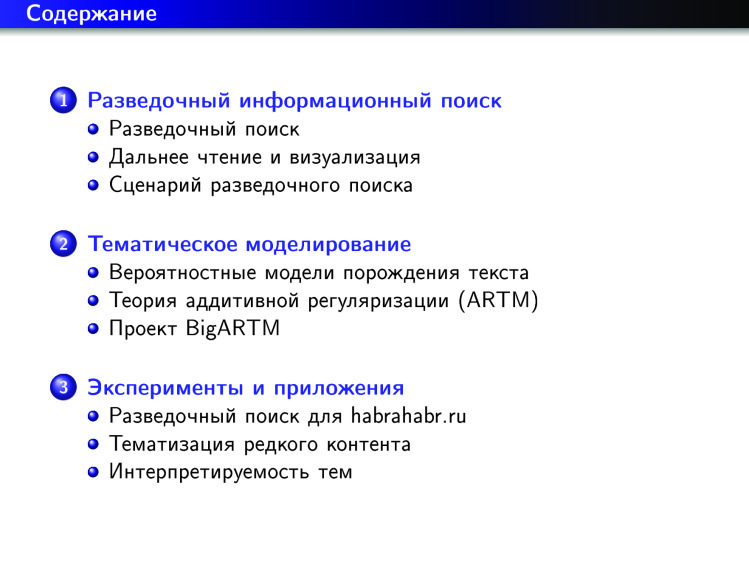
Thematic modeling on the way to exploratory information search. Lecture in Yandex
Recently, a Data Fest conference was held in Moscow, organized by the community of Open Data Science and Yandex. With this publication we open a series of extensions of reports with Data Fest. The author of the first report is Konstantin Vorontsov , Doctor of Science, a recognized machine learning specialist and teacher of the Data Analysis School.
Does Yandex or Google perform any search function? Unfortunately, not yet. There are some types of search in which no issue will be considered correct. And the matter is not even in relevance, but in the fact that we need another search - besides the usual for us all. Under the cut, you will find a transcript of a lecture on exploration, as well as most of the slides.
Friends, we are all gathered here to make the world a better place, and people are smarter. What keeps people from getting smarter? I would say that there are psychological, technological barriers between people and knowledge. My report on how modern information technologies, probably, in the near future will allow to break down these barriers that still remain.
')
Here I am trying to introduce a new fashion - so that when the presentation is then posted on the Internet, the first person to open it will understand what it is about.
The idea is this: why do I declare that we want to make people smarter? Surely there are skeptics who will say: “Ha-ha-ha, you cannot change a person”. But I’ll remind skeptics that once people couldn’t read or write, and knowledge was distributed only verbally, overgrown with legends and myths, forgotten, modified beyond recognition, etc. But then people thought up that you need to write books, print books. This happened when European priests understood: when they read the sermons, they do the same thing year after year, the people still do not remember, do not understand, perceive something as something wrong. And that all need to teach literacy.
Then there were a few more information revolutions. In the end, the Internet, the search engines, and knowledge became closer to the people. But it seems that all the same something is missing. Anyway, from my fellow scientists, people of knowledge, I occasionally hear a complaint that I began to conduct research, read a lot of literature, and six months, three, five years I suddenly discovered: everything I did was already published 10 years ago . How so? You have been engaged in your work for years and have not managed to find what someone did before you. How is this possible with modern search capabilities? It turns out that this barrier between man and knowledge does exist. Now I said about the technological barrier. If it’s purely psychological, troechnik never loved excellent students, and this is understandable, and with this we will not fight with you now. But I really want to tear down the technological barriers.
Therefore, there are new paradigms of information retrieval, which today I would like to talk with you.
We begin with the fact that about 10 years ago, new paradigms of the concept of information retrieval were actively discussed.
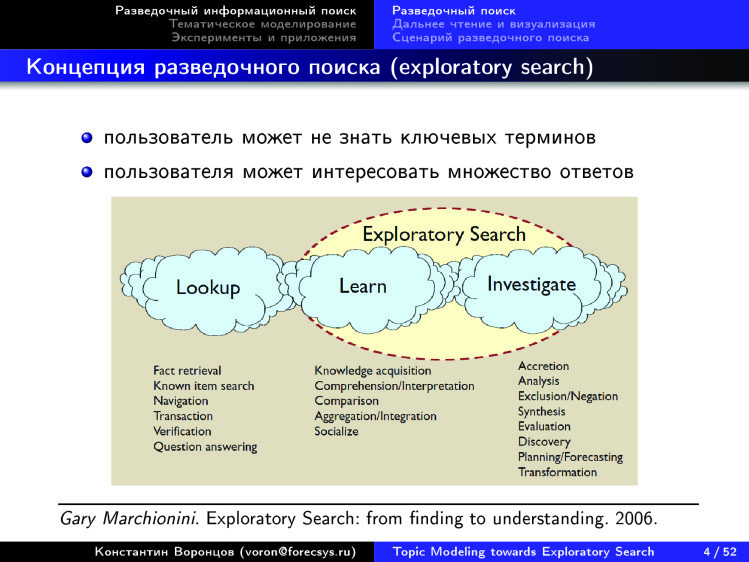
In particular, the expression Exploratory Search. How to translate it into Russian? I translate this as an “exploratory search,” some translate as an “exploratory search.” If you look at this diagram, then left the search needs to which we are accustomed. And modern search engines that search well for keywords solve the problem of finding the nearest pharmacy, where there is a medicine and where it is the cheapest. Or find something concrete, and you know how to label it. But if you want to understand a new subject area for you, you will have problems. I, a data analyst, have recently begun to understand electrocardiography. I am absolutely not a doctor: I do not understand anything in cardiography or electrocardiography. I need to quickly understand the structure of this subject area. Find out what to read in the first place, to find out where it is at the junction with what I know well. With where I am a professional.
And such information needs arise more and more often in people of an ever wider range of professions. We are no longer talking only about students, teachers, scientists, researchers. These are marketers, doctors, lawyers, journalists - anyone. More and more people are starting to search for something on their own on the Internet, to replenish their knowledge. The question is how to do it as efficiently as possible?
We are starting to use search engines for self-education - to explore something, learn something new. And here we understand that we do not have enough of them, because they are not effectively covering these needs.
The problem is that when we search by keywords, we need to know exactly what we are looking for. And we must assume that there is a correct answer. These two prerequisites are exactly the same when we are in a new subject area. On the one hand, we do not understand very well what exactly we are looking for. We ourselves want to understand. We still do not have the terminology, the only thing we can do is to set some expressions, words in the search box. And the search results are always somehow tied to the specified words. When we learn new words, we understand: in fact, it was necessary to look for exactly this, and not what we were looking for so far. But many dozens of such insights are needed in the iterative process in order to more or less begin to navigate. And all the same: you can be engaged in this for years, but something important cannot be found.
The question is: how to provide an answer to a search query in such a way that a person will immediately see in front of him a road map of the subject area, so that he will understand what it consists of and where to go next.
So there are differences between what we would like - and we would like a picture of the domain - and the usual iterative search. We are used to query-browse-refine, that is, gave a query, looked at the answer, improved the query and so iteratively many times.
Here are about a decade or even more old paradigms that arise. How does information seeking differ from information retrieval? The latter is the area of information retrieval, what Yandex is doing. And information seeking is a slightly shifted accent, it is not a science about all information retrieval, but a science about how users behave when they are looking for something, how this iterative exploration process is arranged, when the user finds out in the process of searching what really have to.
There is such a mantra from the field of this information seeking - that you first have to get the big picture, then use the means of scaling and filtering, go deeper inside, see the picture more broadly, choose something from it and then go deeper into the very details.
Why did I select a piece of this mantra in red? Very often, when they talk about some new ways of visualizing large amounts of information, they show a big picture, a graph. And many already have idiosyncrasy for such pictures. They are too often and show a lot, but do not explain what to do with them further.
Ideologues of information seeking this explained. Do not forget that there is not only the first stage, when you gave the overview. Also give the user a way to zoom, deepen, filter and get to the content itself. When this technology is fully implemented and it is interactive, it starts working. And if you are limited to the first stage - then, of course, except for a beautiful picture you can not see anything.
The concept of close reading also arose. This is what we are used to - linear reading of the text. We take notes, emphasize, mark with markers, etc. Close reading.
Here is another concept proposed 10 years ago by Franco Moretti, the Italian sociologist of literature. He wondered why in the world literature 99.9% is not read by anyone, and how to understand what all this literature is about. If he asks such questions in relation to fiction, then all the more they are valid for scientific literature, for knowledge. How can you cover everything, make overview?
There are many different attempts to present large amounts of scientific knowledge in the form of some kind of maps. Of course, it is assumed that there will be scaling opportunities later.
For example, medical knowledge cards. I don’t really like this map - there’s obviously some geographical metaphor. There is something like countries that are somehow called, and something like cities is signed with another font and other color. You can go further, invent meaning for roads, rivers, etc. But it seems that all this is overloaded. You look at it and understand that you are uncomfortable. Why? Let's try to be aware.

Here is another way to visualize. I like it more, it is more understandable. This is our domain - data science, data mining, some words have appeared here, which are already clearly visible, unlike the previous slide.
I don't like something here. When a large cell breaks up into smaller ones, it is a hierarchical structure of knowledge - and it’s very good that it appeared and that you can go into the cells so much. In this fractal way they will be split up into smaller and smaller ones until you reach the text somewhere. This is just great, this is a good idea. But I don’t really like the principle that splitting large ones into small ones is purely visually, graphically, based on the fact that a larger cell should be in the middle and smaller cells around it. The two-dimensional topology disappears. We present a certain projection, a certain map on the plane, on the screen, so the proximity there must be somehow semantically loaded. And here it turns out that we only presented the hierarchy.

Here is another example, take a closer look. And there are many such examples on the Internet. Many who are trying to build maps of all science for a variety of collections. There are just collections of articles, there are collections of annotations, there are collections where links between articles are taken into account, that is, citation information. There are collections in which there is information about how users downloaded and read certain articles. In general, these types of information can be used to build such science maps.
If you look at this map, it immediately catches the eye that for some reason everything is located in a circle. This is economics, computer science, mathematics, agriculture, physics, chemistry, medicine, biology, pharmacology, neuroscience, psychology - and then it all came down to a humanitarian cycle. Noticed, there is a cycle: precise, natural, humanitarian. The cycle is closed. And the topology of such a picture of knowledge is not two-dimensional, as it seems here in the picture. We are talking about a circle, one-dimensional structure. Yes, it is closed in a ring, but this is an interesting observation.
And here is a very similar picture. It is made by completely different people and means, on completely different collections, but again we see the same areas: computer science, mathematics, engineering, physics, chemistry, geology, biology, biotechnology, molecular biology, brain, medicine, health care, humanitarian aid, social programs. - and again they are locked in computerized research methods. Again a circle arises.
If you look, there are a lot of such pictures on the Internet. More than half of them for some reason are such circles.
Here is another idea - but, unfortunately, not automatically built, but manually. There is such a specialist in the theory of complexity, Brian Castellani, who from year to year updates this map of the theory in the science of complexity. He identifies the main directions and lays them out over the years. Unlike previous maps, two-dimensionality appeared. There is a horizontal axis that corresponds to time, and a vertical axis corresponding to the topics. You can see these topics, about five lines showing how this occurs in computer science and cybernetics. Somewhere in the end it comes to data analysis, new circles have appeared.
Highlighted themes go horizontally, and you can trace how the theme developed. And the arrows show the main works and the names of the scientists who made the main contribution. The man worked, drew this picture. The question arises: is it possible to draw these pictures on any field of science purely automatically? We took all these tens of millions of scientific publications, singled out in some way, gave a request. For example, the theory of complexity, according to which 10 reference works, is our search query. And we want to output such a picture. Then it will be easier for people to deal with new areas of knowledge for them. Approximately to this we would like to come.
By the way, pictures, which, for example, lay out the news flow in time, also learned to build very nicely. Imaging technologies are ready, there are many developments.
For example, take the Rose River project. This is how they visualize the news flow associated with Snowden. 2013-2014. What do they do to build such pictures on any subset of the news flow? first set a certain section of the hierarchy of topics, methods, automatically build a certain hierarchy on the news collection, show it to another expert. He says: here, please, cut off at the top level, these topics do not interest me very much. And here, about Snowden, please, in more detail, here you need to cover a lower level of hierarchy.
The expert asked such a filter, and then the system automatically displays such a picture, shows how the themes evolved over time, how they intersected, merged, appeared, faded out. Everything is displayed as a beautiful picture, where the themes flow like a river. Then this picture can be interactively changed, new generated, etc. In principle, this is exactly what is called distant reading. We want to understand how this area is structured. In this case, there is a news flow on specific topics, and there is an opportunity to go deeper, because you can correct each topic, enter a sub-topic and reach specific news, read them. This system is approximately the same, but it is also arranged as follows: the horizontal axis is time, the vertical axis is some topics selected by the expert.
In fairly convenient visualization tools, we again see that the two axes are interpretable, unlike the maps that were shown at the very beginning.
There are already a lot of visualization tools for large text collections. A year ago, when I gave a report on this at the Data Fest, there were 170 of them. Now I looked - already 330. In a year their number doubled. People invest a lot of effort to come up with convenient ways to visualize large volumes of text. This can be used.

Let's fantasize about how the exploratory search should be arranged after all. What do we want? We cannot set requests in the form of short phrases. We do not know what we are looking for. And what are we pushing off then? If you think about it, then, as a rule, we have on hand some big text, some kind of collection of text. Maybe we didn’t even figure it out ourselves. There is a certain article. We just got rid of it by a colleague, we haven’t figured out anything yet, we don’t know how this article is positioned within the required field of science. First we want to see it. Therefore, the request is an arbitrarily long text - a large collection can be. And we want to understand what topics the request belongs to, what is known from them, besides our document. We want to understand what the thematic structure of this subject area is, which areas are adjacent for it and what to read in general first of all. This is a range of queries, search needs of the user who is engaged in self-education, trying to expand their knowledge in a particular area.
I would like this opportunity to be in any application where there is some text. I would like to understand on what topics this text is, and use it as a request - in order to immediately get a picture with the visualization of this subject area. Such is the dream of exploration. We do not even go to any Google or Yandex to fill something in the search box. We don't even have to do this. This search method should always be at hand, wherever there is an arbitrarily long text. Such is the dream.
Here is a concept. It is clear that many in the world go to this dream in different ways. Someone, like me and my scientific group, from the point of view of mathematics, someone from the point of view of technology. How would we like this to be arranged? We already understood that it is very cool to visualize information in two axes: time-subject. It’s great if you can split up the topics into subtopics, have a large enough tree. Moreover, it is desirable that it be built automatically - so that there would not be any UDC consisting of 80 thousand points, invented by a community of tens of thousands of experts for over a hundred years. This human-supported structure is constantly becoming obsolete. This we do not need. With the help of information technology, we need to ensure that such structures are built on the fly, automatically, according to the content that is on the Internet.
We also noticed a remarkable feature: there is a cycle around the circle - humanitarian, natural, exact sciences. - - , , , , , — , — .
?
, . , , , . , Google, . -, — , , , . , . . . .
. ? This is an important question.
? . , . , , ? , — ? , . — , , , , — , . , . . , , . — -, .
, , 330 . — . Why? ? , , , , , , , , — . - , - , - , - . . , . , . . . , , , , .
? . , .
— . , ? , . , , , — , . , , . , .
, . , , . . — . , — . , — .
, , , — . , .
. : , , , , , . . , . , . , , , .
, , .
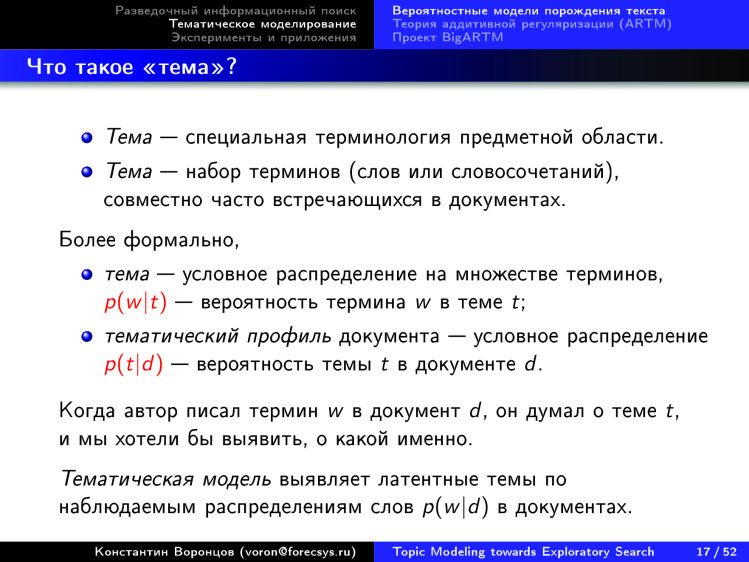
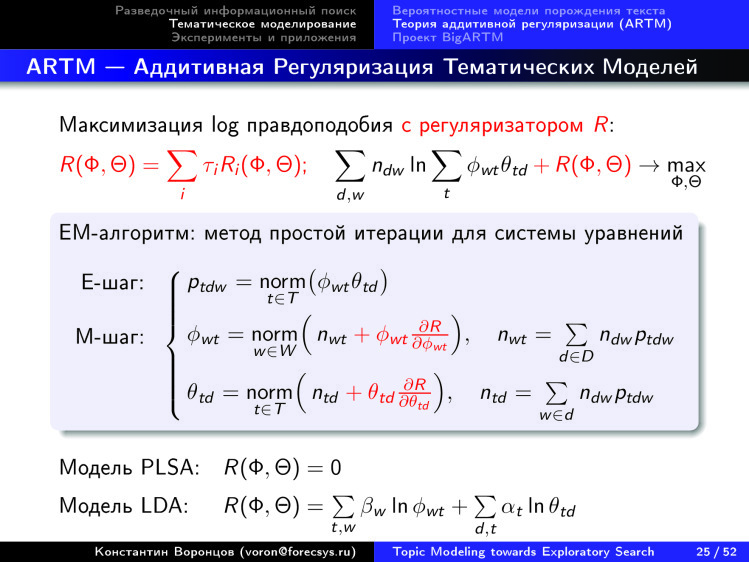
. , . , . , , . , « — », : « » « ».
, . , , , , .
. φ — , θ — .
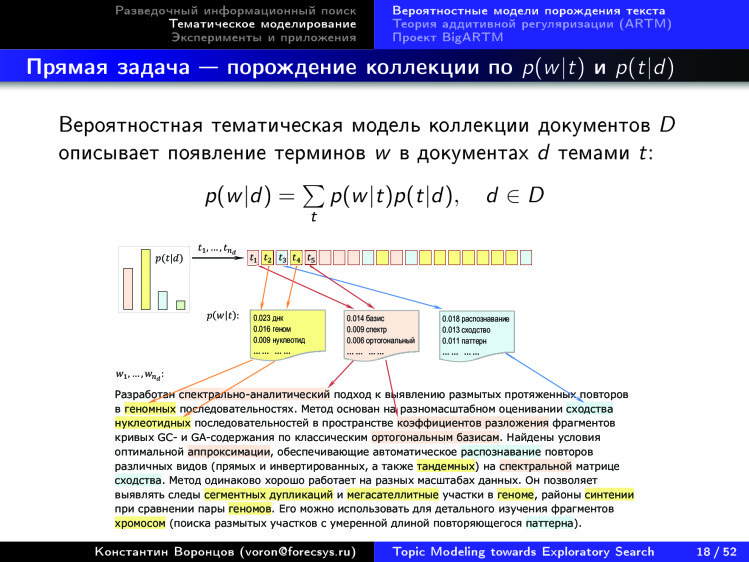
, — . , , , , , Y . . , , .
— . « », , , . , . . , : , . , , , , . .
— , 1999 , . , , . 100% . - . , , 15 . , .
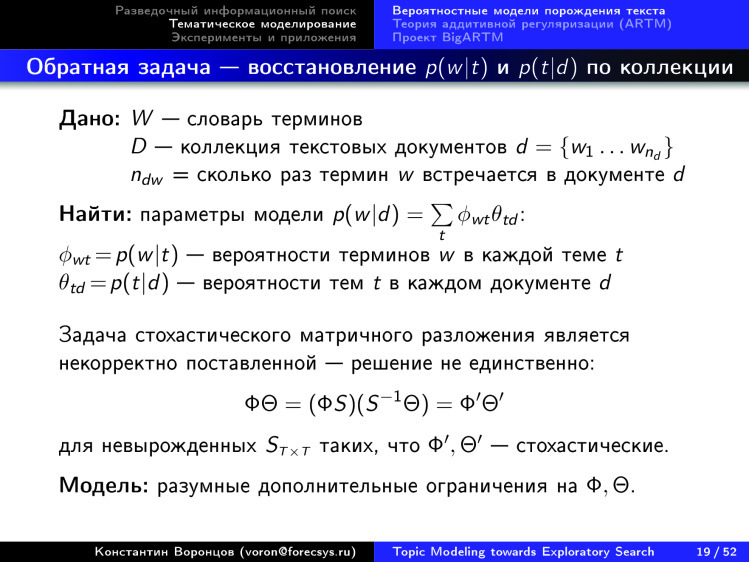
. , , . , , , φ θ, . — φ θ, , , .
. , , N-, -, , . — - , . - . , .
, , , , — .
. , , , . — .
- , - . , — φ θ.
, . , , , . . — , , .

, , , .
, . : , , , , - , , , . . - . , .
, - , . , — , , . - . , , .
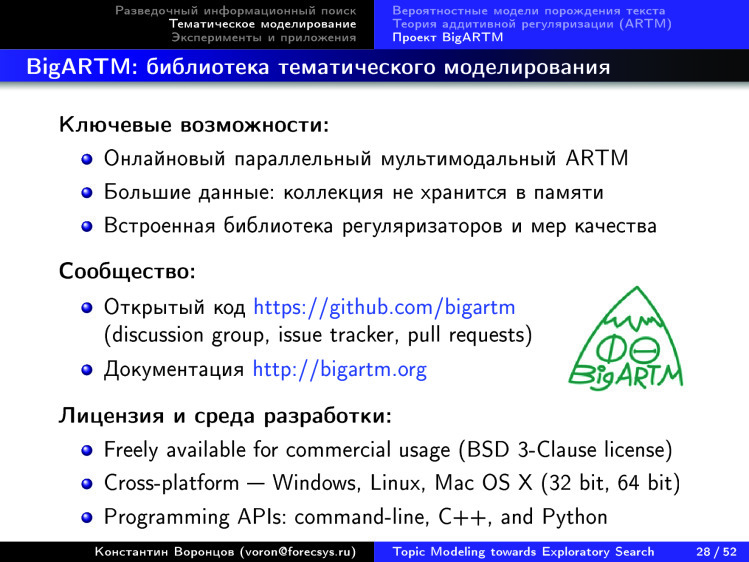
. — BigARTM , - . — . , . — .
, : . , , .
, . , . , , , , , , MATLAB, , — , .
— ++, , . , , , . , . , .

Python, , .
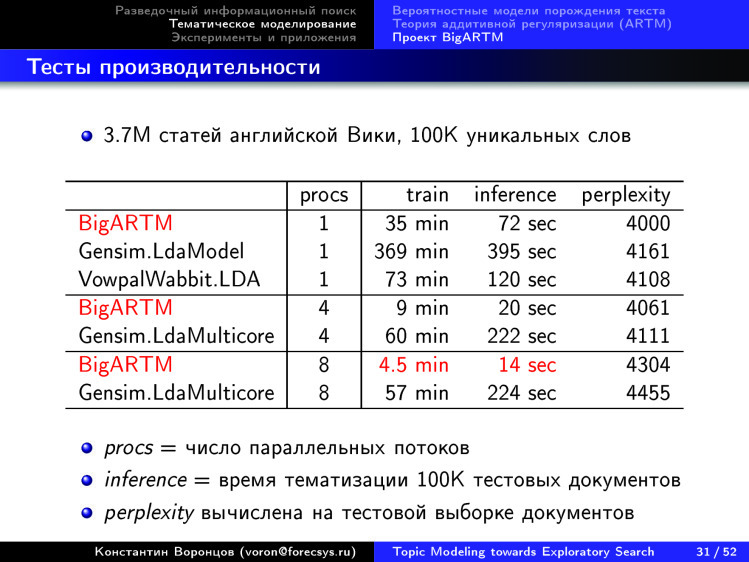
, . 3,7 4,5 . 14 10 . — , .
, , — , .
— , . , , , , , , . .
, . , , .

, — -k .
, .
, , . , , 25 , : , . . , .
, , .
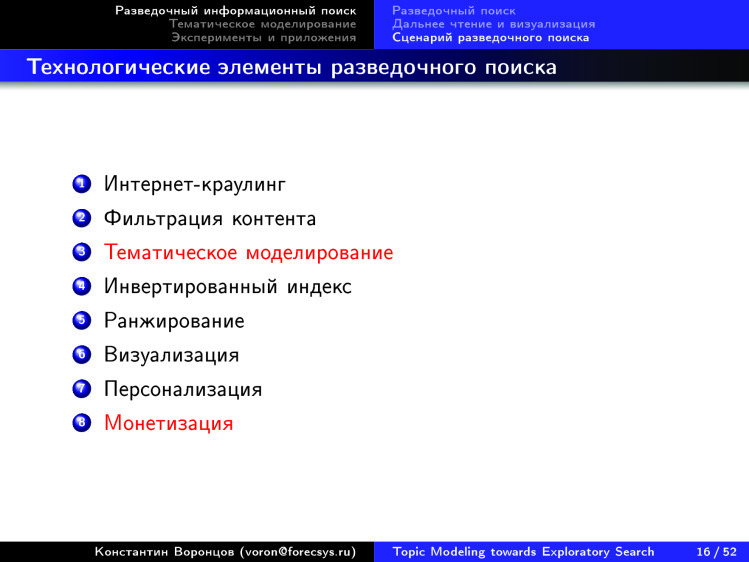
. ? 4. — .

, . , - . . [3D ] - 3D — .

. , , 25 .
.
, , , . , , .
, 200 . , , — . , , - .

. , . , , . Thanks for attention.
Does Yandex or Google perform any search function? Unfortunately, not yet. There are some types of search in which no issue will be considered correct. And the matter is not even in relevance, but in the fact that we need another search - besides the usual for us all. Under the cut, you will find a transcript of a lecture on exploration, as well as most of the slides.
Friends, we are all gathered here to make the world a better place, and people are smarter. What keeps people from getting smarter? I would say that there are psychological, technological barriers between people and knowledge. My report on how modern information technologies, probably, in the near future will allow to break down these barriers that still remain.
')
Here I am trying to introduce a new fashion - so that when the presentation is then posted on the Internet, the first person to open it will understand what it is about.
The idea is this: why do I declare that we want to make people smarter? Surely there are skeptics who will say: “Ha-ha-ha, you cannot change a person”. But I’ll remind skeptics that once people couldn’t read or write, and knowledge was distributed only verbally, overgrown with legends and myths, forgotten, modified beyond recognition, etc. But then people thought up that you need to write books, print books. This happened when European priests understood: when they read the sermons, they do the same thing year after year, the people still do not remember, do not understand, perceive something as something wrong. And that all need to teach literacy.
Then there were a few more information revolutions. In the end, the Internet, the search engines, and knowledge became closer to the people. But it seems that all the same something is missing. Anyway, from my fellow scientists, people of knowledge, I occasionally hear a complaint that I began to conduct research, read a lot of literature, and six months, three, five years I suddenly discovered: everything I did was already published 10 years ago . How so? You have been engaged in your work for years and have not managed to find what someone did before you. How is this possible with modern search capabilities? It turns out that this barrier between man and knowledge does exist. Now I said about the technological barrier. If it’s purely psychological, troechnik never loved excellent students, and this is understandable, and with this we will not fight with you now. But I really want to tear down the technological barriers.
Therefore, there are new paradigms of information retrieval, which today I would like to talk with you.
We begin with the fact that about 10 years ago, new paradigms of the concept of information retrieval were actively discussed.
In particular, the expression Exploratory Search. How to translate it into Russian? I translate this as an “exploratory search,” some translate as an “exploratory search.” If you look at this diagram, then left the search needs to which we are accustomed. And modern search engines that search well for keywords solve the problem of finding the nearest pharmacy, where there is a medicine and where it is the cheapest. Or find something concrete, and you know how to label it. But if you want to understand a new subject area for you, you will have problems. I, a data analyst, have recently begun to understand electrocardiography. I am absolutely not a doctor: I do not understand anything in cardiography or electrocardiography. I need to quickly understand the structure of this subject area. Find out what to read in the first place, to find out where it is at the junction with what I know well. With where I am a professional.
And such information needs arise more and more often in people of an ever wider range of professions. We are no longer talking only about students, teachers, scientists, researchers. These are marketers, doctors, lawyers, journalists - anyone. More and more people are starting to search for something on their own on the Internet, to replenish their knowledge. The question is how to do it as efficiently as possible?
We are starting to use search engines for self-education - to explore something, learn something new. And here we understand that we do not have enough of them, because they are not effectively covering these needs.
The problem is that when we search by keywords, we need to know exactly what we are looking for. And we must assume that there is a correct answer. These two prerequisites are exactly the same when we are in a new subject area. On the one hand, we do not understand very well what exactly we are looking for. We ourselves want to understand. We still do not have the terminology, the only thing we can do is to set some expressions, words in the search box. And the search results are always somehow tied to the specified words. When we learn new words, we understand: in fact, it was necessary to look for exactly this, and not what we were looking for so far. But many dozens of such insights are needed in the iterative process in order to more or less begin to navigate. And all the same: you can be engaged in this for years, but something important cannot be found.
The question is: how to provide an answer to a search query in such a way that a person will immediately see in front of him a road map of the subject area, so that he will understand what it consists of and where to go next.
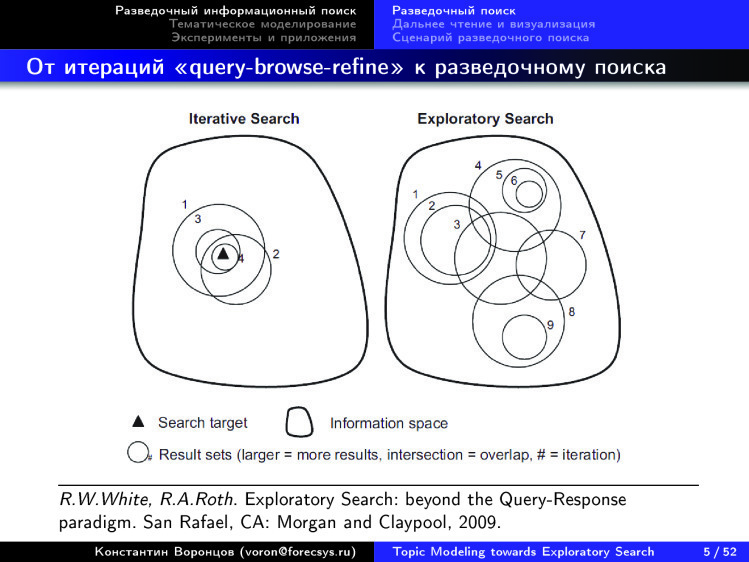
So there are differences between what we would like - and we would like a picture of the domain - and the usual iterative search. We are used to query-browse-refine, that is, gave a query, looked at the answer, improved the query and so iteratively many times.
Here are about a decade or even more old paradigms that arise. How does information seeking differ from information retrieval? The latter is the area of information retrieval, what Yandex is doing. And information seeking is a slightly shifted accent, it is not a science about all information retrieval, but a science about how users behave when they are looking for something, how this iterative exploration process is arranged, when the user finds out in the process of searching what really have to.
There is such a mantra from the field of this information seeking - that you first have to get the big picture, then use the means of scaling and filtering, go deeper inside, see the picture more broadly, choose something from it and then go deeper into the very details.
Why did I select a piece of this mantra in red? Very often, when they talk about some new ways of visualizing large amounts of information, they show a big picture, a graph. And many already have idiosyncrasy for such pictures. They are too often and show a lot, but do not explain what to do with them further.
Ideologues of information seeking this explained. Do not forget that there is not only the first stage, when you gave the overview. Also give the user a way to zoom, deepen, filter and get to the content itself. When this technology is fully implemented and it is interactive, it starts working. And if you are limited to the first stage - then, of course, except for a beautiful picture you can not see anything.
The concept of close reading also arose. This is what we are used to - linear reading of the text. We take notes, emphasize, mark with markers, etc. Close reading.
Here is another concept proposed 10 years ago by Franco Moretti, the Italian sociologist of literature. He wondered why in the world literature 99.9% is not read by anyone, and how to understand what all this literature is about. If he asks such questions in relation to fiction, then all the more they are valid for scientific literature, for knowledge. How can you cover everything, make overview?
There are many different attempts to present large amounts of scientific knowledge in the form of some kind of maps. Of course, it is assumed that there will be scaling opportunities later.
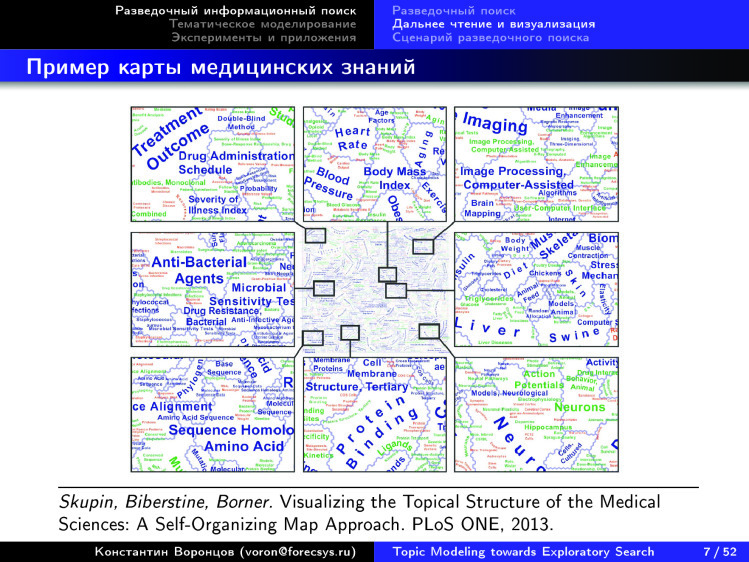
For example, medical knowledge cards. I don’t really like this map - there’s obviously some geographical metaphor. There is something like countries that are somehow called, and something like cities is signed with another font and other color. You can go further, invent meaning for roads, rivers, etc. But it seems that all this is overloaded. You look at it and understand that you are uncomfortable. Why? Let's try to be aware.
Here is another way to visualize. I like it more, it is more understandable. This is our domain - data science, data mining, some words have appeared here, which are already clearly visible, unlike the previous slide.
I don't like something here. When a large cell breaks up into smaller ones, it is a hierarchical structure of knowledge - and it’s very good that it appeared and that you can go into the cells so much. In this fractal way they will be split up into smaller and smaller ones until you reach the text somewhere. This is just great, this is a good idea. But I don’t really like the principle that splitting large ones into small ones is purely visually, graphically, based on the fact that a larger cell should be in the middle and smaller cells around it. The two-dimensional topology disappears. We present a certain projection, a certain map on the plane, on the screen, so the proximity there must be somehow semantically loaded. And here it turns out that we only presented the hierarchy.
Here is another example, take a closer look. And there are many such examples on the Internet. Many who are trying to build maps of all science for a variety of collections. There are just collections of articles, there are collections of annotations, there are collections where links between articles are taken into account, that is, citation information. There are collections in which there is information about how users downloaded and read certain articles. In general, these types of information can be used to build such science maps.
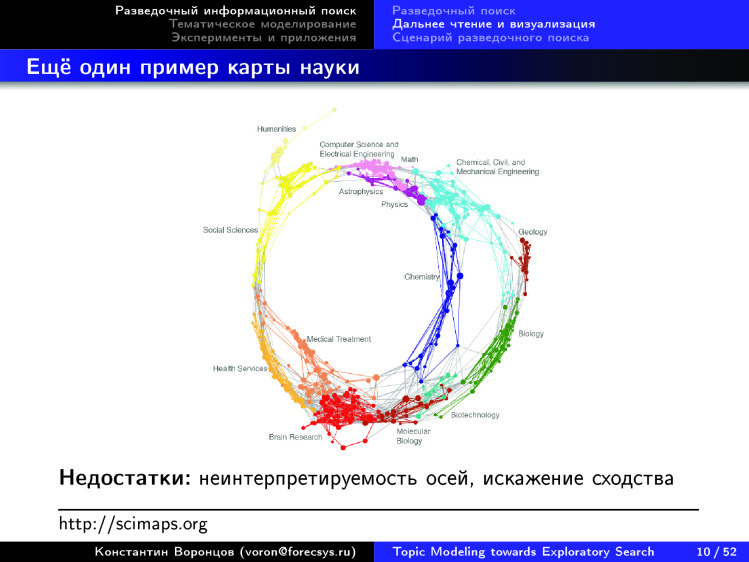
If you look at this map, it immediately catches the eye that for some reason everything is located in a circle. This is economics, computer science, mathematics, agriculture, physics, chemistry, medicine, biology, pharmacology, neuroscience, psychology - and then it all came down to a humanitarian cycle. Noticed, there is a cycle: precise, natural, humanitarian. The cycle is closed. And the topology of such a picture of knowledge is not two-dimensional, as it seems here in the picture. We are talking about a circle, one-dimensional structure. Yes, it is closed in a ring, but this is an interesting observation.
And here is a very similar picture. It is made by completely different people and means, on completely different collections, but again we see the same areas: computer science, mathematics, engineering, physics, chemistry, geology, biology, biotechnology, molecular biology, brain, medicine, health care, humanitarian aid, social programs. - and again they are locked in computerized research methods. Again a circle arises.
If you look, there are a lot of such pictures on the Internet. More than half of them for some reason are such circles.
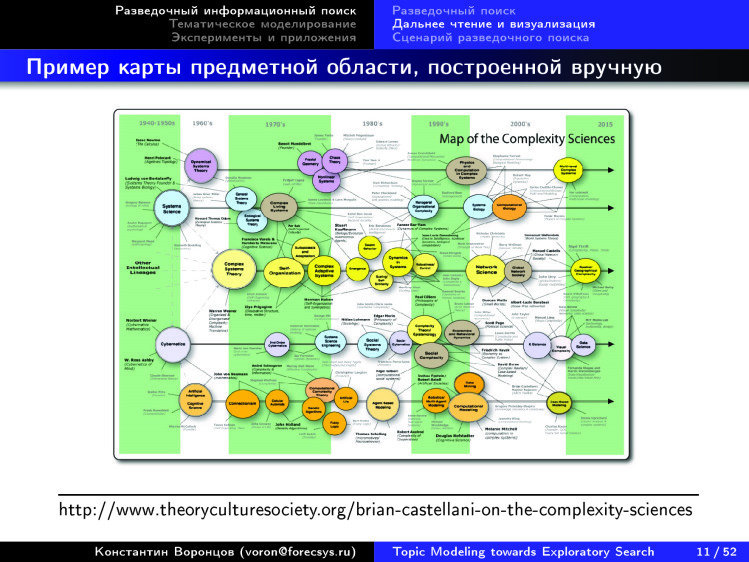
Here is another idea - but, unfortunately, not automatically built, but manually. There is such a specialist in the theory of complexity, Brian Castellani, who from year to year updates this map of the theory in the science of complexity. He identifies the main directions and lays them out over the years. Unlike previous maps, two-dimensionality appeared. There is a horizontal axis that corresponds to time, and a vertical axis corresponding to the topics. You can see these topics, about five lines showing how this occurs in computer science and cybernetics. Somewhere in the end it comes to data analysis, new circles have appeared.
Highlighted themes go horizontally, and you can trace how the theme developed. And the arrows show the main works and the names of the scientists who made the main contribution. The man worked, drew this picture. The question arises: is it possible to draw these pictures on any field of science purely automatically? We took all these tens of millions of scientific publications, singled out in some way, gave a request. For example, the theory of complexity, according to which 10 reference works, is our search query. And we want to output such a picture. Then it will be easier for people to deal with new areas of knowledge for them. Approximately to this we would like to come.
By the way, pictures, which, for example, lay out the news flow in time, also learned to build very nicely. Imaging technologies are ready, there are many developments.
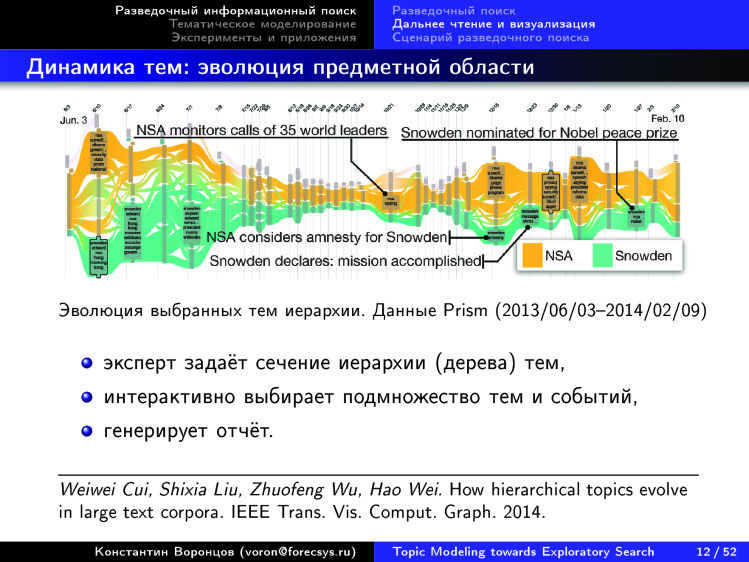
For example, take the Rose River project. This is how they visualize the news flow associated with Snowden. 2013-2014. What do they do to build such pictures on any subset of the news flow? first set a certain section of the hierarchy of topics, methods, automatically build a certain hierarchy on the news collection, show it to another expert. He says: here, please, cut off at the top level, these topics do not interest me very much. And here, about Snowden, please, in more detail, here you need to cover a lower level of hierarchy.
The expert asked such a filter, and then the system automatically displays such a picture, shows how the themes evolved over time, how they intersected, merged, appeared, faded out. Everything is displayed as a beautiful picture, where the themes flow like a river. Then this picture can be interactively changed, new generated, etc. In principle, this is exactly what is called distant reading. We want to understand how this area is structured. In this case, there is a news flow on specific topics, and there is an opportunity to go deeper, because you can correct each topic, enter a sub-topic and reach specific news, read them. This system is approximately the same, but it is also arranged as follows: the horizontal axis is time, the vertical axis is some topics selected by the expert.
In fairly convenient visualization tools, we again see that the two axes are interpretable, unlike the maps that were shown at the very beginning.
There are already a lot of visualization tools for large text collections. A year ago, when I gave a report on this at the Data Fest, there were 170 of them. Now I looked - already 330. In a year their number doubled. People invest a lot of effort to come up with convenient ways to visualize large volumes of text. This can be used.
Let's fantasize about how the exploratory search should be arranged after all. What do we want? We cannot set requests in the form of short phrases. We do not know what we are looking for. And what are we pushing off then? If you think about it, then, as a rule, we have on hand some big text, some kind of collection of text. Maybe we didn’t even figure it out ourselves. There is a certain article. We just got rid of it by a colleague, we haven’t figured out anything yet, we don’t know how this article is positioned within the required field of science. First we want to see it. Therefore, the request is an arbitrarily long text - a large collection can be. And we want to understand what topics the request belongs to, what is known from them, besides our document. We want to understand what the thematic structure of this subject area is, which areas are adjacent for it and what to read in general first of all. This is a range of queries, search needs of the user who is engaged in self-education, trying to expand their knowledge in a particular area.
I would like this opportunity to be in any application where there is some text. I would like to understand on what topics this text is, and use it as a request - in order to immediately get a picture with the visualization of this subject area. Such is the dream of exploration. We do not even go to any Google or Yandex to fill something in the search box. We don't even have to do this. This search method should always be at hand, wherever there is an arbitrarily long text. Such is the dream.
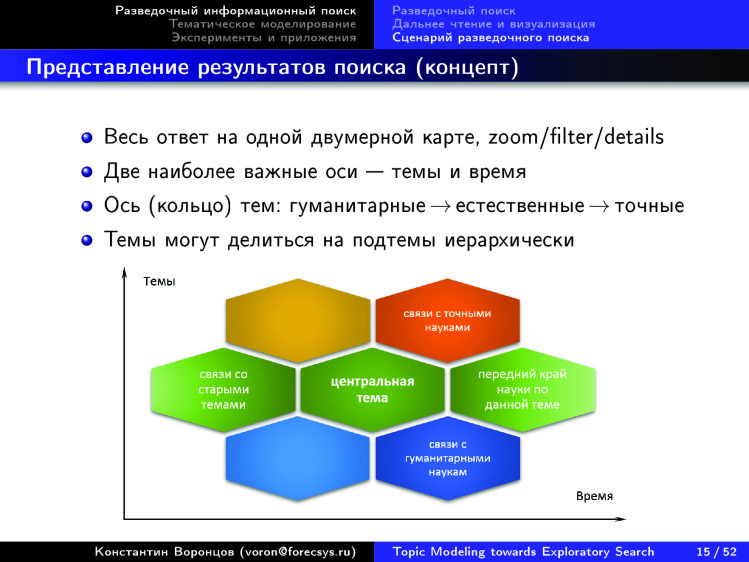
Here is a concept. It is clear that many in the world go to this dream in different ways. Someone, like me and my scientific group, from the point of view of mathematics, someone from the point of view of technology. How would we like this to be arranged? We already understood that it is very cool to visualize information in two axes: time-subject. It’s great if you can split up the topics into subtopics, have a large enough tree. Moreover, it is desirable that it be built automatically - so that there would not be any UDC consisting of 80 thousand points, invented by a community of tens of thousands of experts for over a hundred years. This human-supported structure is constantly becoming obsolete. This we do not need. With the help of information technology, we need to ensure that such structures are built on the fly, automatically, according to the content that is on the Internet.
We also noticed a remarkable feature: there is a cycle around the circle - humanitarian, natural, exact sciences. - - , , , , , — , — .
?
, . , , , . , Google, . -, — , , , . , . . . .
. ? This is an important question.
? . , . , , ? , — ? , . — , , , , — , . , . . , , . — -, .
, , 330 . — . Why? ? , , , , , , , , — . - , - , - , - . . , . , . . . , , , , .
? . , .
— . , ? , . , , , — , . , , . , .
, . , , . . — . , — . , — .
, , , — . , .
. : , , , , , . . , . , . , , , .
, , .
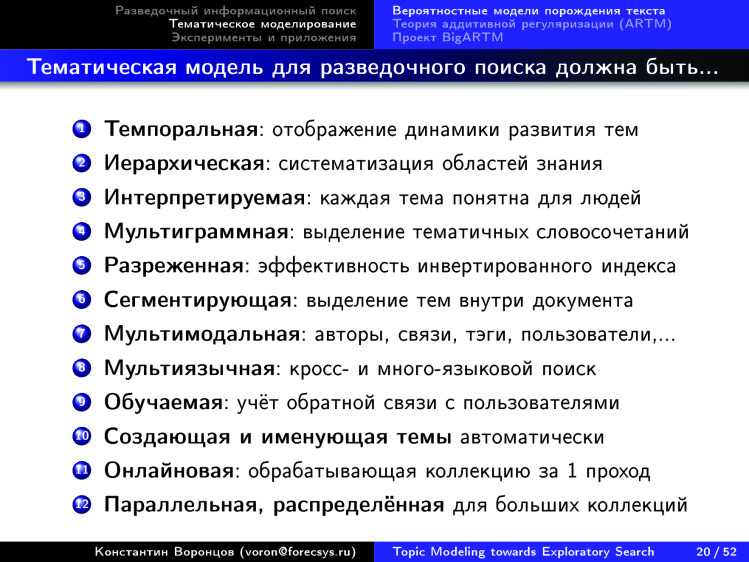
. , . , . , , . , « — », : « » « ».
, . , , , , .
. φ — , θ — .
, — . , , , , , Y . . , , .
— . « », , , . , . . , : , . , , , , . .
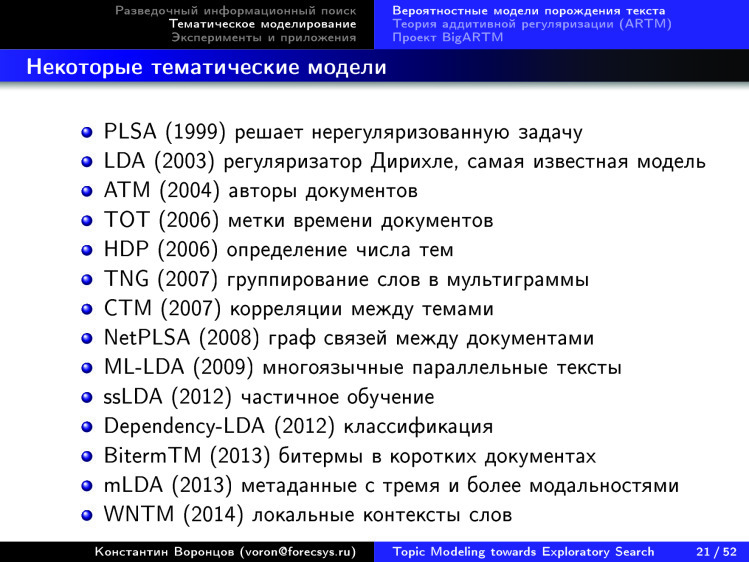
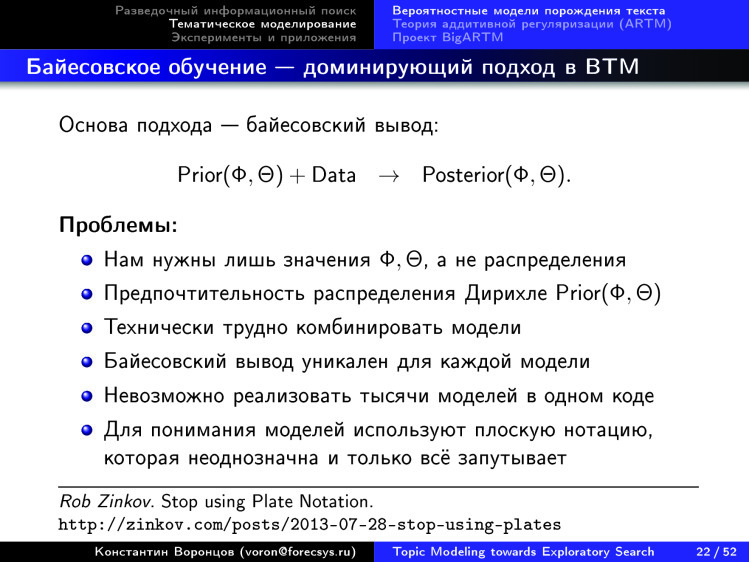
— , 1999 , . , , . 100% . - . , , 15 . , .
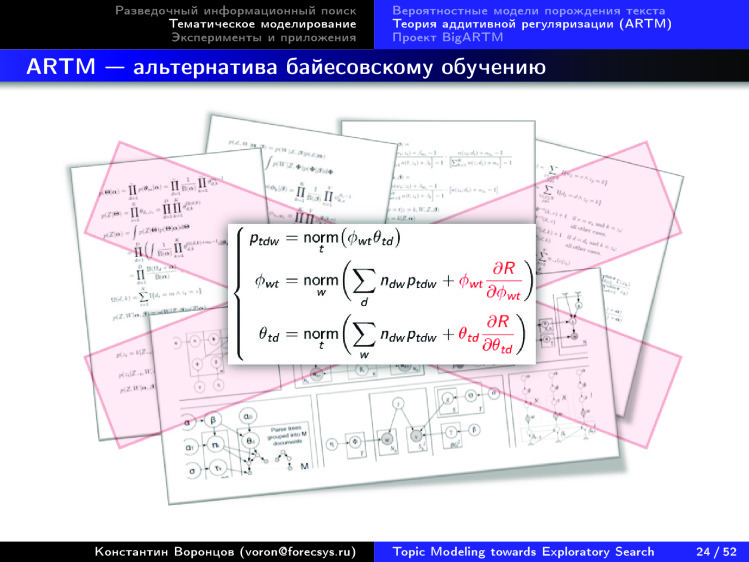
. , , . , , , φ θ, . — φ θ, , , .
. , , N-, -, , . — - , . - . , .
, , , , — .
. , , , . — .
- , - . , — φ θ.
, . , , , . . — , , .
, , , .
, . : , , , , - , , , . . - . , .
, - , . , — , , . - . , , .
. — BigARTM , - . — . , . — .
, : . , , .
, . , . , , , , , , MATLAB, , — , .
— ++, , . , , , . , . , .
Python, , .
, . 3,7 4,5 . 14 10 . — , .
, , — , .
— , . , , , , , , . .
, . , , .
, — -k .
, .
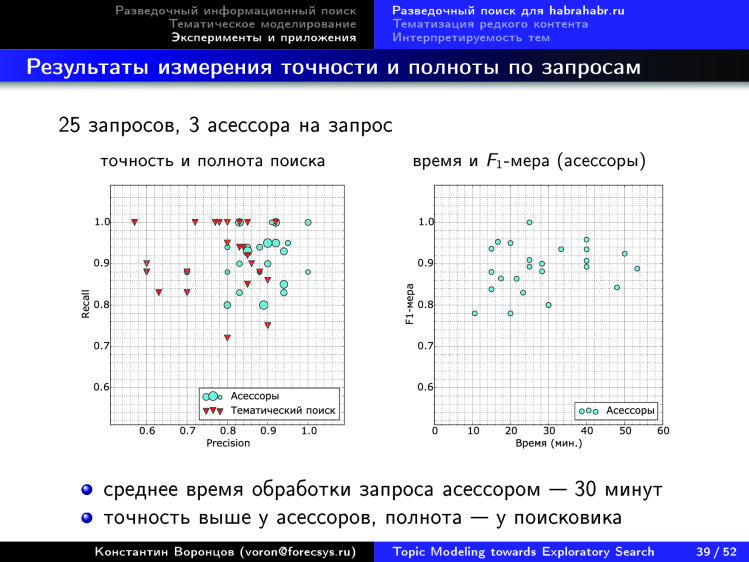
, , . , , 25 , : , . . , .
, , .
. ? 4. — .
, . , - . . [3D ] - 3D — .
. , , 25 .
.
, , , . , , .
, 200 . , , — . , , - .
. , . , , . Thanks for attention.
Source: https://habr.com/ru/post/313340/
All Articles