The logic of consciousness. Part 8. Spatial maps of the cerebral cortex
The purpose of this article series is to try to describe how the real brain works. Therefore, we are concerned not only with the performance of the proposed models, but also with their consistency with the facts that are known about the real brain and real neurons. In this part, we will talk about how the principles of spatial organization, peculiar to the proposed model, correspond to what is known about the spatial organization of the real crust.
At one time, Vernon Mountainth hypothesized that for the brain, the cortical column is the main structural unit of information processing. In the light of the described model, it is possible to concretize the functions of cortical minicolumns, the mechanisms of their work and the principles of interaction.
In the proposed model, we assume that the brain operates with information, which consists of discrete concepts. Each concept corresponds to a wave with a specific unique internal pattern. The wave carriers are presumably dendritic segments. According to the patterns that create information waves, spreading through any zone of the cortex, minicolumns of this zone receive an informational description of what is happening. The same information enters every minicolumn.
')
The concepts from which the original descriptions are formed are multivalued. This means that each of the concepts in the process of determining meaning can acquire a new interpretation. The interpretation of a concept is the replacement of the original concept with another, which reflects its meaning in a specific context.
Each minicolon bark is a processor of a specific context. The main function of a minicolumn is the recoding of the original description into its interpretation characteristic of this context. To do this, each minicolumn contains a memory for recoding concepts. This memory sets in accordance with the concepts of the original description of the concept, which are their interpretations in the context of a mini column.
Recoding occurs by changing the volume pattern of activity of the dendritic sections inside the mini column from one to another. From the pattern of the original concept to the pattern of its interpretation. The addition of patterns of interpretations of individual concepts within a mini-column creates a three-dimensional code, which is an interpretation of the original description in the context of a mini-column. Presumably, this volumetric code causes a hash transform, which results in the induced activity of neurons of the minicolumn. The code formed by synchronous spikes of neurons of the minicolon forms a request to the minicolumn memory.
Previously, a biological mechanism was shown, thanks to which each minicolon of the bark zone stores a complete copy of all the memories of this zone. As a result, the event memory is duplicated by the number of minicolumns. This duplication allows you to check the conformity of the interpretation that has arisen on the minicolumn and previous experience. Each minicolumn tests the hypothesis that its context is suitable for interpreting current information. The parallel operation of hundreds of thousands or even millions of minicolumns of the cortex zone allows for one information tact to check all possible interpretations of the initial information and, using the maximum correspondence with memory, to find contexts in which interpretations turn out to be most acceptable. The combination of such interpretations defines a set of meanings contained in the initial information.
In practice, many contexts are close in meaning. In this case, the procedure for choosing meanings should take into account the degree of closeness of contexts. From contexts that are close in meaning, only one context should be selected that is most suitable for interpretation. In this case, all fundamentally different permissible interpretations should be included in the final set of meanings. This problem is close in spirit to the problem of finding the best predicates for multiple regression and similar problems. Its solution requires knowledge of the degree of closeness of contexts, which can be obtained from monitoring the mutual activity of minicolumns. It seems that the structure of the horizontal connections of the cortex and synaptic plasticity are tools that allow you to create a “correlation matrix” of contexts. At the same time, the suppression of the activity of neurons belonging to the surrounding minicolumns (Mountcastle VB, “The columnar organization of the neocortex”) observed in the real cortex by actively responding neurons (Brain (Oxford University Press) 20 (4): 701-722.) manifestation of the mechanism of selection of the local maximum context.
To optimize the creation of the correlation space of contexts, the brain uses the spatial organization of minicolumns. The basic principle of spatial arrangement of minicolumns - contexts that are close in meaning and, accordingly, correlated in activity, should be located nearby in the space of the cortex. Usually, the structure of the proximity of contexts is quite complex and can only be displayed on a plane with a rough approximation. This does not allow determining local maxima in the context space only due to the criterion of proximity of minicolumns on the plane of the cortex. But horizontal axon connections between minicolumns, which, due to synaptic plasticity, adjust the strength of the connections, allow to reproduce the distances in a complex multidimensional context space. At the same time, the spatial organization of minicolumns allows optimizing both the number of required axonal connections and their length.
Self-organization mechanisms in real cortex
Earlier it was noted that adaptation methods like Kohonen self-organizing maps (T. Kohonen, Self-Organizing Maps, New York, 2001) are not suitable for spatial organization of contexts. The task is not to form the space of detectors with a smooth transition of the vector of the feature description, but to arrange discretely defined elements on the plane in accordance with a certain measure of their proximity. As we showed earlier, such an arrangement can be obtained using an algorithm based on pairwise permutations of elements.
In a real crust, minicolumns cannot physically move. Accordingly, if we assume that spatial self-organization in the cortex can use the permutation method, then we will have to assume that these permutations are purely informational. The information rearrangement of minicolumns is the replacement of the sets of transformation rules that determine their context, the transfer of this information from one column to another and vice versa.
However, it is doubtful that there was a mechanism for rewriting all the context information from one mini-column to another. Even if you solve the problem of sequential extraction of all information stored in a minicolumn, and decide how to write it to another minicolumn, then the rate of such an exchange will be very low. It is unlikely that in the process of evolution, if the brain really followed the path we assumed, no simpler and faster mechanisms would emerge.
The solution is seen in the use of the holographic principle already familiar to us. In our assumptions, each minicolumn (or a group of neighboring minicolumns) stores its complete copy of the memory characteristic of the area of the cortex to which this minicolon belongs. That is, memory is repeatedly duplicated on each zone of the cortex. This is necessary so that each minicarrier has access to its copy of memory independently of the other minicolumns. The availability of such access allows each minicolumn to check whether its interpretation is consistent with previous experience. It is possible to go further and assume that each minicolumn stores not only its own set of contextual transformations, but all existing sets for all possible contexts. Then each minicolumn can be assigned its own identifier of a specific context and require that the transformation rules of this context be used by the minicolumn in its work. The computational scheme of such a minicolumn is shown in the figure below.

The context module schema. The transformation memory stores transformations for all contexts. The context ID determines which rules will be used by this module.
With this approach, it is possible to quickly and painlessly “swap” the mini speaker. For this, it suffices to swap their context identifiers. Under such assumptions, spatial self-organization of the real crust turns out to be a fairly simple procedure:
- For some time (for example, during the day) there is an accumulation of experience of joint triggering of contexts. The synaptic weights of the corresponding connections are corrected.
- The organization procedure starts (this can happen, for example, during sleep). Due to the information about the strength of synaptic connections, the expediency of moving certain minicolumns is determined. If this leads to system optimization, a move is made.
- Since one movement is carried out per step of a minicolumn, the inherited synaptic weights can be used as an initial approximation for a new context.
Spatial organization of the primary visual cortex
The primary visual cortex V1 is especially convenient for studying, as it allows using simple methods to trace the connection between the activity of neurons and the stimuli supplied to the retina. In this case, it is possible not only to trace the stimuli that excite certain neurons, but also to construct maps of the spatial distribution of neurons that are activated by similar stimuli.
V1 neurons are known to respond by spikes to presenting certain visual stimuli (Hubel, DH & Wiesel, TN Receptive fields, binocular interaction and striking cortex. J. Physiol. (Lond.) 160, 106–154 (1962) .) (Hubel, DH & Wiesel, TN Receptive fields and functional cortex. J. Physiol. (Lond.) 195, 215–243 (1968).). To obtain the response of the neuron V1 stimulus must be presented in a certain place of the retina. This place is called the receptive field of the neuron. The stimulus itself can be a border, a thin white or thin black line, the end of a segment. Some cells actively respond to the appearance of an appropriately oriented stimulus in a particular place. Such cells are called simple. But for most neurons, the maximum response is achieved when the stimulus delivered is not only appropriately oriented, but also moves in a certain direction. These cells are called complex.
For a number of animals, primates, cats, and many others, there is a well-defined pattern in the spatial distribution of preferred orientations of neurons (Hubel, DH & Wiesel, TN Sequence cortex. J. Comp. Neurol. 158, 267–294 (1974).). The map of distribution of preferred orientations can have the form shown in the figure below.
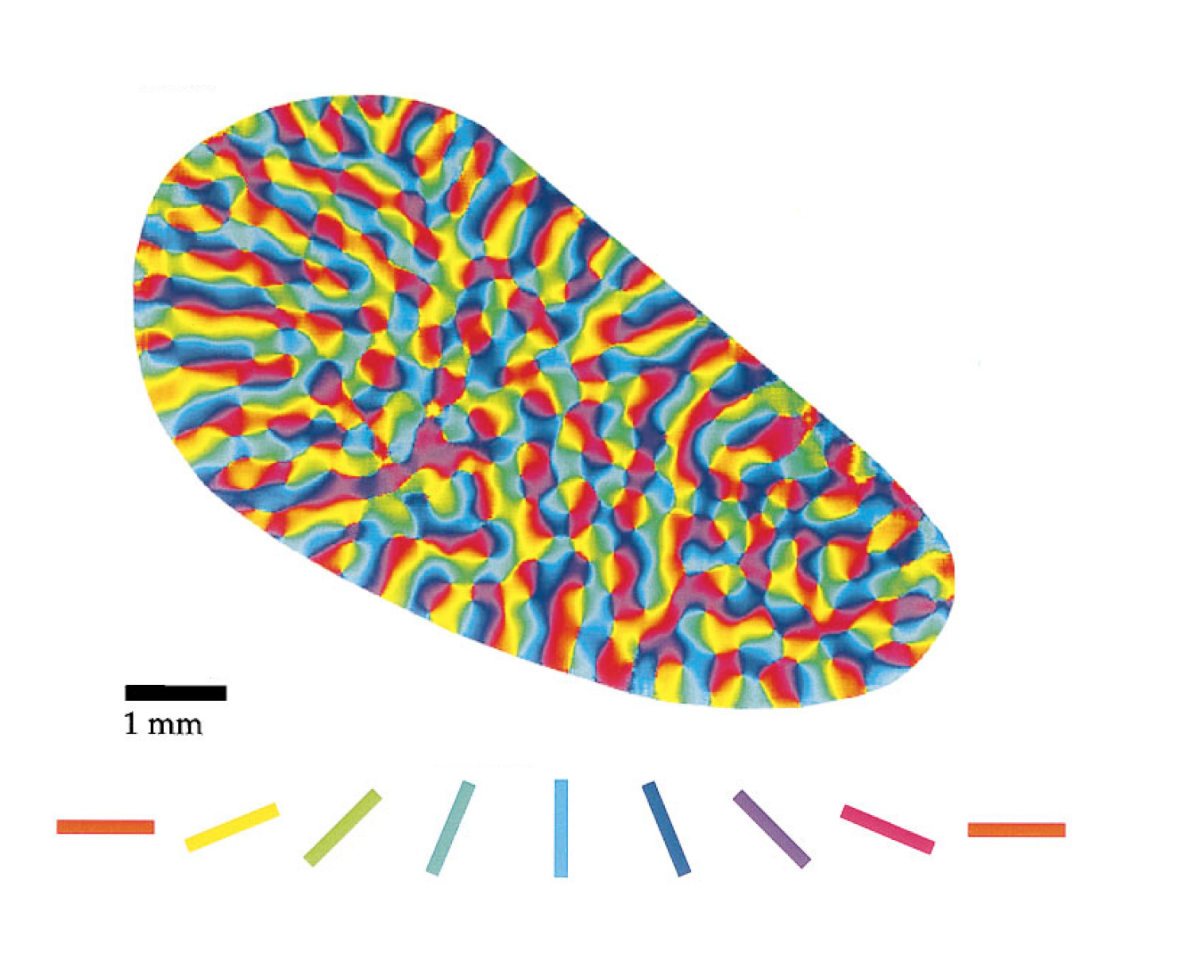
Map of Preferred Orientations V1 Tupayi (Tree Shrew) (Orientation Selectivity and Shine Strike Cortex), William H. Bosking, Ying Zhang, Brett Schofield, and David Fitzpatrick, The Journal of Neuroscience, March 15, 1997, 17 ( 6): 2112–2127)
Depending on which eye stimulation causes the strongest response, ocular dominance maps were made. An example of such a card is shown in the figure below.
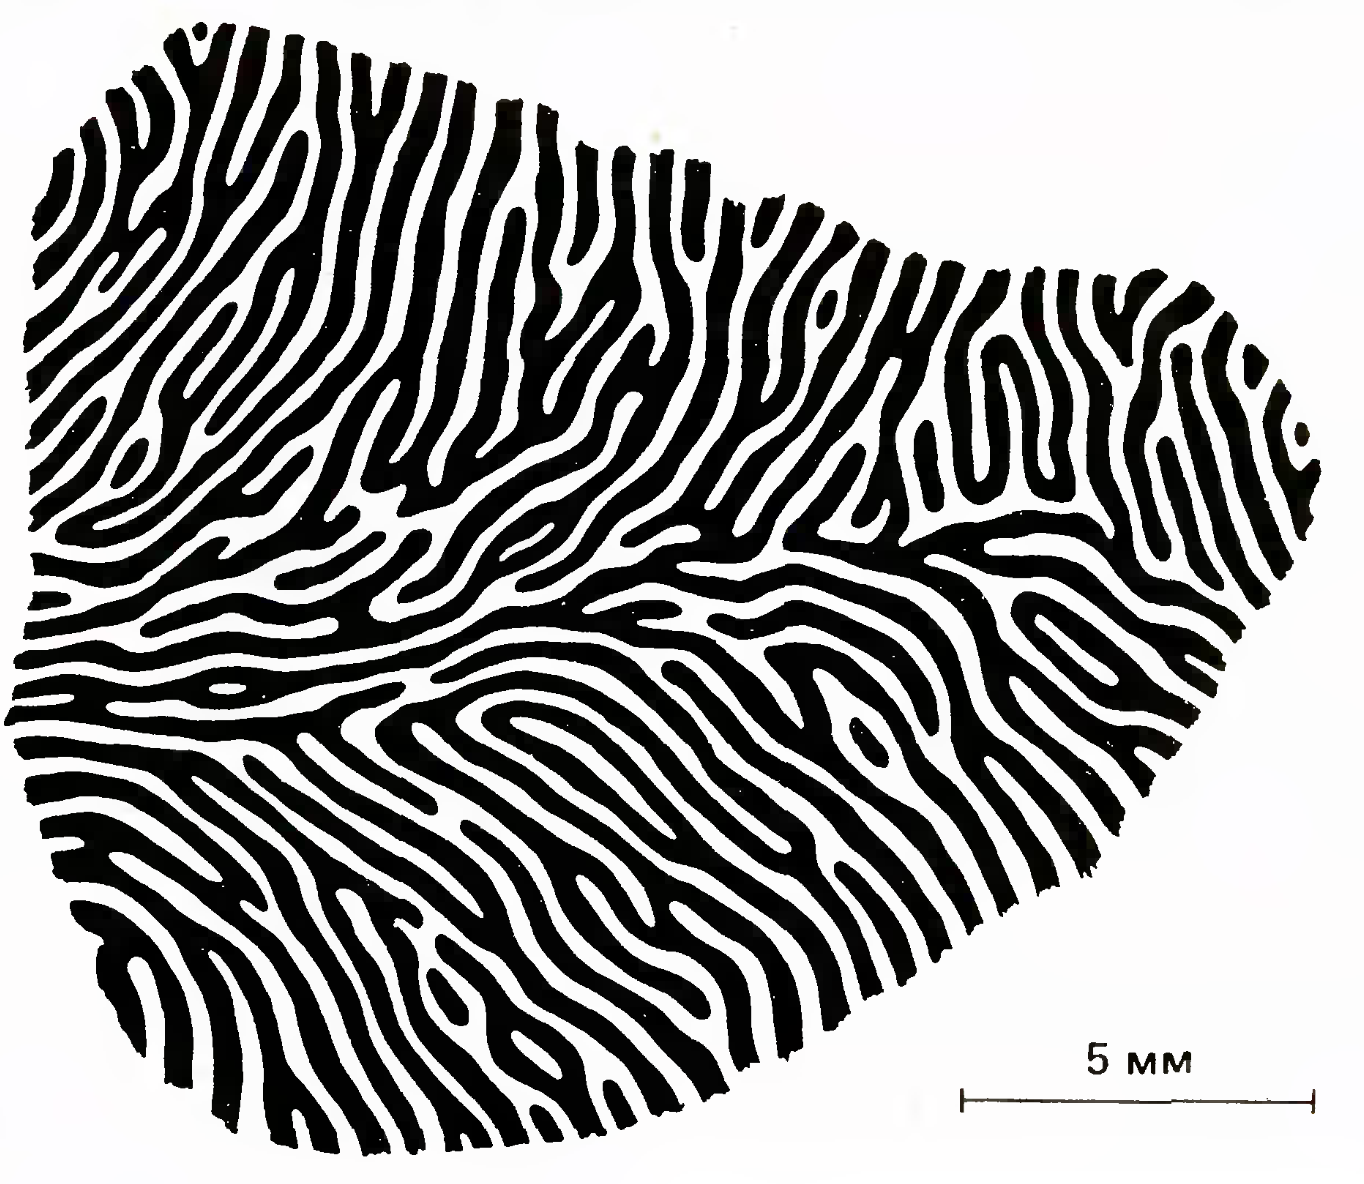
Map of Eye-dominance Columns (Simon LeVay, David H. Hubel, and Torsten N. Wiesel, J. Comp. Neurol., 159, 559-576)
It is quite natural that the presence of a connection between the activity of neurons and the stimuli presented suggested that the V1 neurons are detectors of images appearing on the retina. At the same time, simple cells detect immobile elementary images, and complex cells determine the same images regardless of their position, apparently based on signals from simple cells. At the same time, the function V1 itself was seen as the decomposition of the original image in the space of elementary detectors, to some extent, invariant to shift. Further it was implied that from such a signal set it is possible to somehow detect more complex visual objects.
If we follow our model, the evoked response of neurons to stimuli should not be interpreted as a direct result of detection. The activity of neurons is the appearance in the minicolumn of a certain code accompanying the process of testing the hypothesis that the context of this minicolumn is most successful for interpreting the stimulus given. That is, we can say that the induced activity of neurons is not the result of the detection of a simple stimulus, but an artifact of checking the corresponding hypothesis by the minicolumn. In other words, when a neuron is active, it does not mean that the neuron "saw" the characteristic stimulus for it. Activity means that in the context peculiar to the mini column, something previously seen was recognized, and this neuron took part in the creation of the corresponding code that appeared on the neurons of the mini column.
Since one of the parameters of the visual context is a reversal of the image, it can be assumed that each mini-column may have its own rotation parameter. This parameter can be interpreted as the rotation of the “current image”, which the minicolumn does before checking it for a match with the memory. This may mean that it is in “such a turn” that the mini-column best “recognizes” the images stored in memory or the factors selected from them. Accordingly, the appearance of evoked activity may be due to the fact that the general orientation of the image coincided with the orientation inherent in the context of the mini-column.
If we assume that minicolumns perform the functions of contextual modules, then V1 should be considered as the space of all sorts of visual contexts. The visual context is a definite transformation of the description of the original image. As a result of the transformation, a description is obtained that corresponds to what the original image would look like after such a transformation. The most obvious transformations are the horizontal and vertical displacements, as well as the rotation of the image. Contexts in this “obvious” case are all sorts of combinations of offsets and turns.
The algorithm of the work of the cortex with three contextual parameters is as follows:
- Knowing the rules for converting descriptions, each of the contexts displaces and rotates the original image as prescribed by the rules of the context.
- As a result, a variety of transformations are obtained for the original image in all possible displacements and rotations.
- In each of the transformations, a check is made to see if the transformed image is similar to something previously seen.
In such a presentation, the operation of the cortex corresponds to the operation of convolutional networks (Fukushima, 1980) (Y. LeCun and Y. Bengio, 1995). In convolutional networks, the planes of simple cells perform the functions of contexts; they are responsible for “knowledge” of how the image changes during the shift. The memory functions are performed by layers of complex cells that store convolution kernels. Traditional convolutional networks “know” the transformation rules for horizontal and vertical biases, but the principle itself can be applied to more complex transformations, for example, to rotate (Exploiting Cyclic Neural Networks, Sander Dieleman, Jeffrey De Fauw, Koray Kavukcuoglu, https : //arxiv.org/pdf/1602.02660.pdf ).
To test the hypothesis that the striated cortex is a context space, computer simulation of the spatial distribution of the main visual contexts was performed in accordance with the principles of self-organization described earlier ( http://www.aboutbrain.ru/programs/ ).
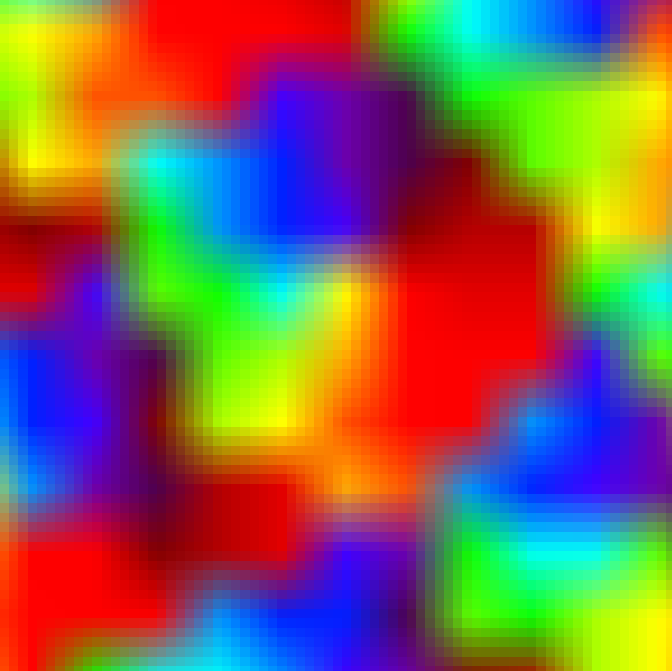
The figure below shows the simulation results for contexts with four parameters. The first parameter - sets the turn, the second and third - the offset, the fourth - eye dominance. For self-organization, a measure of the closeness of contexts was introduced, starting from the similarity of their parameters. At the same time, when determining the proximity by the rotation parameter, its circular nature was taken into account, that is, for example, the difference between 0 and 270 degrees is 90 degrees.
Initially, a set of contexts was defined, describing all possible transformations. After spatial self-organization, the contexts are lined up so that by the shift parameters they form an approximate similarity of the two-dimensional correspondence of the visible visual area (fragments 2.3 in the figure below). At the same time, according to the rotation parameter (fragment 1 of the figure below), due to the annular proximity, the contexts are lined up in “pinwheels” (pinwheels), similar to what is observed in the visual cortex of some animals.
According to the eye-dominance parameter (fragment 4 of the figure below), which assumed only two values, a map was formed, which can be compared with the maps of the eye-dominant columns in the real crust.

Spatial location of contexts as a result of self-organization (link). 1 — orientation map, 2 — X displacement map, 3 — Y displacement map, 4 — ocular dominance map.
Below is a fragment of the context self-organization map. All contexts on it have similar horizontal and vertical offset parameters and at the same time cover the entire possible range of variations in rotation. Such a set of contexts can be compared with the macrocolumn in the understanding of Mountcastle ((Brain (1997), 120, 701–722, The columnar organization of the neocortex, Vernon B. Mountcastle).
The traditional presentation attributes detection functions to minicolumns. Accordingly, for the visual cortex, the macrocolumn is obtained by a set of detectors responsible for one retinal position and covering all possible orientations. In our approach, minicolumns are contextual modules. They do not detect a simple image, but perform much more complex functions.
The area includes a set of contexts with different orientations
It should be noted that the ordering of contexts by the parameters of horizontal and vertical shear (fragments 2 and 3) creates a certain spatial correspondence between the retina and the visual cortex, which is commonly called retinotopy. This correspondence is usually explained by the preservation of the relative position of the nerve fibers throughout the visual pathway. But, it can be assumed that the main contribution to retinotopicity is made by the self-organization of contexts, which builds them in accordance with the spatial coordinates.
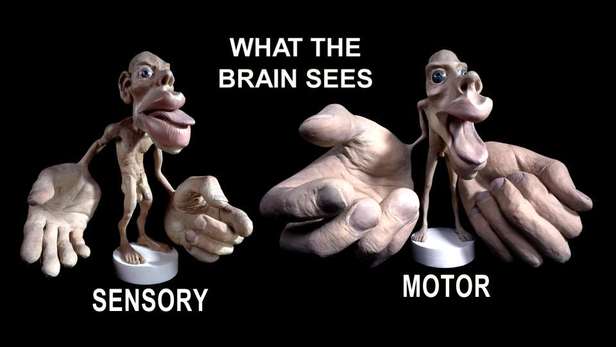
By the way, the appearance of maps of the motor and sensory cortex, known as the Penfield man (Penfield, W. & Rasmussen, T., The cerebral cortex of man) can be explained in a similar way: Macmillan, New York, 1950 ). The title picture shows little men whose sizes of body parts correspond to the area of the corresponding areas of the sensory and motor cortex.

Penfield Man on the cortex
As we said earlier, to determine the local maximum in the context space, it is not enough to take into account only spatial proximity. Knowledge of the mutual correlation of contexts is also required. Actually, spatial proximity is only a tool to optimize the length and number of links connecting contexts of similar meaning. This correlates well with the evidence that the horizontal connections of the neurons of the striatal cortex predominantly unite neurons with the same orientational preferences (Gilbert CD, Wiesel TN (1989)). J Neurosci 9: 2432–2442 .) (Malach R, Amir Y, Harel M, Grinvald A (1993)): Proc Natl Acad Sci USA 90: 10469 –10473. ).
The figure below shows that the structure of the horizontal connections of the real crust covers the nearest space along linear coordinates and areas more distant along the coordinates, but close in the rotation parameter.

The structure of horizontal connections of a region with a specific orientation superimposed on a map of similar orientation preference (Orientation Selectivity and Shine Strike Cortex, William H. Bosking, Ying Zhang, Brett Schofield, and David Fitzpatrick, The Journal of Neuroscience, March 15 , 1997, 17 (6): 2112–2127)
In modeling, a hypothetical link structure based on the proximity of contexts can be reproduced by highlighting contexts that are highly correlated with the selected one (figure below). The picture obtained corresponds well to the structure of horizontal bonds in the real crust. It also shows high density in the immediate environment and selective density with contexts of similar orientation in distance.

Examples of the distribution of contexts correlated with the selected. The selected context is indicated by a red dot (http://www.aboutbrain.ru/programs/).
In a real visual cortex, horizontal connections are extended along specific directions (Orientation Selectivity and Shine Strike Cortex, William H. Bosking, Ying Zhang, Brett Schofield, and David Fitzpatrick, The Journal of Neuroscience, March 15, 1997, 17 (6): 2112–2127) (figure below). This interesting fact can be explained in our approach. We assume that horizontal relationships reflect the structure of context correlations. Correlation of contexts manifests itself in obtaining real visual experience, when the respective contexts jointly show high activity. But in the real world, most of the surrounding images contain a large number of elements with long straight lines. Due to this, the likelihood of activating the advising contexts is greatly increased, which may be the reason for the described phenomenon.
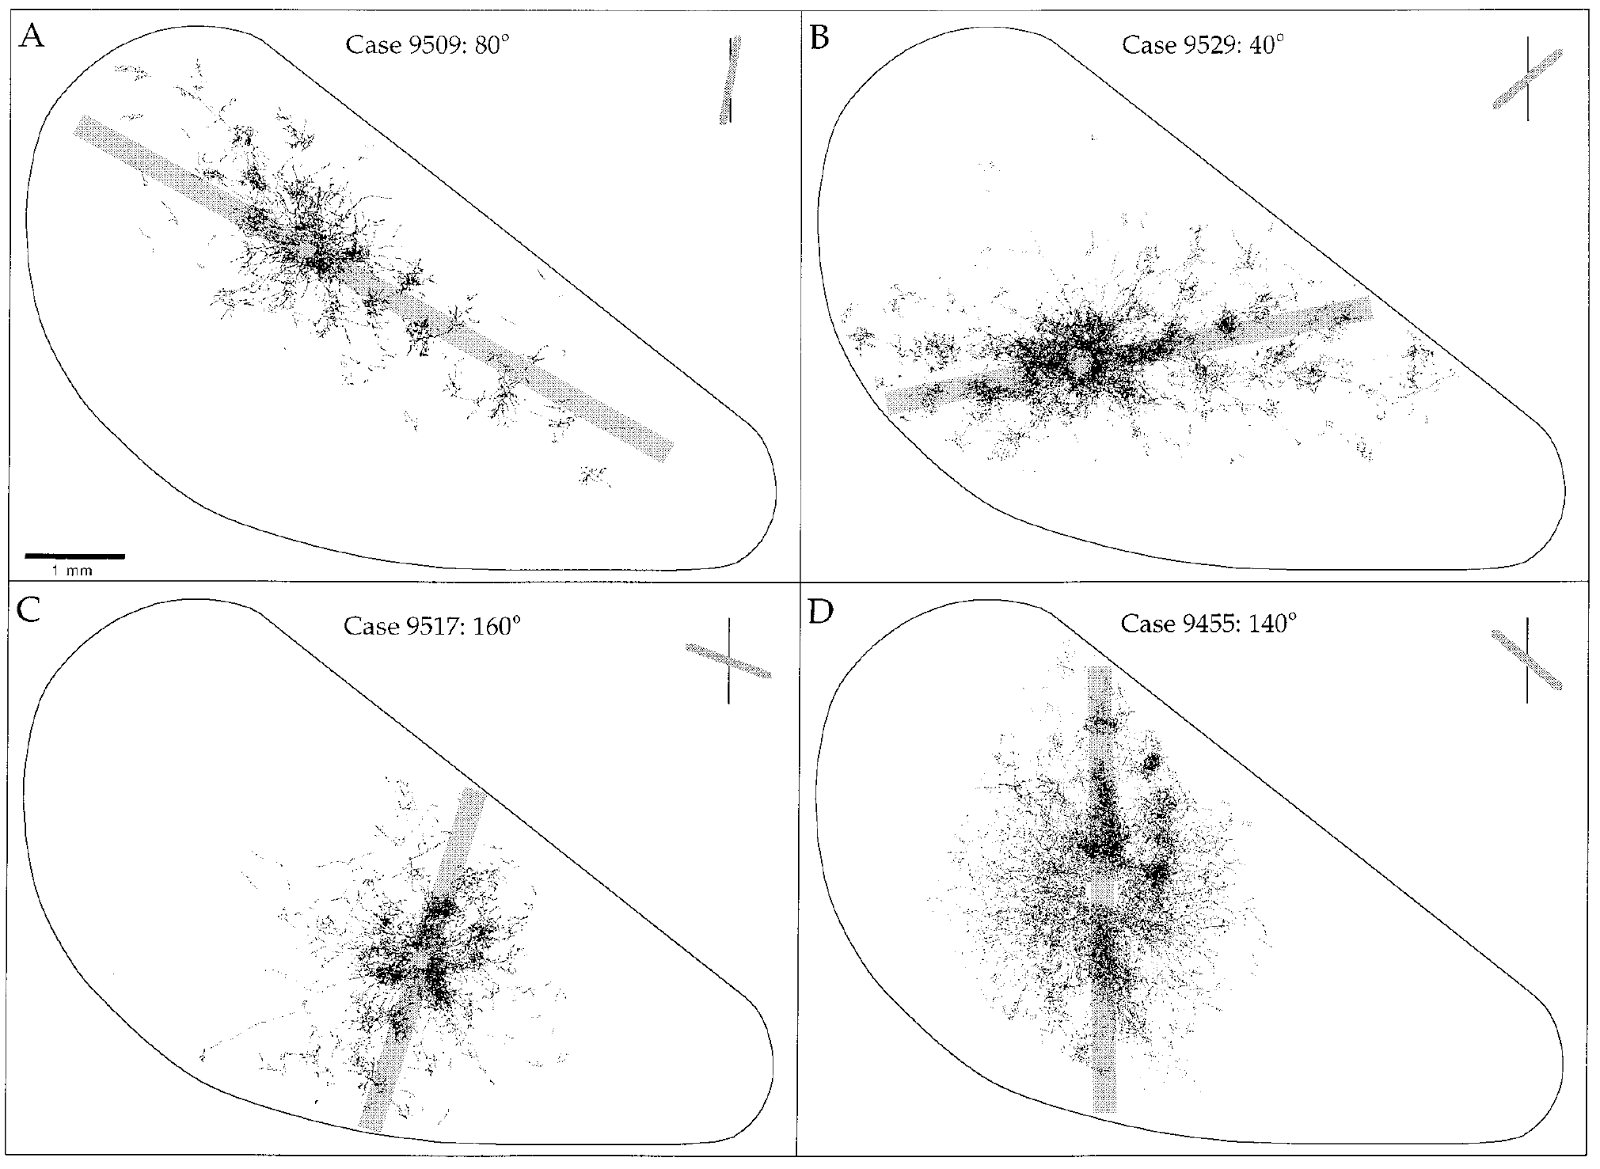
The dependence of the elongation of the cloud of horizontal connections on the preferred orientation (Orientation Selectivity and Shine Striate Cortex, William H. Bosking, Ying Zhang, Brett Schofield, and David Fitzpatrick, The Journal of Neuroscience, March 15, 1997, 17 (6 ): 2112–2127)
Variants of the spatial organization of the visual cortex
When building a model of the work of the neocortex, it is very tempting to assume that the general principles of its operation, on the one hand, are the same for different zones of the cortex, on the other hand, they are the same for different animal species. Actually, from this assumption comes our model. Accordingly, the principle of uniformity implies that in similar conditions in different animals the same areas of the cortex will exhibit the same properties. However, in rodents, the properties of the primary visual cortex are very different from what was described above. Although neurons of the visual cortex of rodents and show orientation preferences, they do not form any ordered spatial structure, but are randomly arranged according to the principle of salt and pepper (Ohki K, Chung S, Ch'ng YH, Kara P, Reid RC: Functional imaging with cellular resolution reveals precise micro-architecture in visual cortex. Nature 2005, 433: 597-603.). The picture below shows the difference in the distribution of orientational preferences for cats and rats.

On the left is the orientation “spinner” in the cat's visual cortex (Ohki K, Chung S, Kara P, Hu Bener M, Bonhoeffer T, Reid RC: Nature 2006, 442: 925-928. ), on the right - the distribution of preferred orientations in the rat visual cortex (Ohki K, Chung S, Ch'ng YH, Kara P, Reid RC: Functional imaging with physical resolution), Nature 2005, 433: 597- 603.)
Within our model, it can be assumed that this difference does not indicate a fundamental ideological difference in the work of the primary visual zones in different animals, but rather is a consequence of the difference in some of the “settings” characteristic of these zones. So, we can assume that the main difference lies in the number of those contextual parameters that determine the structure of the contexts of these visual zones.
Determining the preferred orientation for neurons located vertically under each other in the cortex of rats shows that they lack a single preference (picture below) (Rayceptive Field Properties of Neurons in Rat Primary Visual Cortex, Sergej V. Girman, Yves Sauvé, Raymond D. Lund , Journal of Neurophysiology Published July 1, 1999 Vol. 82 no. 1, 301-311 DOI :). The absence of orientation preferences in neurons in minicolumns and, accordingly, the absence of any spatial pattern associated with orientation in our model means that the rotation in the striated rodent cortex is absent as a context parameter. At the same time, there is an orderliness of minicolumns according to coordinates, which is commonly called retinotopicity, which indicates the presence of two coordinate contexts.
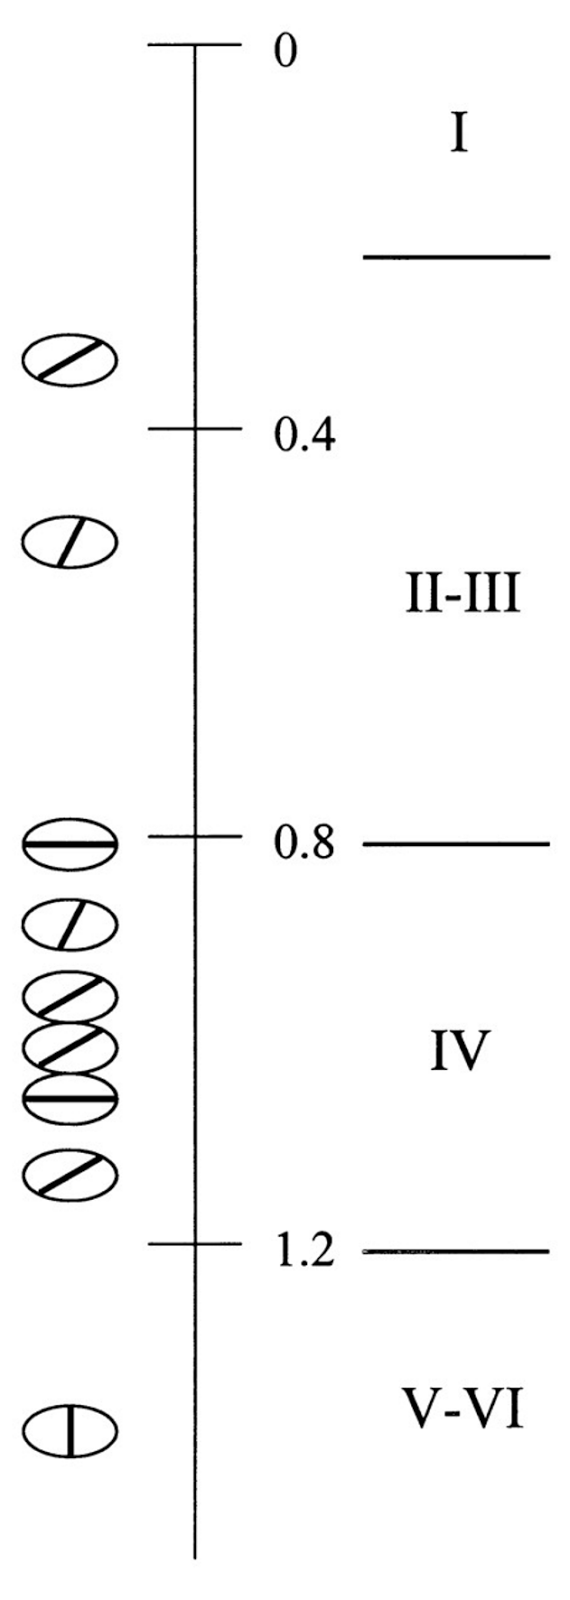
Scatter of preferred orientation for neurons of one minicolon of the primary visual cortex of the rat , 301-311 DOI :)
The number of minicolumns in the cat's streaky bark is about 160,000 (The Cat Primary Visual Cortex, Bertram Payne, Alan Peters, Academic Press, 2001). If we assume that this number is distributed between four parameters: eye dominance, horizontal displacement, vertical displacement and rotation, then this approximately corresponds to the ratio 2x43x43x43. This is a very rough estimate, most likely far from reality. The aggregate visual cortex, in addition to descriptions related to borders, processes a lot of other information, for example, information about brightness, color, depth of space, and movement of objects. All these parameters are distributed between the striatal and extrastriatal cortex. A bark of a cat, with 160,000 contexts, allows one to obtain quantization by a single parameter with a level of about 40-45. For different animals with a decrease in bark size, the physical dimensions of minicolumns remain approximately unchanged. Accordingly, the total number of minicolumns decreases. This should be accompanied by a decrease in the number of levels of quantization of the context, which is possible and observed during the transition from primates to cats and from cats, for example, to stupid. But, when the quantization level reaches a critically low value, then it seems that a failure occurs at the level of the striatal cortex from one of the parameters, the rotation parameter. This does not mean that the handling of invariance to rotation disappears. Apparently, the turning contexts move to another zone of the visual cortex and are processed there. Rodents have striatal bark somewhere an order of magnitude smaller in area than cats.It can be assumed that at such a size the rejection of the context parameter associated with the rotation occurs.
Now we will try to explain in more detail the nature of the evoked activity of the neurons of the visual cortex, which is observed upon presentation of stimuli of a certain orientation.
It can be assumed that a certain set of features is distinguished in the striatal cortex, convenient for further description of images (the principles of feature selection will be described later). This may be something similar to the Haar features (figure below) used in computer image recognition (Viola and Jones, “Rapid object detection using a boosted cascade of simple features”, Computer Vision and Pattern Recognition, 2001). In fact, such signs describe oriented fragments of borders, lines and ends of lines.

Example of Haar primitives (Viola and Jones, "Rapid object detection using a cascade of simple features", Computer Vision and Pattern Recognition, 2001) There
are two ways to work with such features. You can talk about the basic images (border, line, end of line) and indicate what is their orientation and position. And it is possible for each basic image to have as many primitives in different rotation variants as possible orientations at a given level of quantization, and indicate specific primitives and their place on the retina. If we transfer this to the ideology of contexts, we get two descriptions of the description:
- Base image (excluding rotation and coordinates). Rotate and coordinates - context options;
- Primitive (version of the base image in one of the turns). Coordinates are context parameters.
That is, to create a description, we need to specify the concept and context of its interpretation. In the first case, we use more general concepts (basic images) and the context specifies their rotation and coordinates, and in the second case, we use a wider set of concepts (each variation in rotation of the basic images), and only the coordinates are specified in the context. The first case may correspond to the bark of primates and cats, the second bark of rodents.
Direct use of the Haar primitives is rather hard on the description. This is convenient for methods that are undemanding to accuracy, which in this case can work with a rough description without further consideration of contextual hypotheses. You can increase the accuracy of the description if you use an extended set of primitives, which will include small variations in the shift of the base images horizontally and vertically. We will proceed from the fact that the brain works with such an expanded set.
In each context, there is information about how basic images look. This, presumably, is due to the generalization of real visual information and the selection of the most informative factors from it. It can be assumed that in the case when the core has a turning context, these images are highlighted so that their main orientations coincide with each other.
In our concept, the activity of neuron minicolumns is the formation of a code of a trait detected in the context of a minicolumn. It can be assumed that the signs for the primary visual cortex are images like the Haar primitives in different variations of the shift. For the cortex, where there is a contextual rotation parameter, the signs will be invariant to the rotation. For the cortex without the context, the rotation of the signs will be more, they will include the variations obtained during the rotation.
For the cortex with the context of rotation, the activity of the neurons of the minicolon will manifest itself when the position and orientation of the stimulus correspond to the context of the minicolon. In addition, each neuron can participate in codes of different signs. If for such a neuron to move the stimulus of a suitable orientation along the receptive field, it will give an answer every time when the minicolon finds a sign in the code of which this neuron is present. It is possible that something similar is observed in real experiments. It can be assumed that the diversity of the types of traits secreted by the cortex gives rise to the observed variants of reactions of the neurons of the ventricular cortex.
For a cortex without a turning context, the preferred response of neurons to orientation may be due to the uneven participation of these neurons in the codes of signs of different orientations. Such irregularity can occur, for example, when the number of signs is relatively small and for one neuron one has to participate in just several codes. Then it is likely that there will be a shift towards any orientation. Or unevenness may occur if the codes themselves are characterized by a certain regularity. For example, if feature codes have the properties of Gray codes (F. Gray. Pulse code communication, March 17, 1953 (filed Nov. 1947). US Patent 2,632,058), that is, similar binary codes correspond to similar features.In any case, such a reaction to the orientation of the stimulus will be individual for individual neurons and will not be the same for the entire mini column.
Earlier we said that audio information can be presented through the description of its spectral portrait. To do this, you need to choose a time period of such duration that it would fit the sound images of interest to us. Split it into equal elementary intervals. For each interval to obtain the spectrum of the signal, which will consist of the amplitude and phase values for a fixed set of frequencies. Perform quantization of amplitude and phase values. The set of concepts needed to describe an arbitrary waveform is all possible combinations of amplitude, phase, frequency, and time slot numbers. To get a description of the sound signal within the selected time interval, you can discard the amplitude values, the value of which is close to zero, and the rest can be written as an enumeration of the corresponding concepts.
For continuous audio stream, it is convenient to use a cyclic time slot identifier. Each new time meter receives an identifier from an ordered sequential set of identifiers. When the sequence of identifiers ends again, the first identifier is issued and a new cycle begins. In this case, the same signal can have a different description in terms of depending on what time interval it had to be.
The main parameters defining contexts for audio information are the overall volume level, the time shift, the frequency offset, and the time scale change. Spatial self-organization of these contexts should lead to the formation of maps with a certain internal ordering. By analogy with the visual cortex, this ordering in the real sound cortex should appear through the appearance of distribution maps of the preferred response of neurons to certain characteristics of sound stimuli. Two types of such distributions have been studied quite well. The first distribution is called tonotopy (Tonotopy) and is related to the frequency that causes the strongest neuron response (figure below).
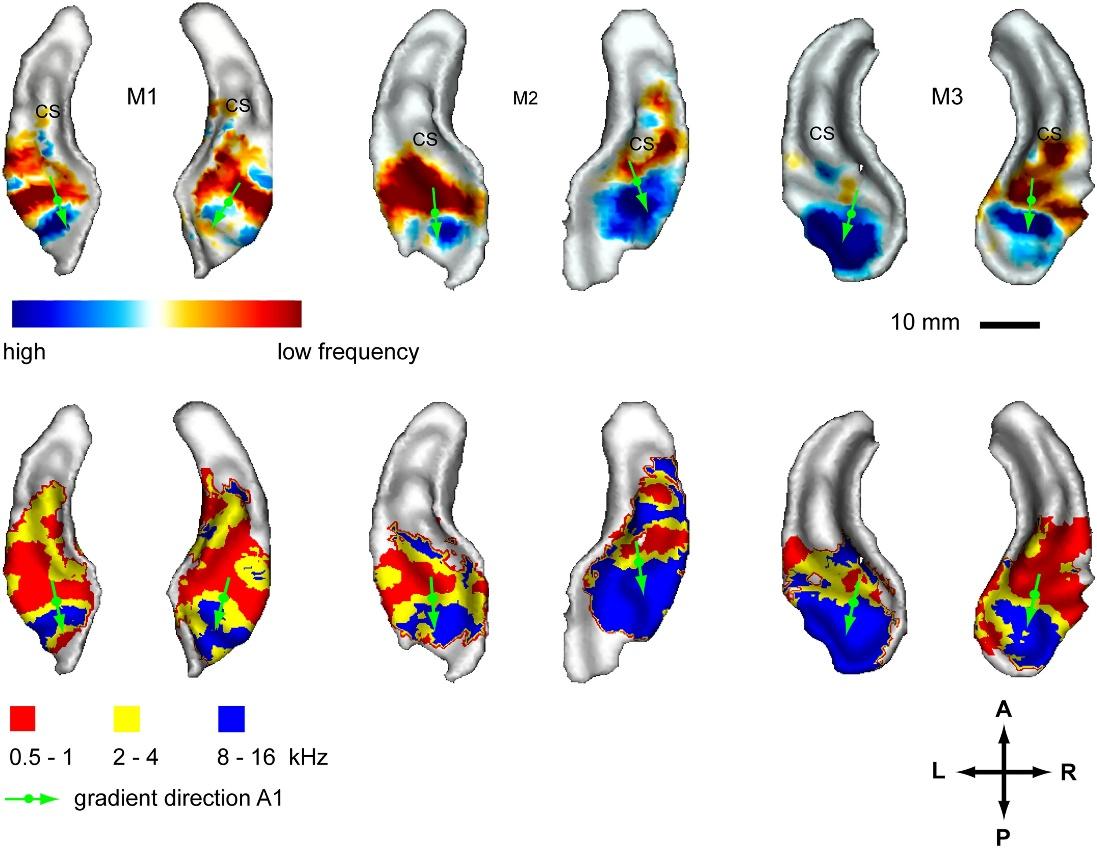
Frequency maps for three different monkeys. Top row: Contrast card between high and low tones, bottom row: Neuron-preferred frequency map (Simon Baumann Olivier Joly Adrian Rees Christopher I Petkov Li New York, Newcastle University , United Kingdom; University of Oxford, United Kingdom; DOI: dx.doi.org/10.7554/eLife.03256 ) The
second type of distribution is called periodicotopy (Periodotopy). This distribution is associated with the response of neurons to sound signals modulated in amplitude by a signal of a lower frequency. The preferences of the neurons relative to the period of the modulating signal form the distribution map (figure below).

. : , : (The topography of frequency and time representation in primate auditory cortices, Simon Baumann Olivier Joly Adrian Rees Christopher I Petkov Li Sun Alexander Thiele Timothy D Griffiths, Newcastle University, United Kingdom; University of Oxford, United Kingdom, DOI: dx.doi.org/10.7554/eLife.03256 )
By analogy with the visual cortex, these maps can be interpreted as artifacts of minikolonok when testing the relevant contextual hypotheses. At the same time, the map of tonotopicity may be a consequence of the organization of the crust by the frequency shift parameter. And the period-period map is the result of the distribution of contexts by the parameter of the time scale. The time scale implies such a conversion of the audio signal, which corresponds to the acceleration or deceleration of the speed of sound. An example is the change in speech rate. The change in tempo corresponds to an increase or decrease in the frequency of the envelopes of the signals while maintaining the frequency of the carrier signals.
Most bark mapping results are obtained through the BOLD (Blood Oxygenation Level Dependent) measurement, that is, by analyzing the dynamics of the oxygen level in the blood, which is directly related to neuron activity. Accordingly, the spatial resolution of such measurements is relatively small and speaks not about the activity of individual neurons, but about activity in a particular region. This suggests that in the auditory cortex on a small scale there may be “spinners”, similar to orientation “spinners” in the striatal cortex, associated with the time shift parameter, which, like the orientation, has a cyclic nature.
Dynamic restructuring of context maps
The ability of minicolumns to switch context allows one to describe a possible mechanism for the spatial organization of the real crust. In addition to self-organization, the ability to switch context can be used to create sufficiently advanced information algorithms.
The computational complexity of algorithms is estimated by two criteria: “temporal complexity” and “spatial complexity”. The time complexity estimates the expected time of the algorithm. Sometimes the estimated work time is at worst. If the calculations allow parallelization, then the time complexity begins to depend on the number of computing modules available to us. In this case, acceleration is possible only until the number of available computing modules equals the number of parallel threads required by the algorithm. Modules for which there were not enough threads will be idle and will not affect the acceleration. In our case, computing threads are contexts. If the number of minicolumns is sufficient to cover the whole context space, then the calculation of the meaning can be made in one measure.
Spatial complexity is the memory space required by the algorithm. In many cases, it is possible to significantly speed up the time of the algorithm by increasing its spatial complexity. In this case, one has to take into account not only the requirements for the memory size required for data storage, but also the ability of the computing module to quickly access this memory. In our case, we have already encountered the fact that in order to effectively determine the meaning of each minicolumn it is required to have its own copy of the memory of previous events, and for a fast spatial organization they have to keep the transformation rules not only of their own, but of all other contexts. Such memory requirements are not universal dogmas, but are associated with the features of the computing architecture used.
In the case of a real crust, the possibility of parallelizing the calculations of any zone of the crust is related to the number of minicolumns on it. One square millimeter of bark contains about 400 minicolumns. The conditional bark area of 40 by 40 millimeters will contain 640,000 minicolumns (approximately as many minicolumns contain, on average, human bark zones). This means that in one measure this conditional zone will be able to test 640,000 contextual hypotheses. Tuning minicolumns to specific contexts creates a context map. These contexts can move, acquiring an optimal spatial structure. At the same time, the set of contexts itself remains unchanged. The possibilities of the cortex in such a scheme are limited by the number of minicolumns, and the definition of meaning is reduced to a single-step operation of computing interpretations and determining the most appropriate of them.It is possible to significantly increase the capacity of the cortex, if we abandon the one-step scheme and go for a significant increase in the memory used.
The procedure for determining meaning creates many possible interpretations. Each interpretation is a description of the source information in the appropriate context and a description of the context itself. For example, looking at the picture below, we can say that one of the interpretations is the letter A in the lower left corner, and the other interpretation is the letter B in the upper right. For each such interpretation, a letter is a description in context, and an indication of a place is an indication of context.
Image with two letters You
can replace the context indication with the identifier of the corresponding context. Thus, the context is both a computational scheme, which is associated with the rules of transformation of concepts, and a concept that gives a “name” to this scheme. This correlates well with our life experience, when, for example, we can use the rules of mathematical interpretation of concepts, and the very concept of “mathematics” to denote the system of these rules.
Suppose we have a set of contexts formed and ordered in space. Assume that the number of contextual modules is less than the number of contexts peculiar to the information. In this case, we will have to combine similar contexts together in order to meet the allocated number of modules. When combined, we will have to choose from the conflicting rules, for example, the most common ones. Such a combination will adversely affect the accuracy of our calculations. The probability of correctly calculating the desired context and the most appropriate interpretation will decrease. But then we will be able to keep within the number of computing modules allocated to us.
Since contexts are spatially ordered and the correlations between them are configured accordingly, it is potentially possible to isolate areas of similar contexts. Such areas of contexts, united by a common sense, can be called contexts related to one topic, or simply the topic of information.
If in the “deficient” contextual scheme a definition of a presumable meaning has occurred, then we can say that it was possible to determine the topic of information. When the topic of information is known, it is possible to make additional clarification of its meaning. The clarification question is the question of what kind of free memory we use for contextual transformations. Suppose that we have quite a lot of such memory. Then the following approach is possible. It is possible to create a new context map on the same bark zone, on which the main focus will be placed on contexts related to the chosen topic.
Suppose that the crust can allocate significantly more contexts than it has free minicolumns. Also suppose that each minicolumn can have a transformation memory for all detected contexts and contexts that are their “desensitization”. Then you can try to make the initial “zero” context map in such a way that you are most likely to either immediately determine the meaning of the descriptions, or at least determine their topic (figure below).
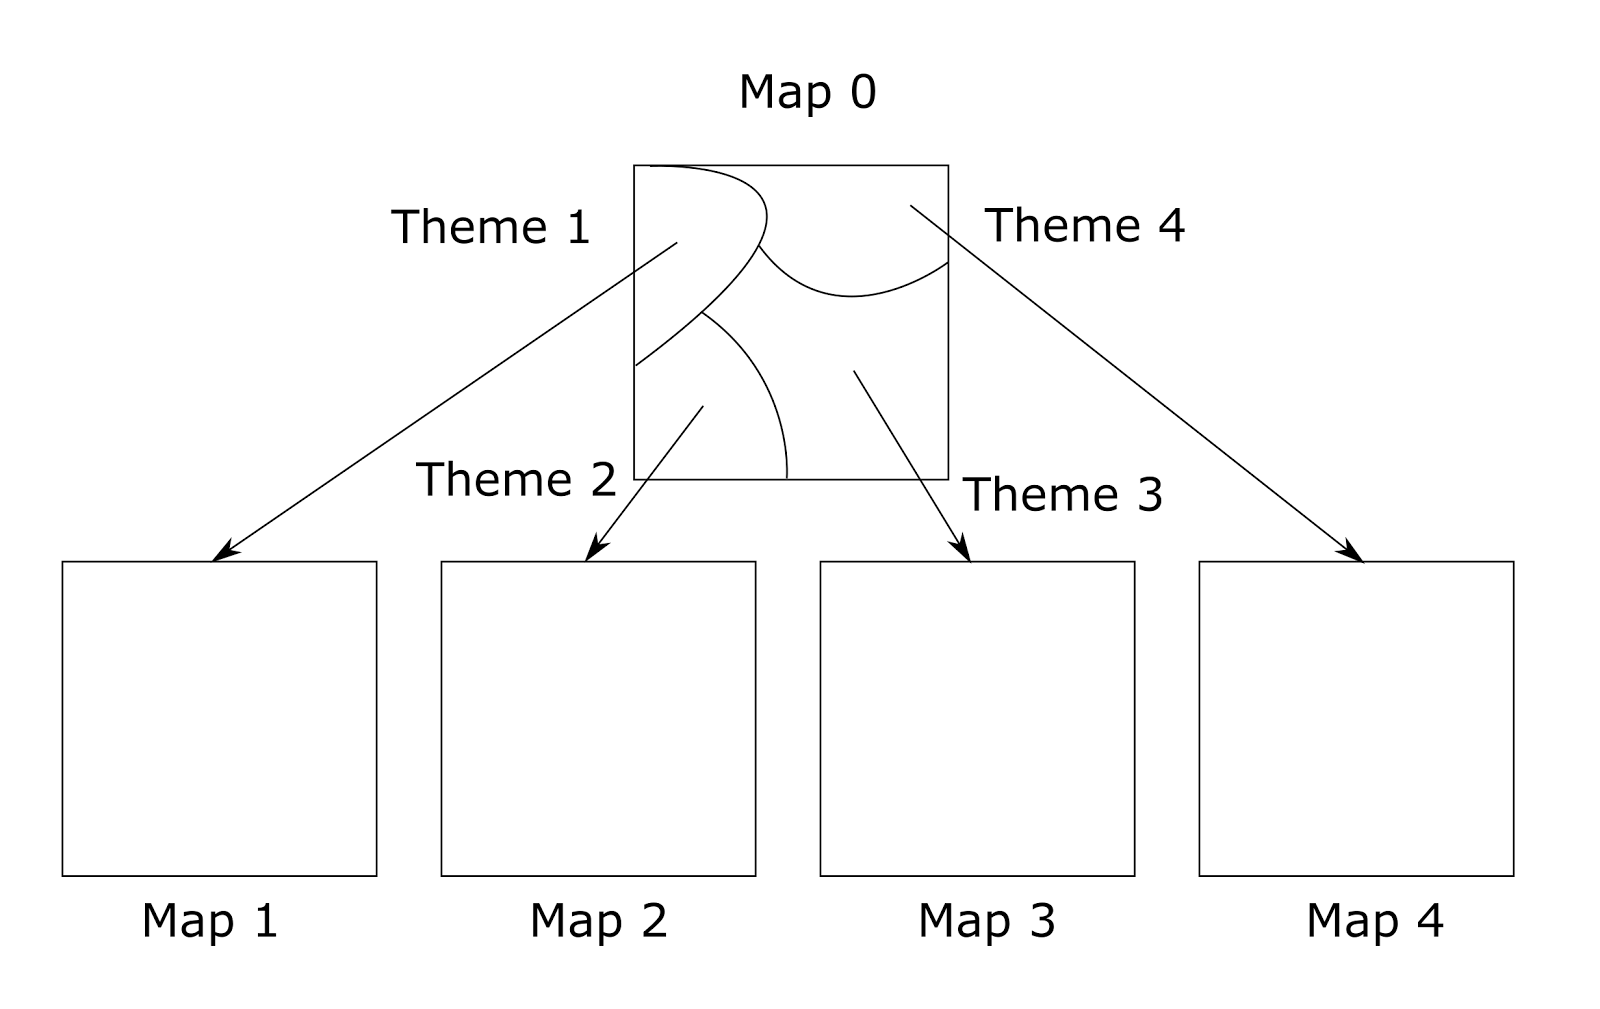
Context map graph
When you submit information, the meaning of which is not immediately determined, you can identify possible topics. Then, rearranging the map of the cortex on such possible topics, you can try to determine the meaning on them.
The combination of the initial map and the order map forms the context map graph. Potentially, each of the maps may contain contexts that allow other topics to be defined. Then it is easy to imagine the mechanism of transition from theme to theme directly, bypassing the initial map. Multilevel maps can also be imagined, when information is refined not in two but in more steps.
In order for themes to work according to the principles described earlier, in addition to rebuilding context identifiers, correlation links between them must be rebuilt. That is, links must be manageable and be able to take on different values depending on the chosen topic. This behavior of connections is similar to the concept of tripartite synapses (RD Fields, B. Stevens-Graham, 2002). According to it, astrocytes are capable of modulating the work of synapses by different mechanisms, which implies a change in the strength of connections. Earlier we said that, most likely, plasma astrocytes are memory carriers, like neurons. Astrocytes have sets of membrane receptors similar to neuron receptors and, potentially, can in some way capture and reproduce wave information. It is possible that astrocyte has a memorywhich is associated with the manipulation of contextual information.
The figure below shows the scheme of the context module, taking into account the work with themes. When defining the current theme, the context identifier is extracted from the themes memory, which sets the transformation rules. Also, depending on the theme, the restructuring of correlations takes place.

Scheme of the context module, taking into account the possibility of restructuring contextual maps when changing themes
The main argument in favor of the fact that the restructuring of contextual maps may be characteristic of the real brain is the ability of the brain to acquire new complex knowledge without harming the old ones. This does not apply to the distribution of functions between the zones of the cortex. There are many examples where a new experience is combined with an old one, apparently on the same zones of the cortex. For example, the motor cortex is responsible for mastering the piano. Learning to play leads to detectable spatial changes (Pascual-Leone, A., Nguyet, D., Cohen, LG, Brasil-Nieto, JP, Cammarota, A., and Hallett, M. (1995). Modulation of muscle responses evoked by transcranial magnetic stimulation during the acquisition of new fine motor skills. J. Neurophysiol. 74, 1037-1045.). At the same time, the old experience does not suffer at all. If the accumulation of new skills and, accordingly, the emergence of new contexts had to be “squeezed” in a limited set of minicolumns, this would have led to their redistribution and, accordingly, the deterioration of any old abilities.
It is also doubtful that nature provides for special areas of the cortex, reserved for various complex intellectual skills. Most likely, the mastery of various sciences, a master game of chess or any other intellectual ability is not associated with the training of some new previously unused areas of the crust. It can be assumed that when mastering a new theme there is not a total change in the basic context map, but only a slight restructuring of it. And at the same time a new thematic map of contexts is formed, taking into account all the features of the studied domain.
Alexey Redozubov
The logic of consciousness. Part 1. Waves in the cellular automaton
The logic of consciousness. Part 2. Dendritic waves
The logic of consciousness. Part 3. Holographic memory in a cellular automaton
The logic of consciousness. Part 4. The secret of brain memory
The logic of consciousness. Part 5. The semantic approach to the analysis of information
The logic of consciousness. Part 6. The cerebral cortex as a space for calculating meanings.
The logic of consciousness. Part 7. Self-organization of the context space
The logic of consciousness. Explanation "on the fingers"
The logic of consciousness. Part 8. Spatial maps of the cerebral cortex
The logic of consciousness. Part 9. Artificial neural networks and minicolumns of the real cortex.
The logic of consciousness. Part 10. The task of generalization
The logic of consciousness. Part 11. Natural coding of visual and sound information
The logic of consciousness. Part 12. The search for patterns. Combinatorial space
Source: https://habr.com/ru/post/312740/
All Articles