Scientific and technological activity on Wikipedia
Note: below is the translation of the note "Visualizing Science & Tech Activity in Wikipedia" .
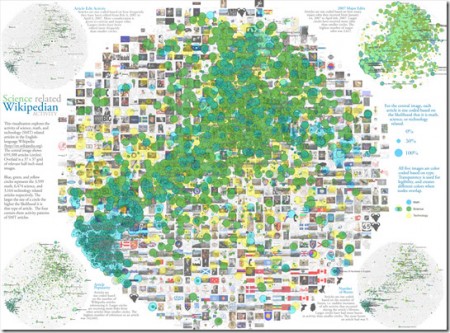
Articles marked in yellow are on technological topics, green are on scientific topics, blue (blue) are on mathematical topics.
Caution! PNG: 3753x2775, 14 MB
')
For those who have not yet seen the initial Activity Wikipedia Visualization, it can be found here (a detailed description is also located there). There is also a scalable version in the style of Google maps.
The new version uses the same layout and pictures (albeit slightly better) as in the original, but we tried to isolate the activity in those parts of Wikipedia that can be attributed with some certainty to mathematics, science or technology.
We have developed a program for classifying articles on Wikipedia in relation to one of these categories (or none), based on our own categories of articles and their position in the Wikipedia category network.
We were not surprised by the close group of mathematical pages in the field, which, in my opinion, is somewhat “overheated”. In fact, the only article in this category that attracts significant attention is the article "Earth". It is also not surprising that technologically articles are clearly distributed by topic.
The only striking fact is the group of popular science articles (blue-green), stretched out in the center of the thematic map diagonally. I will not share my interpretation of the phenomenon, let's leave comments.
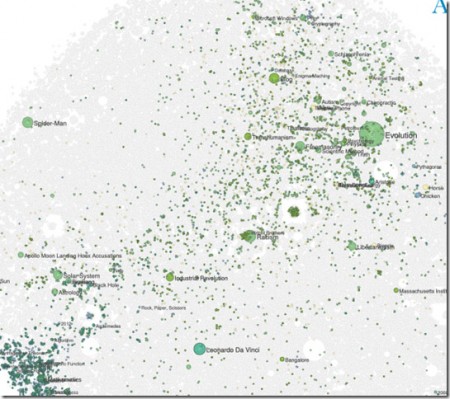
Most frequently edited non-fiction articles.
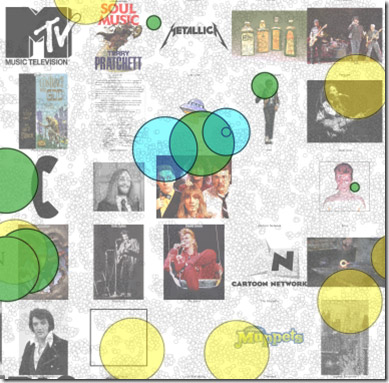
Almost nothing scientific. Just checking the correctness of the algorithms!
Web Optimizator: checking the speed of loading sites
Articles marked in yellow are on technological topics, green are on scientific topics, blue (blue) are on mathematical topics.
Caution! PNG: 3753x2775, 14 MB
')
For those who have not yet seen the initial Activity Wikipedia Visualization, it can be found here (a detailed description is also located there). There is also a scalable version in the style of Google maps.
The new version uses the same layout and pictures (albeit slightly better) as in the original, but we tried to isolate the activity in those parts of Wikipedia that can be attributed with some certainty to mathematics, science or technology.
We have developed a program for classifying articles on Wikipedia in relation to one of these categories (or none), based on our own categories of articles and their position in the Wikipedia category network.
We were not surprised by the close group of mathematical pages in the field, which, in my opinion, is somewhat “overheated”. In fact, the only article in this category that attracts significant attention is the article "Earth". It is also not surprising that technologically articles are clearly distributed by topic.
The only striking fact is the group of popular science articles (blue-green), stretched out in the center of the thematic map diagonally. I will not share my interpretation of the phenomenon, let's leave comments.
Most frequently edited non-fiction articles.
Almost nothing scientific. Just checking the correctness of the algorithms!
Web Optimizator: checking the speed of loading sites
Source: https://habr.com/ru/post/31271/
All Articles