Using R to prepare and transfer live analytics to other business units
In this brief note I want to share another option for using R in everyday business tasks. This “use-case” is relevant for almost all companies, regardless of their size. We are talking about the preparation of various operational reports and analytical sections.
As it usually happens
Depending on the scale of the company and the previously made IT investments, the following options (combinations of options) are encountered in the task of preparing reports:
- There is a corporate reporting system (Oracle, SAP BI, ...) on the basis of which all necessary reports should be generated. Analysts are always busy, they need to make an appointment, implementation dates go to “+ infinity”, working with combined and unstructured data puts everyone in a stupor, prompt adjustment of reports is almost impossible, the set of views is determined by the existing product, not by specific business needs.
- Various open-source solutions (for example, Jasper), which are supported by the residual principle. Those interested can take and navigate otchetik, only such willing is not.
- Almighty excel. Spread about the sad side of this approach is not worth it.
- Programming languages or something else ....
In principle, Excel does quite well with simple reports on small, structured and clean data, but the amount of effort spent is always disproportionate to the result. A step to the left and right, the appearance of an additional tiny requirement (“show this cut”, “and impose a schedule”, “how does this compare with ...”) requires a lot of additional effort. The transition from Excel to Tableau \ QlikView (in fact, these are not analytical systems, but an improved visualizer) improves the possibilities for simple data processing and dynamic visualization. But they also cost a lot of money and require serious study to implement the requirements that are inaccessible by simply pressing a button.
Additionally, it is not a bad question to ask, what is the size of the data when preparing such an analytical report? In 90% of cases, everything is limited to a tiny amount of data (no more than a few million “excel” rows).
Alternative solution - make reports using R
Depending on the flexibility of perception of consumers of reports and the complexity of the required dynamic manipulation with the final presentation of data, 3 different approaches are possible.
- We transfer the R script to run in the R-Studio console, performing the necessary processing and outputting results to the console \ files.
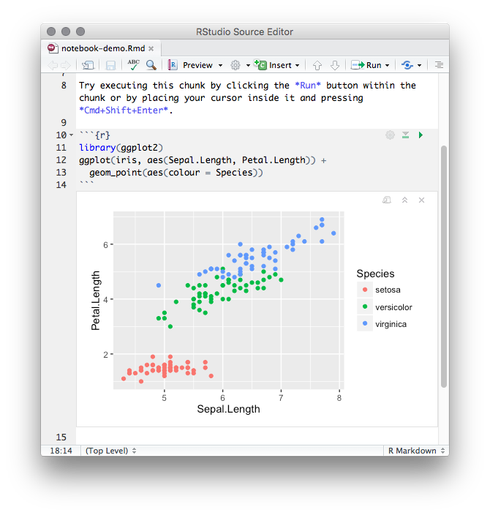
- We transfer the R Notebook / R Markdown script for launching into the R-Studio console, performing the necessary processing and issuing the results in the form of a narrative history to the console / html / pdf, etc.
- We transfer the R Shiny script to run in the R-Studio console, performing the necessary processing and outputting the results in the form of a local web portal with interactive and dynamic. If a business user doesn’t want to do anything at all (start the program and press the button), then you can independently publish them on the internal Shiny portal.
When transferring the R script to the end user, whether it is R Markdown or Shiny portal, it is enough to transfer 1 (one!) Script file. In the case of complex analytics, you can arrange your package, put it on github and include in the script an automatic check and update the local package if necessary. for these purposes, you can use, for example, the pacman or githuninstall . At the same time, within the framework of this script, a full cycle of working with data can be carried out:
- connection to data sources;
- data collection;
- data cleansing with exception processing;
- analytical calculations of any degree of complexity;
- visualization;
- providing interactive data manipulation;
- output in various formats;
- automatic publishing in external systems;
- ...
Due to the compactness of the script and the virtually unlimited possibilities for customization of visualization, it is very easy and fast to update scripts for changing environments and requests from business users.
There is absolutely no point in addressing security issues here. First, they will not always occur, for example, when preparing reports / analytics on the basis of the uploads / views available to the user and so. Secondly, abstract questions either have abstract answers or have no answer at all. And private tasks are solved easier and faster.
Practice has shown that the application of the proposed approach allows analysts who are responsible for the preparation of such reports to significantly simplify their lives and radically improve the efficiency of their work.
The choice is yours.
Previous post: “We harness R to serve the business on '1-2-3'”
Next post: “More examples of using R for solving practical business problems”
')
Source: https://habr.com/ru/post/312632/
All Articles