An example of corporate anti-virus integration with a SIEM platform

Due to the huge amount of data being processed, it is often difficult for an IT department to adequately focus on important aspects of enterprise information security. Integration of corporate anti-virus into the SIEM-system allows you to move from a simple acquisition of operational data to a complete understanding of the situation.
Briefly about SIEM
What is a SIEM system
SIEM (Security information and event management), as the name implies, is the management of information security and security events. SIEM systems provide real-time analysis of security events (alarms) from network devices and applications. In other words, the SIEM system allows you to collect a huge amount of primary information from other applications and security systems (for example, firewall, antivirus, IDS / IPS, etc.), identification and access control systems, operating systems, databases, etc. to process these data are related to the relationship between themselves (correlation) and provide them in a convenient form for viewing and analysis.
')
Thus, the capabilities of SIEM systems to collect and take into account the status of IT systems allow enterprises to turn huge amounts of primary data into useful and important expert information for subsequent decision-making . For example, it can be used to detect problems and security holes caused by external factors and / or insiders within the company, unauthorized access to confidential corporate information, etc.
Unfortunately, in many medium-sized and large enterprises, IT departments and information security services do not always cope with the avalanche of data : large volumes of information being processed and the appearance of a new generation of malicious programs lead to the fact that many important security aspects are missed or not recorded at all. This reduces the overall security level of the enterprise.
Therefore, it is not surprising that SIEM systems have become more actively used in the management of IT infrastructures in medium and large enterprises.
New features for monitoring security status
In today's environment, IT departments require a high level of visibility and control in order to be able to anticipate security problems from a new generation of malware.
In general, SIEM systems can help an IT department focus its attention on what really concerns:
• What new programs are running and not yet classified as malicious or non-malicious?
• How did these programs get into the corporate network?
• What suspicious actions did they perform on user devices (editing the registry, installing drivers, etc.)?
• What software installed in the enterprise has vulnerabilities and how are they used?
• What processes access user documents and send information to the outside?
• How is the corporate network used by each process it runs?
In addition, the capabilities of SIEM systems for recording and storing data allow for a retrospective analysis and when investigating an incident that occurred in the past, try to find the required answers (when, how and where the incident occurred, what the consequences are and who is to blame).
The practical effect of using the SIEM system
The expert data obtained from the SIEM system can and should be used to optimize the security systems in order to increase the level of information security of the corporate network and the entire enterprise. Here are some questions that can be more effectively addressed with the help of SIEM:
• Detecting sources of security threats and applying appropriate measures to prevent future attacks.
• Implementing and modifying appropriate policies for accessing confidential corporate information
• Monitoring and control of abuse of corporate resources, which may adversely affect the work of the enterprise and employee productivity
• Correction of corporate employee behavior patterns that do not comply with established security policies
The more sources of primary information are integrated with the SIEM-system, the more complete and high-quality expert data can be obtained from it. Today we will look at an example of integrating an endpoint information security system with a SIEM system.
Powerful couple: antivirus and SIEM

Integration of the endpoint security system with the SIEM system will be considered on the example of the following solutions:
• Endpoint Protection: Panda Adaptive Defense 360
• SIEM-system: Advanced Reporting Tool
Panda Adaptive Defense 360 provides a complete centralized protection of endpoints (antivirus, firewall, device control, Exchange protection, URL filtering, anti-theft functions, etc.) running Windows, Linux, Android and Mac through a single cloud-based management console. In addition, the solution provides advanced protection for Windows-based machines against unknown threats, targeted attacks, encryptors, and other malicious programs of the new generation as part of the Adaptive Defense module (it is available as a separate product if the enterprise already has a corporate anti-virus from another manufacturer). The product is a SaaS solution, in which the entire infrastructure is in the cloud, and therefore does not require a local infrastructure. In addition to this, the solution has some built-in functions of the SIEM system, which allow analyzing the contextual nature of each process and its entire life cycle. Local agents carefully monitor each process and transfer to the cloud about 2000 different parameters (excluding personal data) in encrypted and impersonal form.
Further, all primary information can be automatically transferred to the SIEM system for advanced and expert analysis. And there are two options:
• If the enterprise already has a SIEM system, the raw data can be automatically and safely sent using LEEF / CEF formats compatible with most of the SIEM systems on the market (directly or via a plug-in), for example, Alien Vault, ArcSight, QRadar , Bitacora, Lookwise and others.
• If the enterprise does not use the SIEM system yet, then Panda Adaptive Defense 360 is integrated with the Advanced Reporting Tool SIEM system by default and in this case you don’t need to do anything to integrate them (you just need to have the appropriate license).
Features Advanced Reporting Tool (ART)
Briefly about ART
Advanced Reporting Tool is a real-time cloud service. Its entire infrastructure is located in the cloud, and therefore for its implementation does not require any infrastructure in the enterprise network.
The Advanced Reporting platform automates the storage and correlation of information related to the execution of processes and their contents, which is collected from computers by the Panda Adaptive Defense 360 solution (or a separate Panda Adaptive Defense product).
This information allows the Advanced Reporting Tool to automatically perform in-depth analysis of security data and provide enterprises with tools to detect attacks and suspicious behavior of processes regardless of their origin, as well as detect internal abuses of corporate systems and the network.

ART shows all the activity of all processes in the network:
• Displays the progress of all types of malicious programs detected on the enterprise network, with information on which of the subprocesses were blocked or not, which allows you to take appropriate measures
• Lists all actions triggered by each process (malicious, non-malicious, or unknown), allowing you to assess the degree of risk from each process
• Allows you to visualize attempts to access confidential information to prevent data leakage or theft.
• Displays all executable programs, especially with known vulnerabilities, to help manage updates and patches
• Helps to properly assess available network resources, displaying those applications and those users who need more bandwidth

All information is stored in the cloud and is provided in the form of a wide range of customizable graphic gadgets, tables, dashboards and real-time warning systems. For example, the following events are tracked:
• Install and remove drivers in the operating system
• Install and modify keyboard, mouse and other devices
• Changes in the system file (HOSTS)
• The amount of data received and sent by each process within the network
• Record connections established with remote systems
• Software with known vulnerabilities installed on computers on the network
• Execution and termination processes
• Loading libraries
• File System Manipulations
• Run command line
Tracked events can be associated with unknown malicious code, and therefore the Advanced Reporting Tool (like other SIEM systems) is a fundamental tool for monitoring processes to detect suspicious behavior and anomalies.
ART Web Console
To manage the SIEM system, the Advanced Reporting Tool uses a cloud-based web console that is optimized for working with Mozilla Firefox and Google Chrome (although it can work with other browsers). To access the console, of course, you need an Internet connection and an open port 443. The minimum screen resolution is 1280 * 1024 (1920 * 1080 recommended).
The ART management console is accessed directly from the Panda Adaptive Defense 360 cloud-based web console designed to protect endpoints.
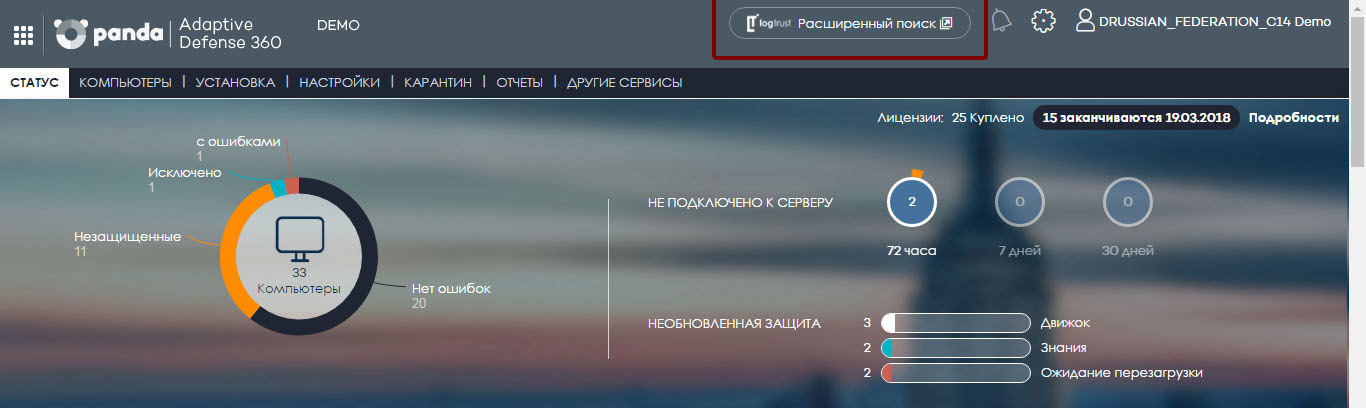
On the main page of the ART web console, there is a basic, custom “from the fields” report in real time:

On the left side of the ART web console is the menu:

Account: user account management options for a user who has access to the ART web management console.
Home: home page button.
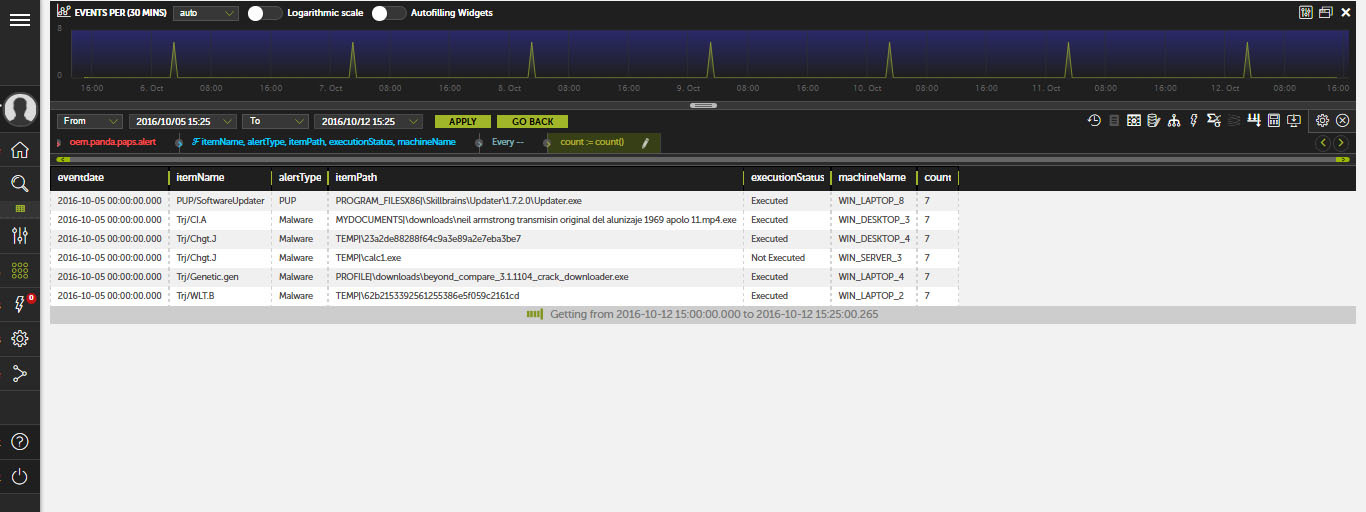
Search: access to tables with accumulated knowledge. Here you can see the primary data sent from computers protected by Adaptive Defense.
Administration: allows you to customize new alerts.
Applications: this section offers a drop-down menu with available applications — interactive and pre-configured panels that provide the processed information in a simple and understandable format:
- Security Incidents: Shows the security status and incidents found on the network, along with information that allows you to identify the source of threats and their degree of influence on the enterprise.
- Application Control: shows data associated with the use of applications installed on the network
- Data Access Control: shows information about the use of the communication bandwidth and access to documents on the applications installed on the network
Alerts: Displays a window with information about received alerts.
Preferences: This section offers a set of options that can be configured for console users.
Applications and alerts are presented in the form of maps, tables, and diagrams (Voronoi, linear, columnar, circular, etc.), and various elements of display, filtering, etc. are used to control them.
ART applications
Applications are interactive and pre-configured dashboards that provide processed information in a simple and understandable format. As already mentioned, there are three types of applications:
• security incidents
• Application Control
• Data Access Control
All these applications are accessed through the Applications menu. To filter information, you can select the required dates, as well as the appropriate report type.
Security incidents
The Security Incidents application allows you to see malware activity on your corporate network in order to tailor an enterprise security policy. This application also helps to generate background information for expert analysis.
The dashboard shows network discoveries and related information:
- Information about the affected computers: the number of detections, the dynamics of detection over time, etc.
- Information about detected threats: directions of infection, affected computers, the execution status of malicious programs, their type, etc.

The panel contains two tabs: key security indicators ( Key Security Indications ) and detailed information ( Detailed Information ).
Among the key security indicators, you can view information on malware and PNP (dynamics and number of detections), as well as on incidents (types of incidents and the status of their execution). Moreover, in the status chart of the execution of incidents, you can see both successful attempts of infection (performed or resolved by the user) and failed (blocked or unfulfilled).
At the same time, when viewing each diagram, you can take a screenshot by one click, download the presented data as a csv file, or go to viewing the primary information, on the basis of which interesting information was provided:
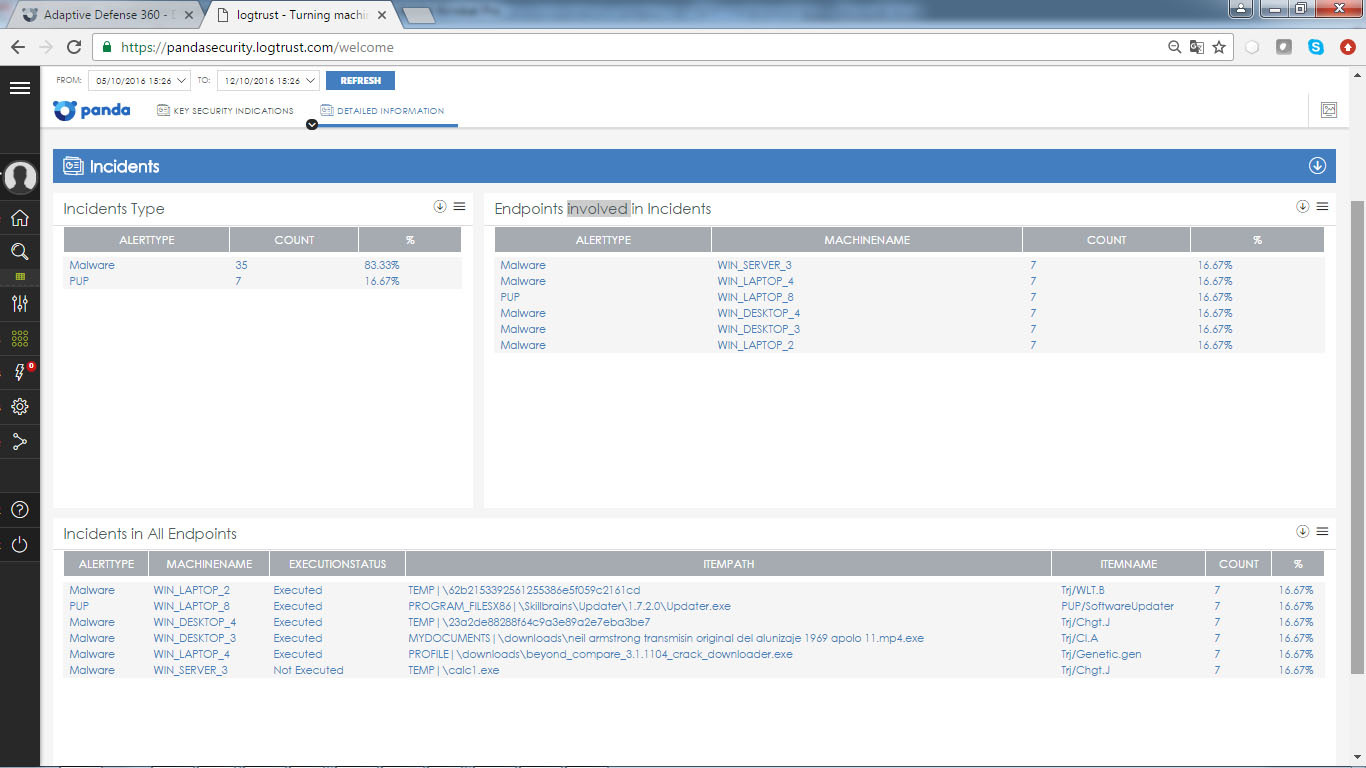
The tab with detailed information presents several tables showing incidents caused by malware. In particular, tables are available with information on the type of incidents, with a list of endpoints where incidents were detected, as well as with a list of incidents at all endpoints.
Incidentally, the Security Incidents application has three pre-configured alerts that are sent hourly: the number of malware detections on each endpoint, the number of malware detections on the entire network, and the number of computers on which a certain type of malware was running.
Thus, the Security Incidents application allows you to get a complete picture of all incidents and detected malware with complete information about their location, coverage, time dynamics, etc.
Application control
Application Control offers detailed information about all applications installed and running on users' computers. All information is presented on four tabs:
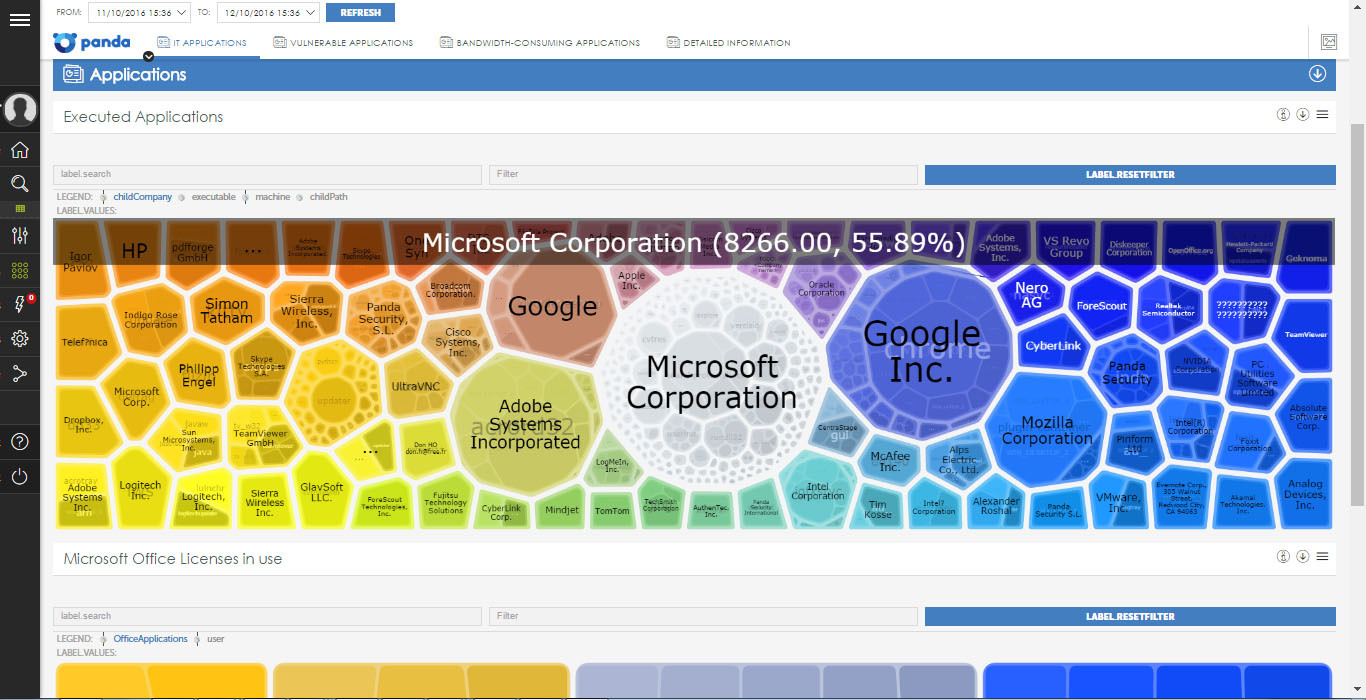
• IT Applications - shows which applications are running on computers on the network, and also establishes basic control over the use of Microsoft Office licenses.
• Vulnerable Applications - allows you to identify vulnerable applications installed and / or running on computers on the network. This information is designed so that IT can set priorities when updating software with known vulnerabilities.
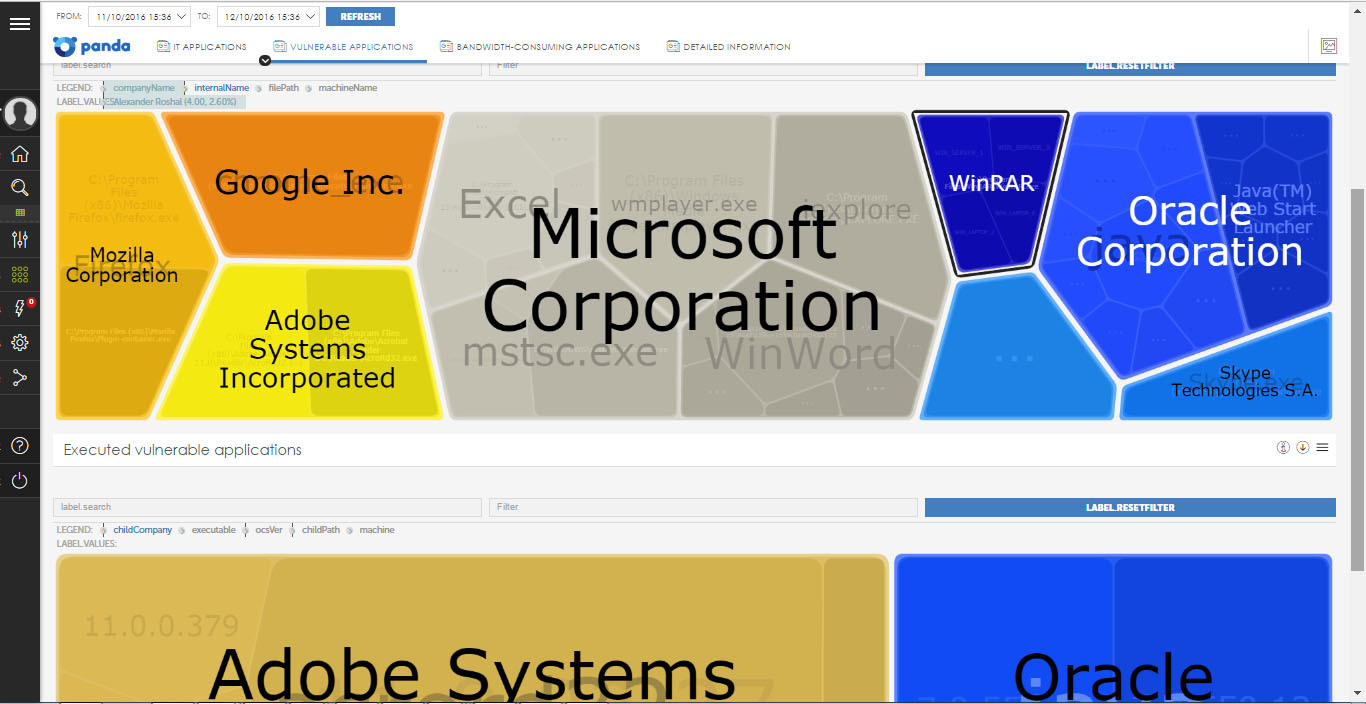
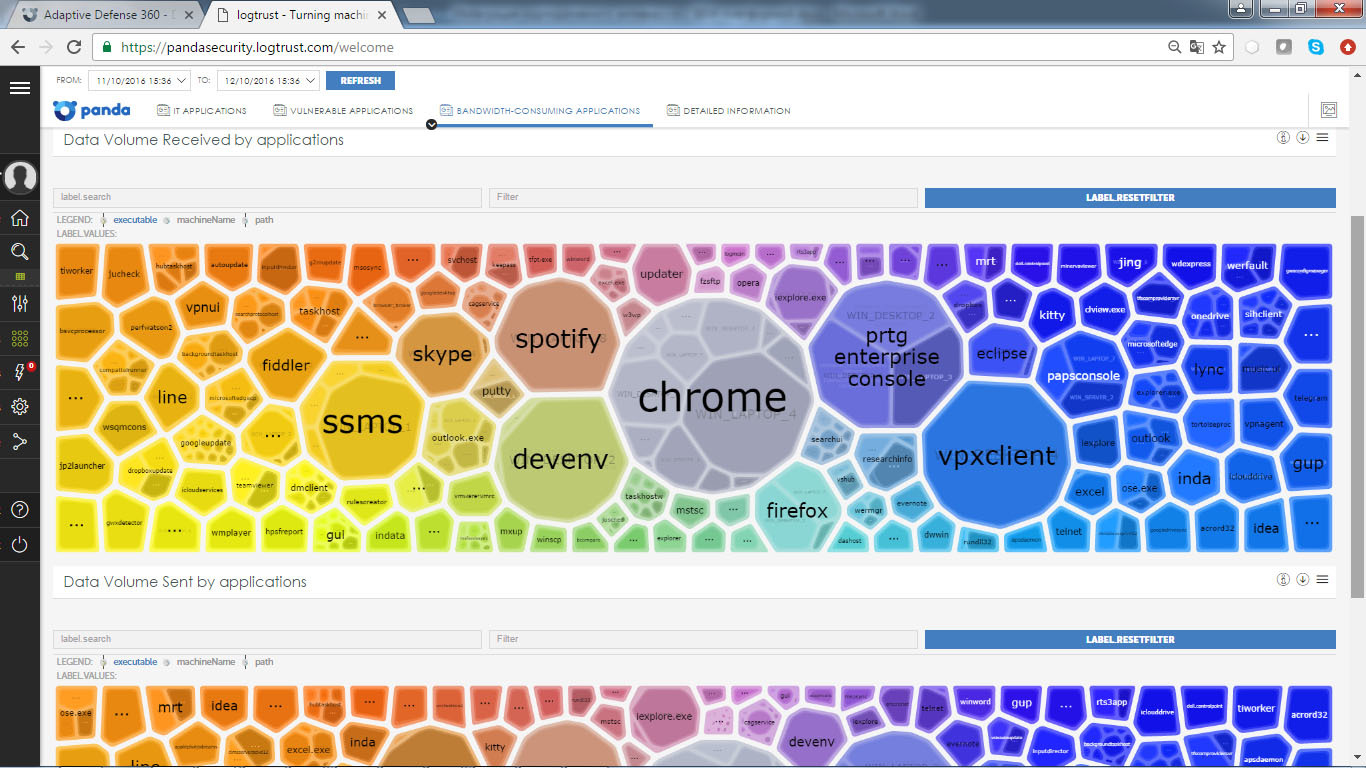
• Bandwidth-consuming Applications - shows the volume and percentage of use of the communication channel by applications running on the network. This information allows you to get an overview of the data consumed traffic by those applications that are used by users in order to: 1) identify applications with a higher average traffic consumption; and 2) assist in ensuring optimal bandwidth reservation parameters within the entire enterprise.
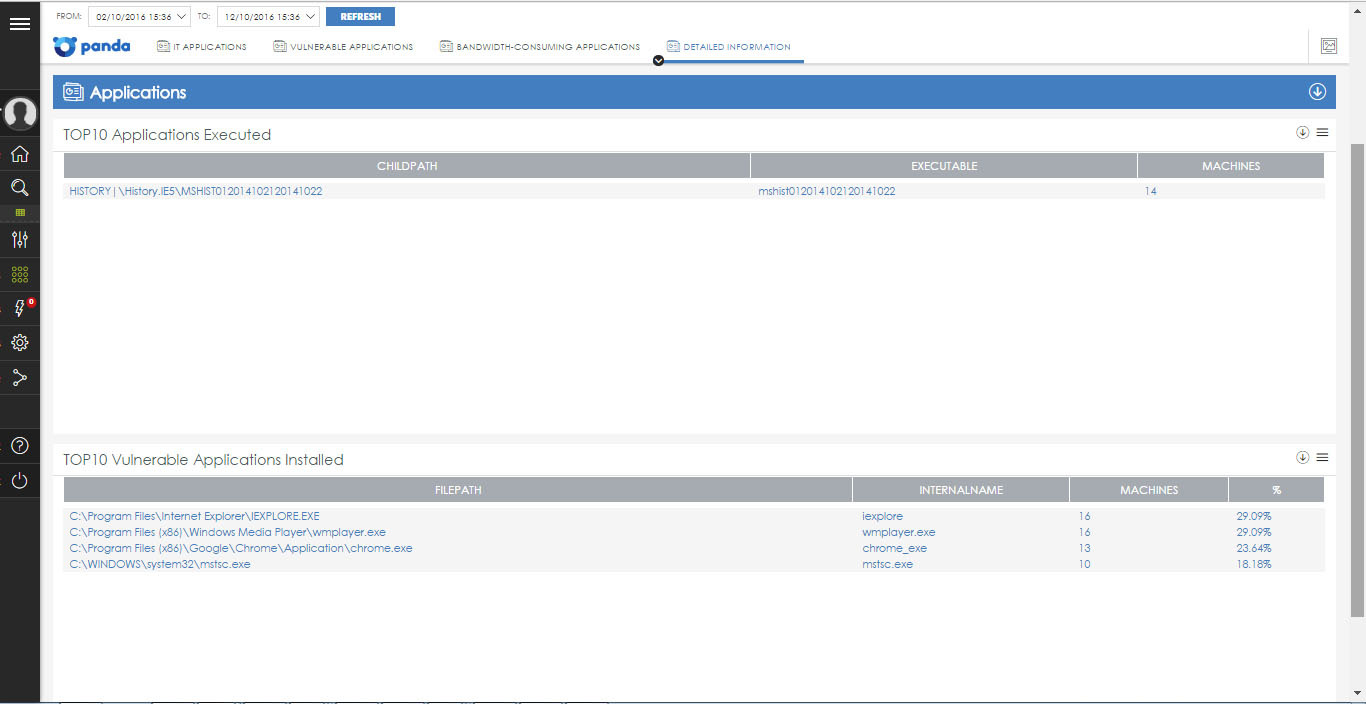
• Detailed Information - shows the most frequently launched applications and the most vulnerable applications installed on users' computers.
On the first three tabs, the information is presented in the form of a standard Voronoi diagram, which at the same time allows at a glance to clarify the overall picture of the issue under consideration and go to the required level of detail of information up to view the tables with primary information along with options for creating screenshots and exporting data to CSV.
Four pre-configured alerts are also associated with the Application Control application , which allow administrators to promptly inform about the launch of vulnerable applications and the bandwidth consumption level of the communication channel while ensuring a proactive approach to the IT department, which allows maintaining the corporate network in proper working condition:
• Number of vulnerable applications running on each computer on the network in the last 24 hours
• The amount of incoming traffic from each computer on the network in the last hour
• The volume of outgoing traffic for each computer in the network in the last hour
• The volume of incoming and outgoing traffic for each application in the last hour
Thus, the Application Control application allows you to get a complete picture of all installed and running applications, the features of their work, the traffic consumed, the presence of vulnerabilities, etc.
Data access control
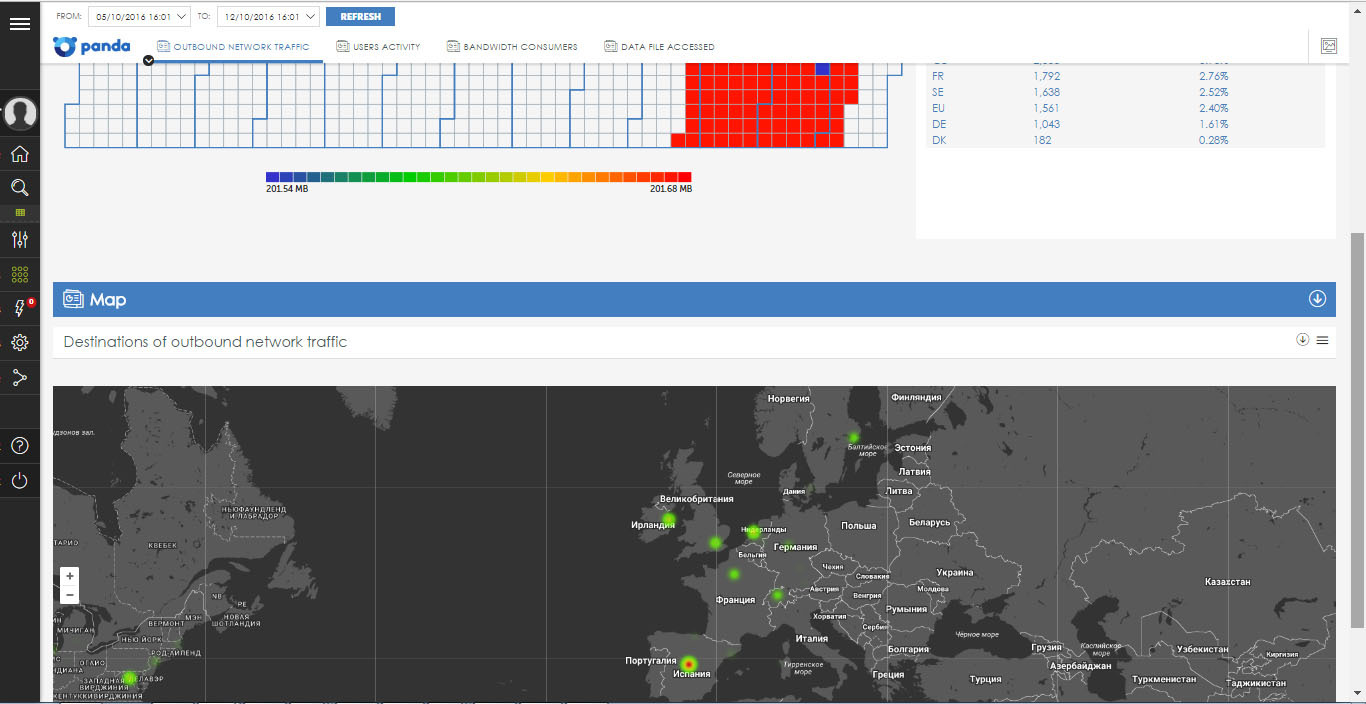
The Data Access Control application shows information that leaves the enterprise network, which helps the administrator to detect data leaks and theft of confidential information. All data is presented in the form of three tabs:
• Outbound network traffic - shows information about the amount of data sent from the enterprise network. Moreover, the information is presented both in the form of absolute values of the transmitted data and in the form of a map with the ability to control the level of detail, which shows the main geographical directions of data transmission (roughly speaking, to which country and where the data was sent). Therefore, if a company, for example, does not have commercial ties with Peru, but some data has been transferred there, then this is already a signal to the administrator to verify the primary information (who, what and where).
• Users activity - shows information about the activity of users of the corporate network, in particular, data on users authorized on the endpoints.
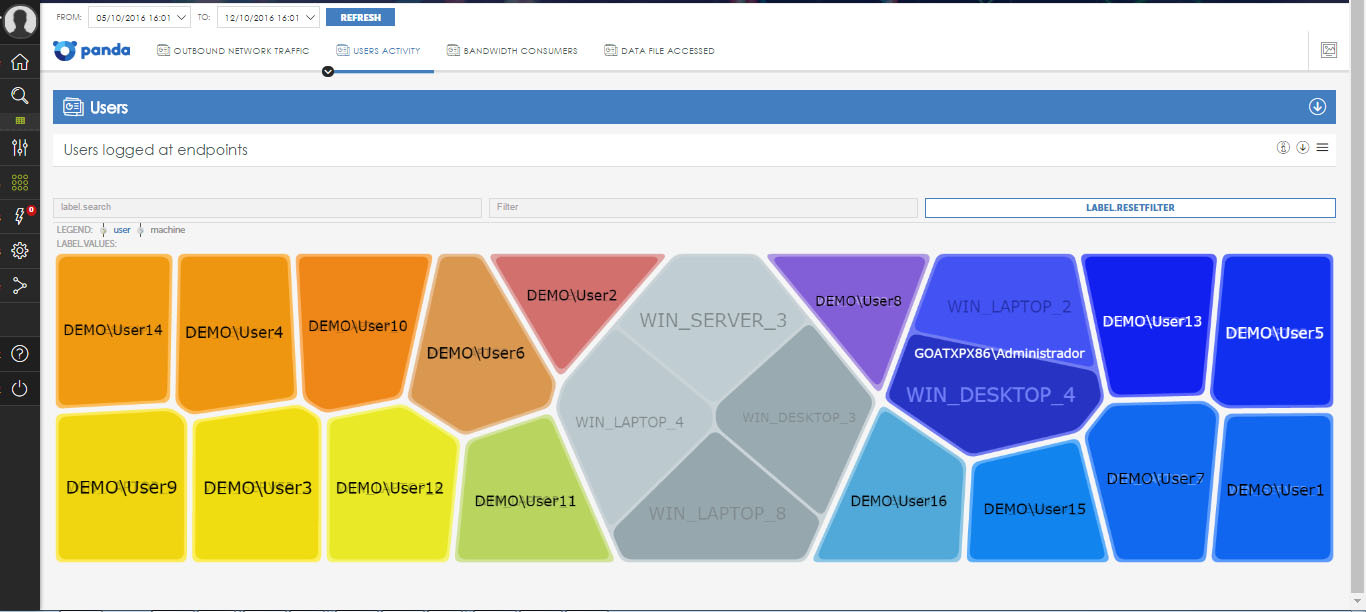
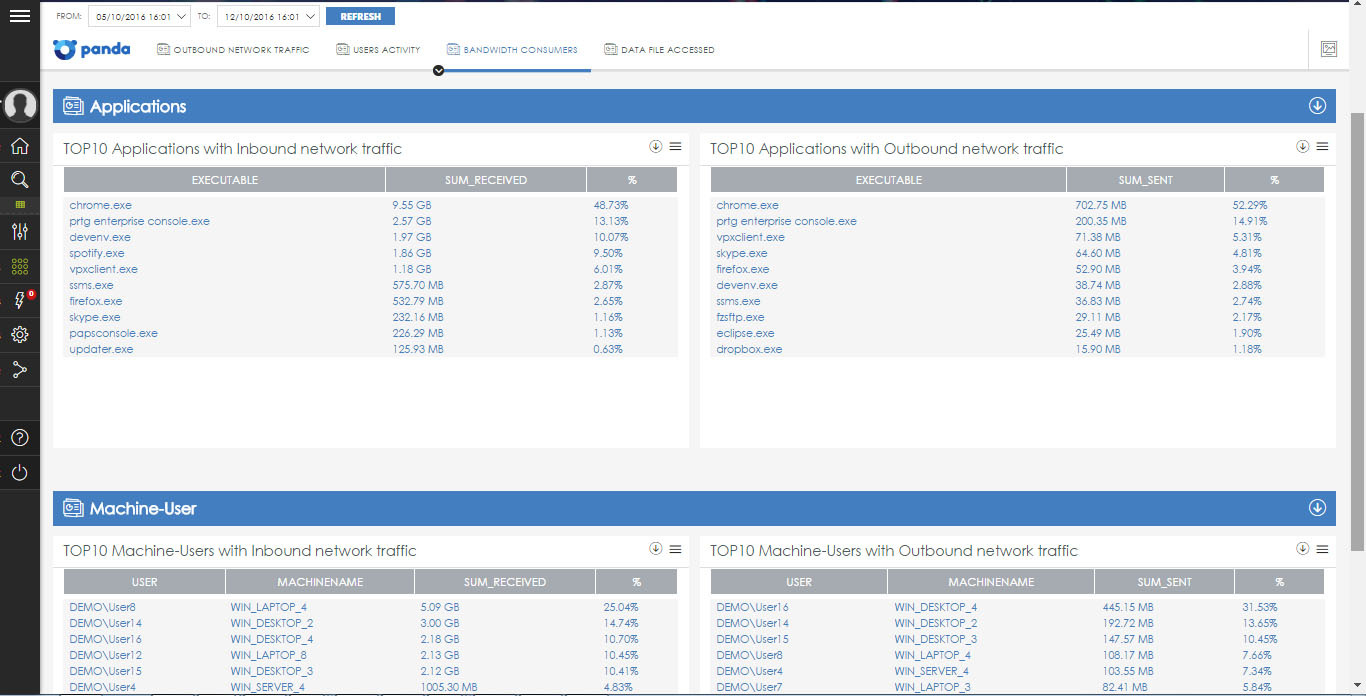
• Bandwidth consumers - helps to identify processes and users that consume maximum amounts of traffic. For example, you can see the top ten applications that have the largest incoming (or outgoing) traffic in the enterprise network, as well as the top ten pairs (user-computer) with the largest incoming (or outgoing) traffic in the enterprise network.
• Data File Accessed - shows files accessed by users of the enterprise network. Thanks to these reports, administrators can access some of the features of the DLD (Data Leakage Detection System). In particular, you can view a list of files to which there were most attempts to access from endpoints, as well as view file access statistics by users and extension type.
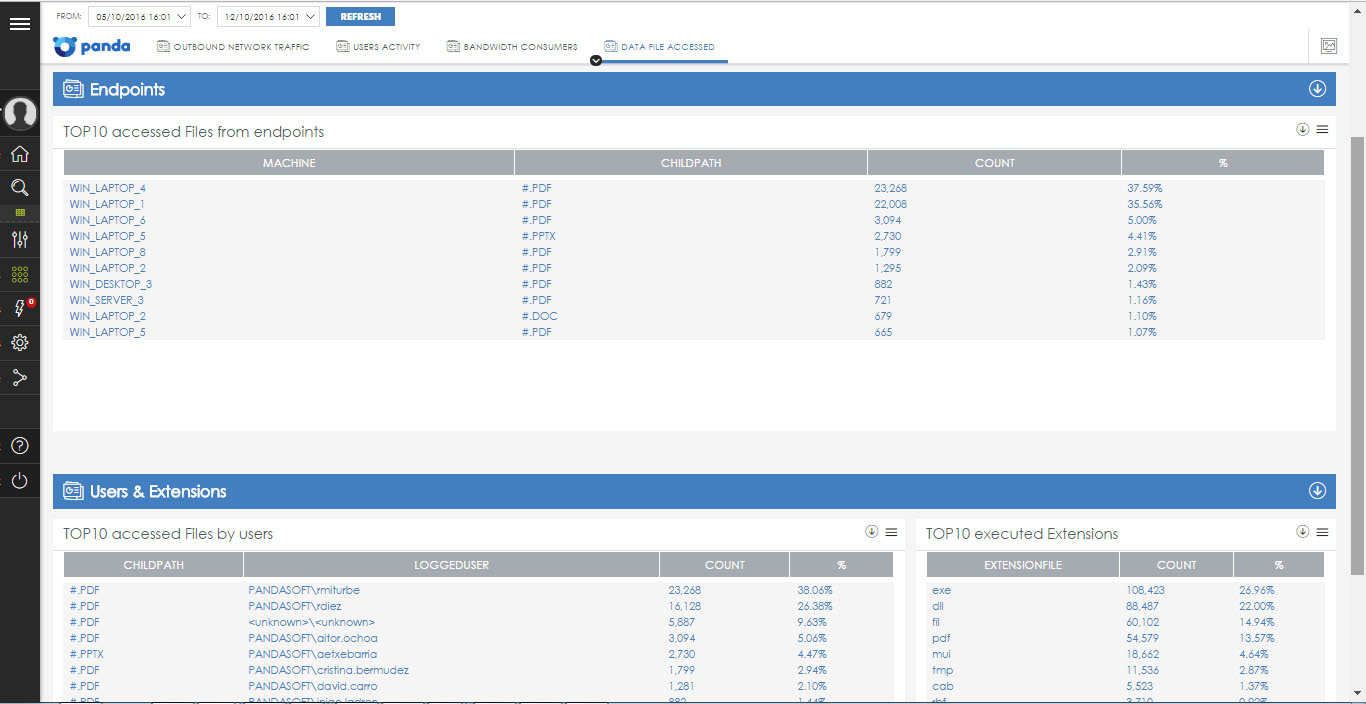
Like other applications, here you can also export data to CSV and view primary information to find out, for example, who, when, from where and how you tried to get (or received) access to a particular file in the enterprise network.
There is also one pre-configured alert associated with Data Access Control , which informs the administrator about the amount of data sent by each user in the last 24 hours.
Alerts in ART
In general, the alert system in the Advanced Reporting Tool is quite powerful and flexible. It allows administrators to keep abreast of events that occur on the network and which require their attention without viewing the web console. Thus, it is a key module for minimizing the response time by an IT department if an enterprise encounters potentially dangerous situations.
The alert system offers a set of pre-configured alerts (some of which have already been mentioned above), but it can be fully configured by the network administrator who can create new alerts for specific situations, including the frequency of such alerts, generation conditions (for example, when someone on some machine will launch a specific application or open a file) and delivery method.
You can configure pre-configured alerts in the section Administration -> Alerts Configuration, and you can view alerts in the Alerts section.
Alert System Architecture
The alert system in the Advanced Reporting Tool includes several fully customizable modules. Below is a sequence of processes:

• Event generation: each entry in the knowledge table generates a unique event that can later be converted into one or more alerts.
• Alert module: events that meet certain criteria configured by the administrator in the alert module will generate an alert itself
• Anti-flooding module: prevents the avalanche problem of alerts, allowing the alert generation module to temporarily stop generation if a certain limit has been reached, set by the administrator.
• Post-filtering module: processes generated alerts, changing their properties or even selectively destroying them in accordance with the criteria set by the administrator
• Delivery module: allows you to select the delivery method of notifications: by e-mail, via HTTP or HTTPS using JSON objects using the POST method, sent to Service Desk Plus servers using REST or SERVLET methods, to Jira servers, to PushOver servers or to PagerDuty servers.
Create your own alerts
To create your own alert, you must go to the Search section and select the required knowledge table, according to which the alert will be triggered.

Further in this table, you must apply the appropriate filters to display the required information, then click on the icon
 in the toolbar.
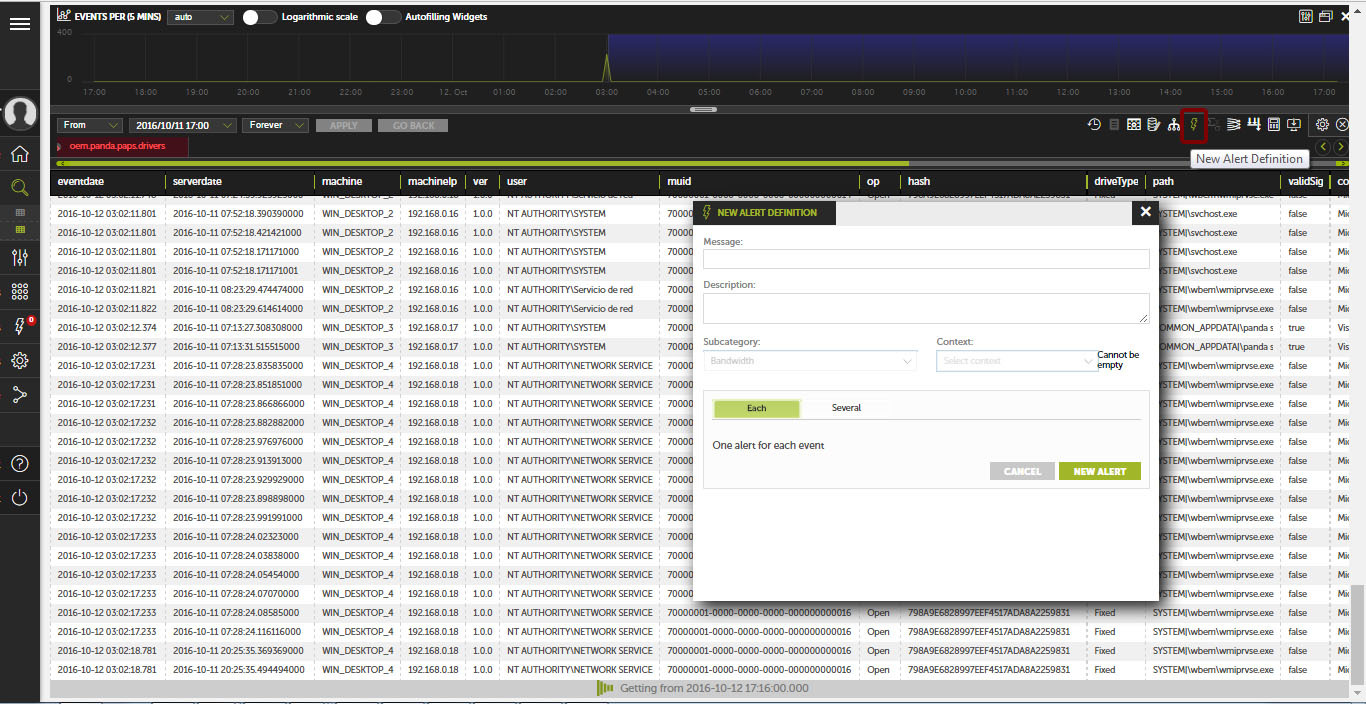
In the drop-down box you need to set the alert parameters and the frequency of the alert generation.
Thus, it is possible to create any required notification depending on the situation that needs to be additionally controlled, be it the launch of a vulnerable application, the modification of files, etc.
Other alert system options
In this article we will not dwell on all options of the alert system, since their management is rather trivial and clear. We can only say that the system allows for quite flexible management of alerts, as well as creating post-filters that allow administrators to change the functions of the generated alerts before they are sent (including deleting some of them according to certain criteria), or alert sending policies and anti-flooding policies.
Accumulated knowledge tables
Adaptive Defense 360 sends all the information gathered from agents installed at the endpoints to the SIEM system (in our example, the Advanced Reporting Tool), which organizes it as simple to read tables. This information covers every process running on a corporate network, regardless of its nature (malicious or not).
Each line of the table is a separate event that is monitored by a corporate antivirus. Tables contain a set of specific fields, both specific and common to all tables: when the event occurred, computer, IP address, etc.
Many fields use certain prefixes, for example:
• Parent: if the field starts with this tag (for example, parentPath, parentHash, etc.), then it reflects the content of the characteristic or attribute of the parent process.
• Child: if the field starts with this tag (for example, childPath, childHash, etc.), then it reflects the content of the characteristic or attribute of the child process created by the parent process
In addition to these prefixes, there are other abbreviations that we will not dwell on now, but their description is available in the accompanying documentation service.
However, below we list the knowledge tables with a brief explanation of what type of information they contain:
• Alert: incidents displayed in the Activity panel of Panda Adaptive Defense 360. The table contains for each threat detected on the computer in the corporate network a line with information about the computer, type of incident, time and result.
• Drivers: contains all operations with drivers performed by processes running on computers of users of the corporate network
• URLdownload: contains information about HTTP downloads performed by processes running on computers of users on the corporate network
• Hook: contains data on all operations of creating or manipulating a keyboard or mouse, detected on the user's systems
• Hostfiles: contains data about all operations in which the HOSTS file was changed in the users operating systems
• Install: contains all the information generated during the installation of Panda Adaptive Defense 360 on users' computers
• Monitoredopen: contains information on accessing data files from applications running on users' computers and processes that access user data.
• MonitoredRegistry: contains data for each attempt to modify the Registry, as well as access to the Registry in terms of rights, passwords, certificate stores, etc.
• NotBlocked: contains objects that Panda Adaptive Defense 360 has not scanned as a result of exceptional situations, such as service timeout on startup, changes in configuration, etc.
• Ops: contains all the operations performed by the processes in the user's network
• ProcessNetBytes: contains data on the traffic volume of processes running on the enterprise network
• Registry: contains all operations performed in the Registry branches by malicious programs in order to increase its “vitality” and quietly “survive” the computer restart
• Socket: contains all network connections established by processes running on an enterprise network.
• Toast: contains entries that appear in the table every time the Panda Adaptive Defense 360 agent shows a message to the user.
• VulnerableAppsFound: contains information about each vulnerable application installed on each computer in the enterprise network. Unlike the Ops table, where running applications are shown, vulnerable applications that are installed are shown (they may not be running).
How to try it yourself
To view the features of the Advanced Reporting Tool, it is enough to have only a device connected to the Internet and a normal web browser to connect to the cloud demo console:
• URL: demologin.pandasecurity.com
• Login: DRUSSIAN_FEDERATION_C14@panda.com
• Password: DRUSSIAN # 123
In this case, you can enter the Panda Adaptive Defense 360 demo console, where you can see the capabilities of this product with all the available options using a virtual example. And from Panda Adaptive Defense 360, as described above, you can go to the demo console of the Advanced Reporting Tool and see the work of the integrated with antivirus corporate SIEM system with a huge amount of information presented in it. Everything is very clear and impressive.
If you want to try a free solution on your network on real machines, then you can contact Panda Security with the request to register the required number of Panda Adaptive Defense 360 + Advanced Reporting Tool licenses.
Conclusion
Returning to where we started this article, I would like to once again draw attention to the fact that modern SIEM systems are really useful in medium and large enterprises for managing information security and risks. Such systems allow you to instantly receive processed expert information in a digestible form in order to make effective decisions in time to counter malicious and unauthorized actions, minimize security risks and prevent corporate data leakage. In addition, SIEM systems can be used to thoroughly investigate information security incidents to determine what, where, when, how and with whom it happened.
In our article, we looked at an example of integrating corporate antivirus with a SIEM system using the example of Panda Adaptive Defense 360 and the Advanced Reporting Tool, because both of these systems are cloud-based solutions with all their inherent advantages (lack of local infrastructure, fast implementation, obtaining the effect from the very first minutes of use, a significant reduction in the cost of implementation and maintenance). Moreover, both of these solutions are already integrated with each other, and therefore no action is required to integrate the SIEM system and the corporate antivirus. As a result of this approach, the Advanced Reporting Tool is implemented instantly from the moment of Panda Adaptive Defense 360 deployment, and its benefits can be taken from the very first minutes of use.
However, even if the company already has a corporate anti-virus or its own SIEM system, a separate Adaptive Defense product can be used as a “collector” of a huge amount of primary information with its subsequent automatic upload to SIEM without affecting the performance of computers. Given that Adaptive Defense will be extremely useful as a “defender” against unknown threats, targeted attacks and cryptographers, working in parallel with the existing corporate antivirus.
In the huge flow of information it is difficult to quickly record and track everything that is needed. And in this regard, SIEM-systems can be a great help.
Source: https://habr.com/ru/post/312544/
All Articles