Filter events by categories in the Event Map report
Colleagues, today I want to provide you with the material that I personally looked for six months ago. Then I went to Stackoverflow and tried to find a solution to my problem, but I did not get a solution. Now I came to the conclusion that, once there was one such comrade who needed such a decision, then sooner or later others will appear.
I want to talk about the event filter by category in the Event Flow report .
If you work with Google Analytics for a large site, the chances are high that you have a huge amount of events tracking. As a rule, when we have a huge cloud of events, they are divided into categories (sometimes they are beautifully divided, sometimes - not very). Breaking events into categories is, of course, good form.
')
For simplicity, I will give examples from the service to which I have a direct relationship. This is a mailing service. If you do not know - these services allow you to send hundreds of thousands of letters to your recipient at the touch of a button. With the help of these services, you also become a “happy” recipient of these letters. But let's not talk about sad things.
So. In our service, we have a number of categories of events that are directly related to user behavior. These include: “Address Book Upload” (“Address Book Upload”), “Email Campaign Flow”, “Purchase” (“Purchase”), and others. For each of these categories, we need to see exactly at which step the user stopped interacting and “dropped out” (such users are referred to as “drop-offs”).
The problem is that if we have a situation when the user at a certain step stopped creating a newsletter (stopped generating a sequence of events of the “Create a newsletter” category), but nevertheless went to another section of the site and started downloading the address book there, this user would not labeled "dropped off." Why? Yes, because he continued to generate events of a different category and was not "dropped" in relation to all events.
We also need to have specific numbers and data about those who have fallen away from the "mailing list creation".
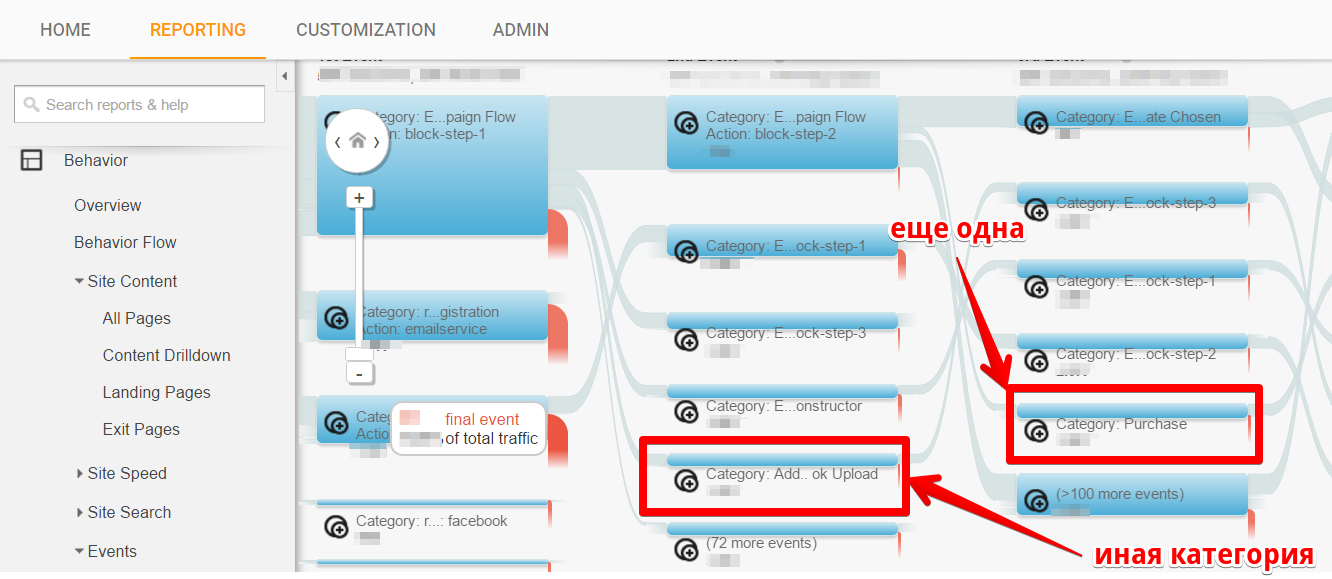
As you can see, this report presents categories of events intertwined with each other. It’s not so easy to understand and get a clear picture of these intricacies.
One day, I went to Stackoverflow for the help of the wise men there, and they recommended that I use Segments ("Segments") to filter events. Some of the readers might think that this is a good solution - we take and build a segment according to the condition “Event Category = Create Mailing”, and the trick is in the bag. In fact, the decision is wrong, since the segments are built at the session and user level. This means that if you build such a segment, you simply simply get all the users who generated at least one event in this category, but they could (and probably did) generate other category events!
But what REALLY works for me is the creation of a separate View exclusively for our purpose - to display only a specific category of events in the “Event Map” report.
And here's a short guide.
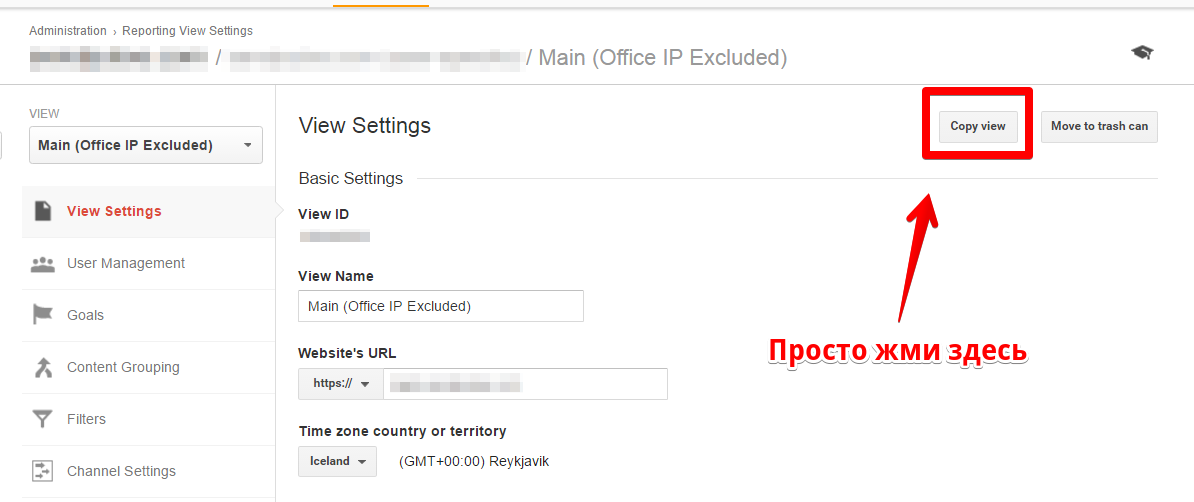
A trifle, is not it? All that is required of us is to click the corresponding button on the panel and rename the new view. We will give it the name Campaign Flow, because this is what it will show us in the Event Map.
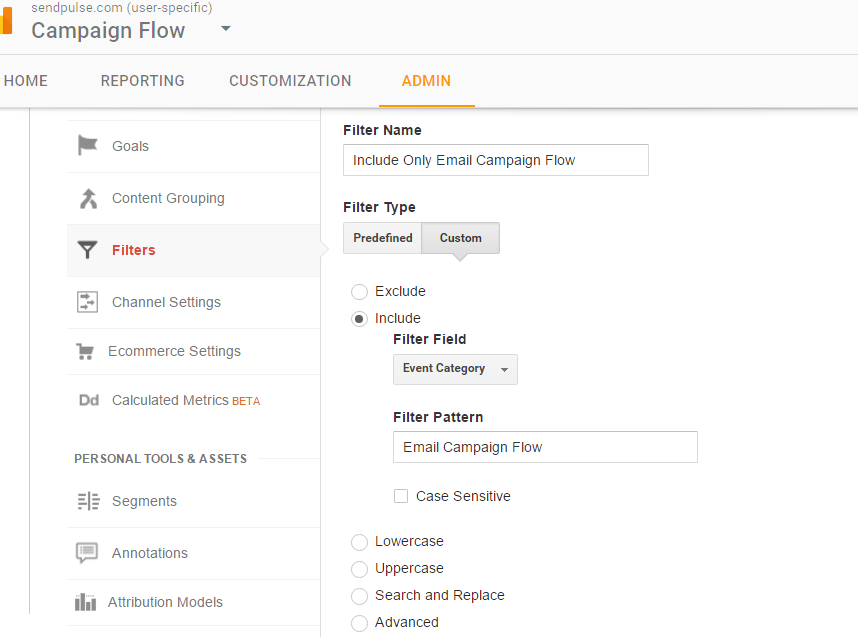
Things are easy - go to the “Filters” section in the settings of our presentation and create one small, wonderful filter that will save us from worries. The purpose of this filter is to cut off all calls to the Google Analytics server that do not contain the “Event Category” parameter with an “Event Campaign Flow” value. That's all.
If we want to have all the information and data that is available in our main report (transactions, profits, and so on), we act a little differently - we create a filter that eliminates the treatment of the categories of “undesirable" events, while leaving everything else .
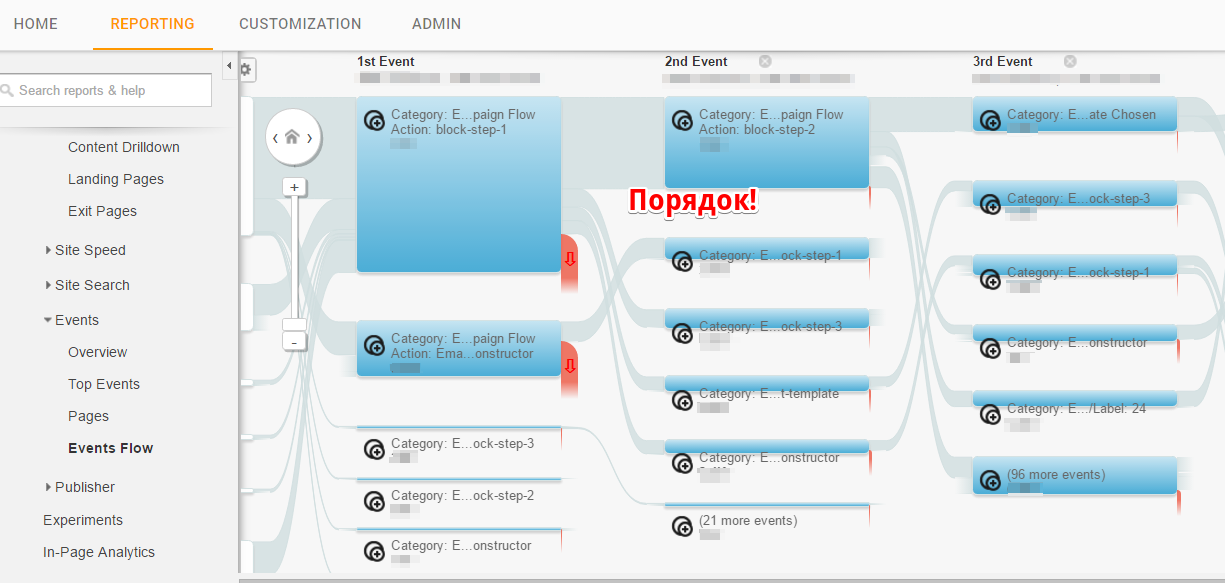
Perhaps all. Looks pretty simple, right? I hope this technique will allow you to clean up your Event Maps and make your life a little easier.
I want to talk about the event filter by category in the Event Flow report .
If you work with Google Analytics for a large site, the chances are high that you have a huge amount of events tracking. As a rule, when we have a huge cloud of events, they are divided into categories (sometimes they are beautifully divided, sometimes - not very). Breaking events into categories is, of course, good form.
')
For simplicity, I will give examples from the service to which I have a direct relationship. This is a mailing service. If you do not know - these services allow you to send hundreds of thousands of letters to your recipient at the touch of a button. With the help of these services, you also become a “happy” recipient of these letters. But let's not talk about sad things.
So. In our service, we have a number of categories of events that are directly related to user behavior. These include: “Address Book Upload” (“Address Book Upload”), “Email Campaign Flow”, “Purchase” (“Purchase”), and others. For each of these categories, we need to see exactly at which step the user stopped interacting and “dropped out” (such users are referred to as “drop-offs”).
The problem is that if we have a situation when the user at a certain step stopped creating a newsletter (stopped generating a sequence of events of the “Create a newsletter” category), but nevertheless went to another section of the site and started downloading the address book there, this user would not labeled "dropped off." Why? Yes, because he continued to generate events of a different category and was not "dropped" in relation to all events.
We also need to have specific numbers and data about those who have fallen away from the "mailing list creation".
As you can see, this report presents categories of events intertwined with each other. It’s not so easy to understand and get a clear picture of these intricacies.
One day, I went to Stackoverflow for the help of the wise men there, and they recommended that I use Segments ("Segments") to filter events. Some of the readers might think that this is a good solution - we take and build a segment according to the condition “Event Category = Create Mailing”, and the trick is in the bag. In fact, the decision is wrong, since the segments are built at the session and user level. This means that if you build such a segment, you simply simply get all the users who generated at least one event in this category, but they could (and probably did) generate other category events!
But what REALLY works for me is the creation of a separate View exclusively for our purpose - to display only a specific category of events in the “Event Map” report.
And here's a short guide.
Copy your main View.
A trifle, is not it? All that is required of us is to click the corresponding button on the panel and rename the new view. We will give it the name Campaign Flow, because this is what it will show us in the Event Map.
Create filters for the new View.
Things are easy - go to the “Filters” section in the settings of our presentation and create one small, wonderful filter that will save us from worries. The purpose of this filter is to cut off all calls to the Google Analytics server that do not contain the “Event Category” parameter with an “Event Campaign Flow” value. That's all.
If we want to have all the information and data that is available in our main report (transactions, profits, and so on), we act a little differently - we create a filter that eliminates the treatment of the categories of “undesirable" events, while leaving everything else .
Perhaps all. Looks pretty simple, right? I hope this technique will allow you to clean up your Event Maps and make your life a little easier.
Source: https://habr.com/ru/post/312240/
All Articles