Complete Idiot's Guide: How to get started with Google Analytics

We tell you what to learn in Google Analytics, if you are a beginner and do a news publication, company blog or other content project.
- How reports are built in Google Analytics.
- Which metrics to monitor and which special reports to customize.
- What ready-made Google Analytics reports to connect.
We see how often the owners of blogs and thematic media do not know their audience, so they lose money. Making media without analyzing data is like driving a car with eyes closed.
')
Google Analytics helps you understand who your visitors are, how they behave on the site and which publications they prefer. Knowing this, media engages readers better and earns more.
Helps adjust editorial policies to increase traffic and increase audience engagement.
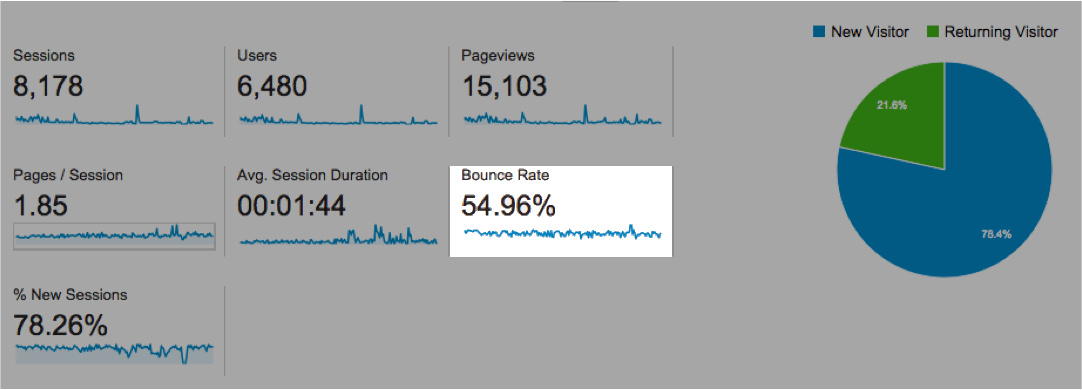
Fundamentals of Google Analytics
To analyze data in Google Analytics, you need to understand what kind of data we can get and how reports are built.
Reach, engagement, loyalty
The strength of the media brand consists of the reach, involvement and loyalty of the audience.
Google Analytics helps evaluate:
- Reach: the number of people who saw the material.
- Involvement: the time users have spent interacting with the material.
- Loyalty: how often users read you.
How reports are built: parameters and indicators
Each Google Analytics report is built from parameters and metrics. Parameters are values: city, name of publication, from which device the user came, etc. Indicators - quantitative values: number of visitors, percentage of new visitors, number of clicks on the image, etc.
How to create a report in GA
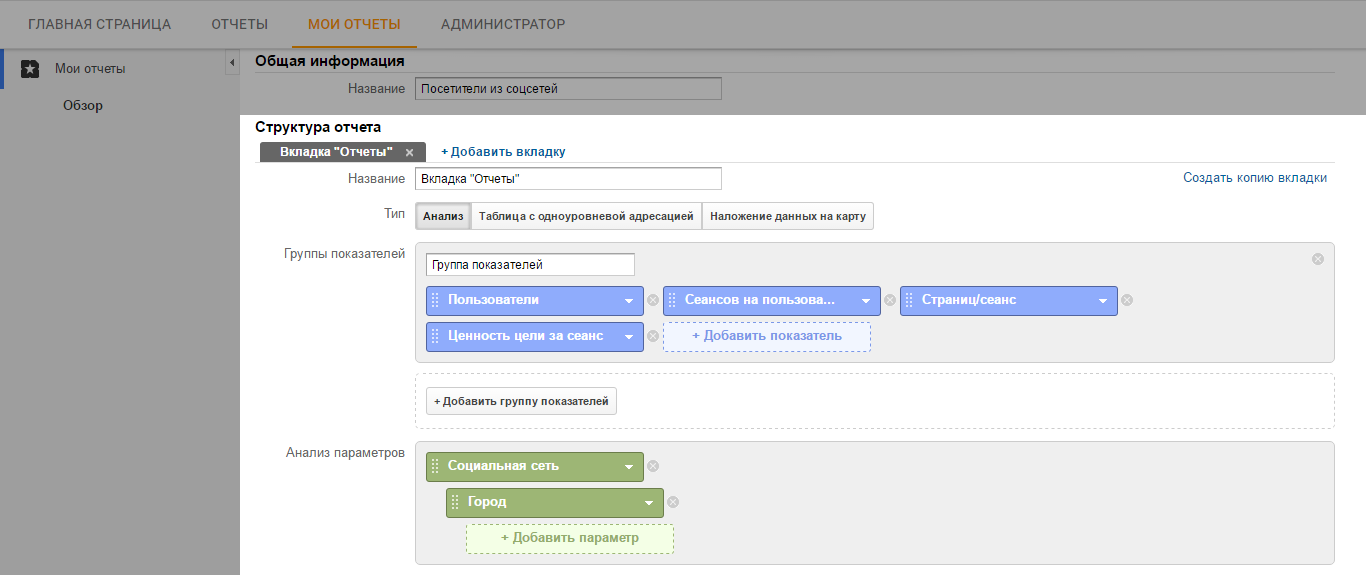
For example, let's set up a report on visitors from social networks. In the report we leave only the most important.
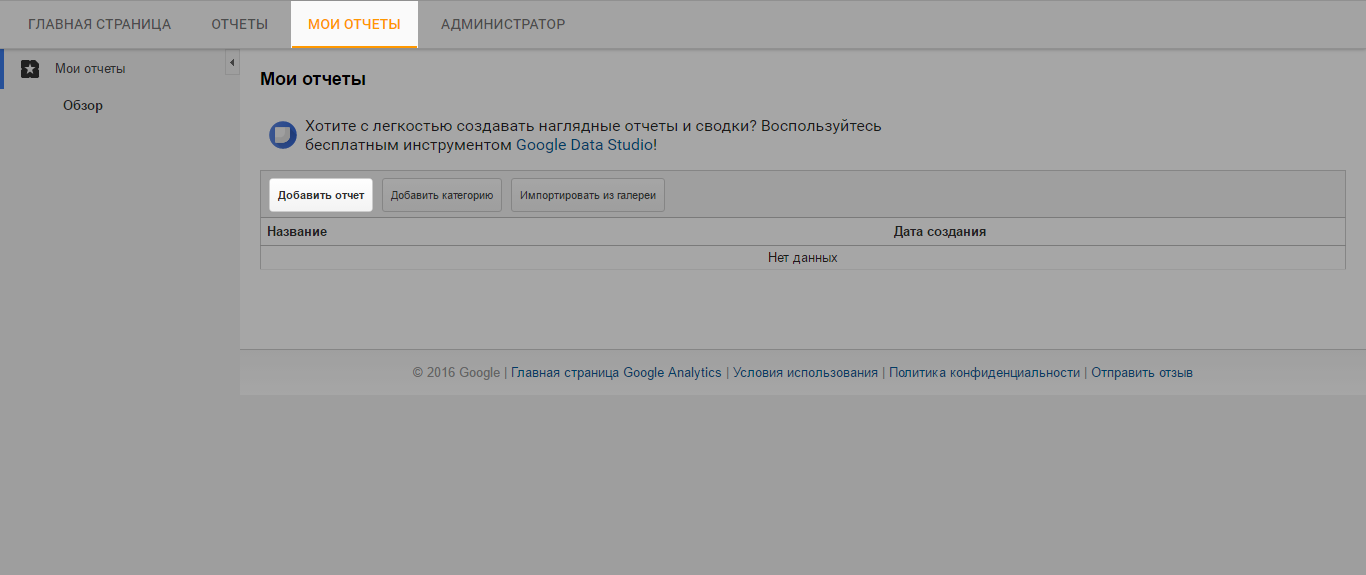
1. Log into your Google Analytics account and open the “My Reports” tab, then click “Add Report”.
2. Name the report and select the type “Analysis” (Explorer).

3. Add to the report a group of indicators from the screenshot, namely:
- Users
- Sessions per user
- Pages / Session
- chain value per session
In the "Parameter Analysis" add:
- Social network → City
It should work out like in the picture:
4. Exclude from the report traffic from social networks, which Google Analytics could not determine. For this, we configure an exception filter.

5. Done, save and get a report of this type. Special reports are located in the “Settings” section of Google Analytics, just where they are created.
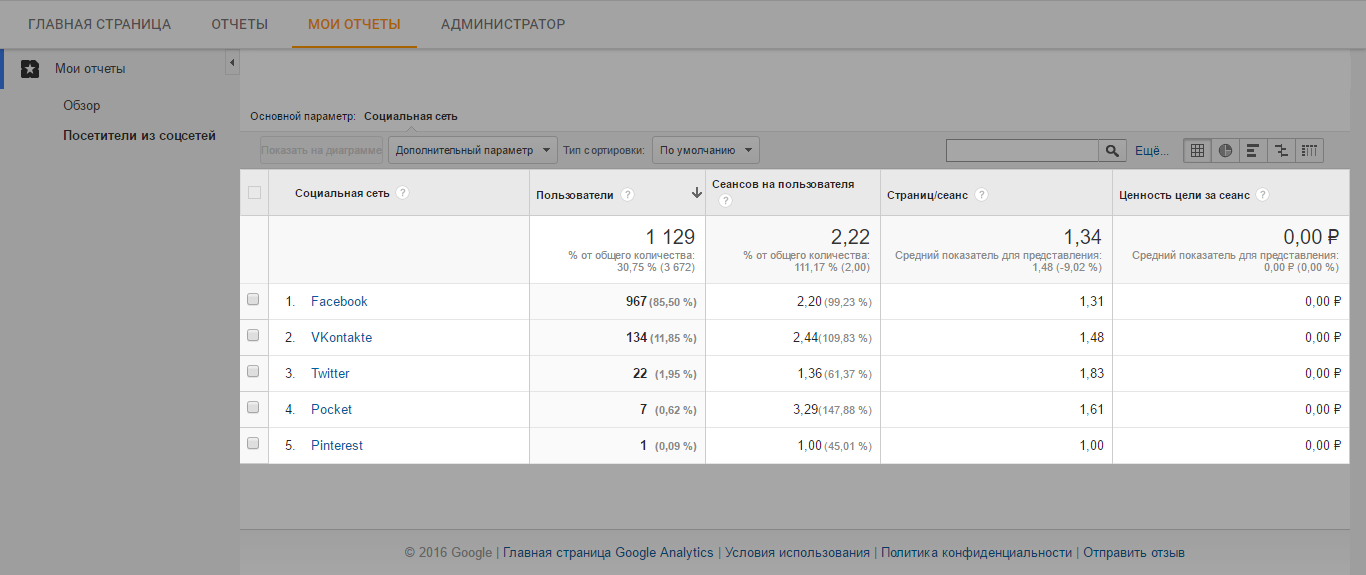
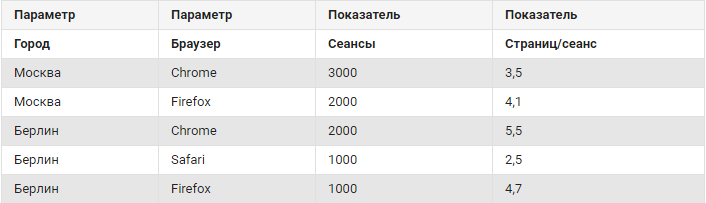
6. If we click on one of the social networks, we will see from which cities people come to us from the chosen social network.

Now you can see from which social networks what traffic comes to us. In which cities they use “Vkontakte” or Facebook more, visitors from which social networks look more pages, and from which less and how much time they spend on the site.
Configure other special parameters according to the instructions.
Connect ready reports
Doskrolly and time on the page
Doskrolly - how many users inspected the page to the end or to the middle.
Deep scrolling does not mean that the article was read carefully. Internet users often scroll the page, but do not delve into the essence of what is written, so it is important to compare the scrolls with the time on the page.
Time on the page - how much time the visitor spent on the page. In order to better understand engagement, it is important to track not only the total time on the page, but also how much time the visitor devoted to its beginning, middle or end.
Doskrolly and time indicate the involvement of the audience. The editors will understand which publications keep the user on the site, and which ones repel him.
Connect the Scrolldepth plugin to Google Analytics to track page scrolls.
A Screentime plugin will show how much time the visitor spent at the beginning of the page, in the middle or at the end.
Data segments
Segment - a set of data on your chosen criteria. Segments allow you to “isolate” certain data from the total mass and see opportunities for improvement that are difficult to see in a large stream of variables.
Example: In a culture news publication, a bounce rate fluctuates around 55%.
To see the possibilities for reducing failures, see the reports. The publication found in the geolocation report that visitors from St. Petersburg had a bounce rate of almost 80%, while visitors from other cities were below about 50%.
To understand the behavior of users from St. Petersburg, create a segment in St. Petersburg.
Now you can see which articles are read by Petersburgers, where they come from and which page they leave the most often. It turned out that the residents of St. Petersburg come to the site mainly through links from Vkontakte and get to the pages with descriptions of Moscow cultural events, from where they immediately leave.
Hypothesis: problem with targeting and distribution of articles in Vkontakte:
1. It is necessary to make so that Petersburgers less often went to the pages of Moscow events;
2. You need to write more articles about events in St. Petersburg. If a Petersburger finds himself on a page about Moscow events, he has to offer to go to the page about events in St. Petersburg.
This will help reduce the bounce rate and increase the number of Petersburgers returning to the site.
» Instructions for creating and configuring segments.
UTM tags
UTM (Urchin Tracking Module) tags help you more clearly track traffic source information. When someone clicks on a link with UTM parameters, the data is recorded in Google Analytics.
You can see where visitors come from: from emails, from a partner publication, or thanks to an advertising campaign. Data on transitions from UTM links are displayed in the GA section of the Campaign.
Usage example
Media published an article and distributes it in social networks. For Facebook, it makes one UTM-link, for Vkontakte - another, for publication on the partner’s Facebook edition - the third.
So, the publication sees which source turned out to be the most effective, from which source the readers come, who subscribe to the newsletter, etc.
UTM links can be made manually, but more convenient in the linker .
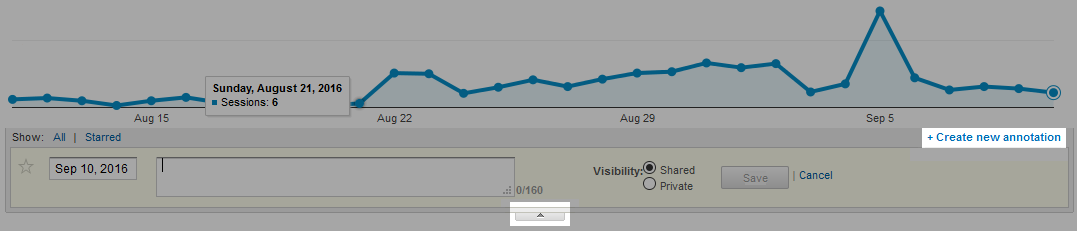
Annotations
Annotations are notes in Google Analytics reports. Help remember events and see how they influenced user behavior.
For example, if you made a redesign - make an annotation and track how traffic has changed. Or make a note if you have launched an advertising campaign, changed the redpolicy or any other event. When you connect the widget Relap.io - make an annotation and track how the traffic and the involvement of visitors will increase. To take a note, click on the arrow under any report and click "Create annotation." Then enter the text of the note.
What to track and what reports to set up
Google Analytics shows a number of predefined reports, but for the media it is useful to set up special reports with other useful data. We tell you which metrics to monitor and which special reports to set up.
Popular publications
It is important to know which materials collect the most views and involve readers more strongly in order to produce such materials more often. To see the most popular publications, include this special report .
Where visitors come from
It’s not enough to understand which sites give you the most traffic. It is important to understand how the behavior of visitors from different sites.
Suddenly, those who came from Facebook are more eager to read news stories, from Vkontakte - entertaining articles, and from Google search - analytical articles and instructions. Knowing these differences, you can adjust the work of the media in order to increase the traffic and involvement of readers.
Connect a special report on traffic sources . It shows all sources of traffic, including from the search.
But this report shows the traffic from those sites that link to your media - connect . And this report shows traffic only from social networks.
What search requests do visitors come from?
To see what search requests your readers come to, plug in the Search Search Traffic report (Excluding Not Set, Not Provided) from this set .
Mobile traffic
It is important to monitor mobile traffic, because for many media it has already reached the desktop. Especially watch out for the bounce rate: if the failures have increased dramatically by, for example, iOS, then something happened, you need to test the site from the iOS device and fix the errors.
Connect the AK: Mobile Performance Analysis v2 report from this set .
What hours and days your audience is most active
A special report Hours & Days will help you to understand what time of the day and what days your visitors are most and least active on the site.
In an interview for Relap.io, Sergey Baryshnikov and Alexander Kuksa from Bigpicture.ru told about the behavior of their media visitors on different days of the week and time of day.
With Sergei figured out how to read our articles depending on the time of day. We saw that on weekdays one picture of consumption, on weekends - another. Although the same people. After 20:00 - women. Day and weekdays - social: prisons, stalls, in the morning - children and food. In the morning, on weekends, it is necessary to feed with absolutely specific content that definitely won't work on weekdays. If you post breakfasts or something childish like “mimimi” - it will, but animals do nothing at all. On weekends, in no case should you include social. Is that only Sunday evening, but it is, where a lot of text, so that people can read before bedtime. Saturday - in general, you can plump and do nothing.
By tracking data from the listed special reports, it will be easier for you to understand your audience and find opportunities for more profit.
Read how to improve media content strategy with Google Analytics .
Source: https://habr.com/ru/post/312208/
All Articles