How to choose an in-memory NoSQL database wisely. Testing performance

Dmitry Kalugin-Balashov ( Mail.RU )
I have a report on In-Memory NoSQL databases. Who knows what the in-memory NoSQL database is? Raise your hands, please ... Shame on you? Database room, and only half know what it is.
If you choose a database, focusing on its popularity, then do not need to. How, in general, choose the database?
')
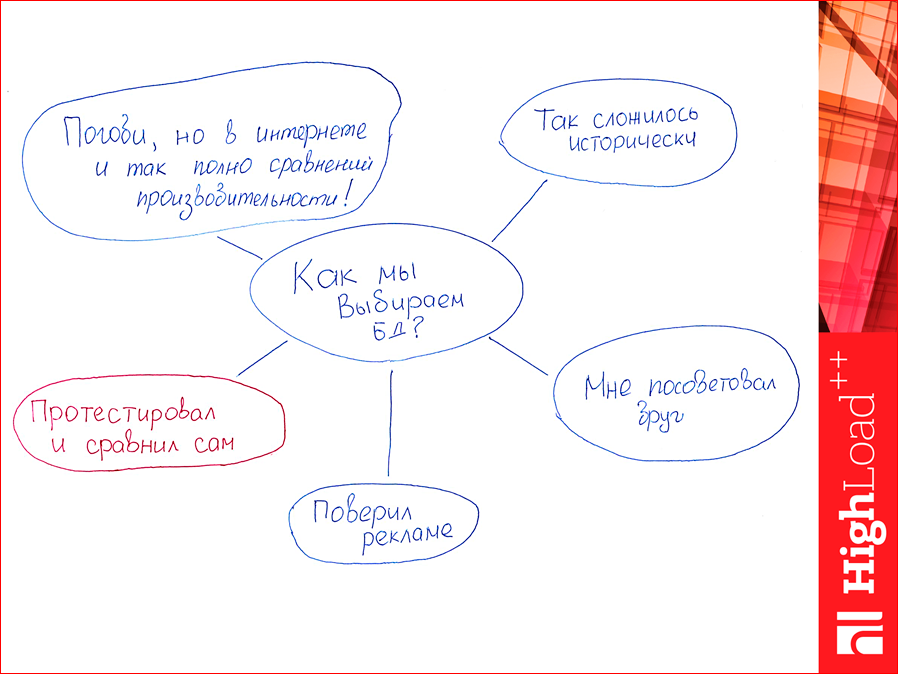
The first option is popularity. It happened so historically, i.e. You came to work, and you have such a database there, you did not choose it, you just want, for example, to change it.
The second option - I was advised by a friend. This option is also quite popular.
The third option - believe advertising. This is also related to popularity, read some article: "Oh, Redis is a cool database, let's use it."
And now I have a question: who among you considers himself an engineer? Those. You graduated from high school and have an engineering education. I propose to use an engineering approach to the selection of a database. I suggest testing them. On their own. You may reasonably argue that the Internet is already full of database testing, and you can just see how people have tested. You don’t need to do that either, because you’ll see that everything depends on a particular situation. Those. You can see how the database is tested, run it and not get what that person had. Those. you need to test on your load, on your machines - virtual or non-virtual, on your environment. Therefore, my entire report will be about the engineering approach to the choice of databases.
See, this little man is you. You consider yourself an engineer. Those. this man is cool.

And there is a little man who is not an engineer who can be seduced by advertising, maybe he believed a friend, or simply chose Redis, because everyone chooses him. So, we are not on the way with him. And therefore we will choose the green man, we will act as engineers.
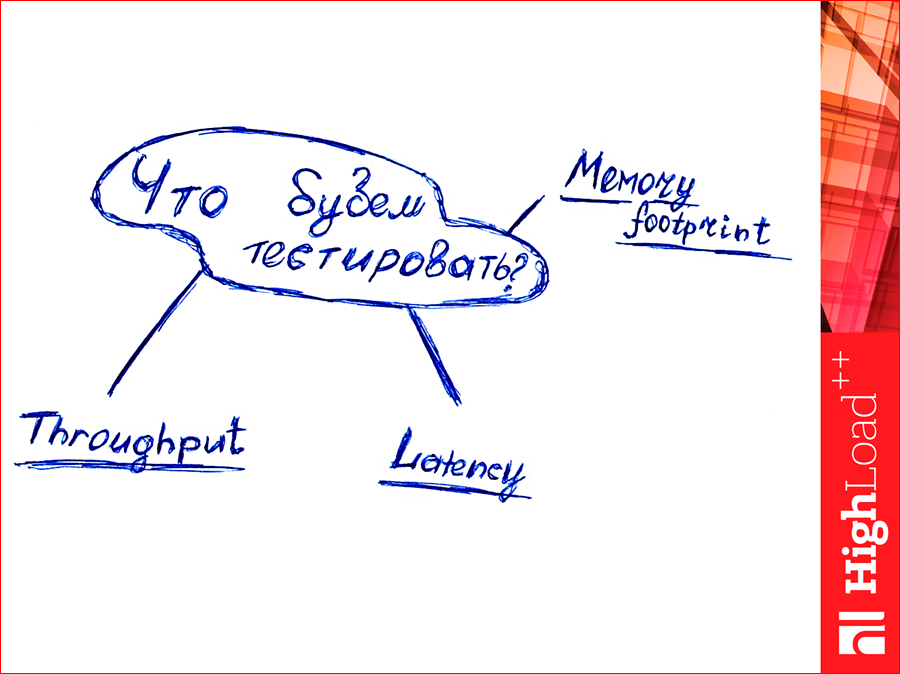
Now the question is: what will we test? What do you think you can test? How much data can I hold?
See, there are two parameters - throughput and latency.
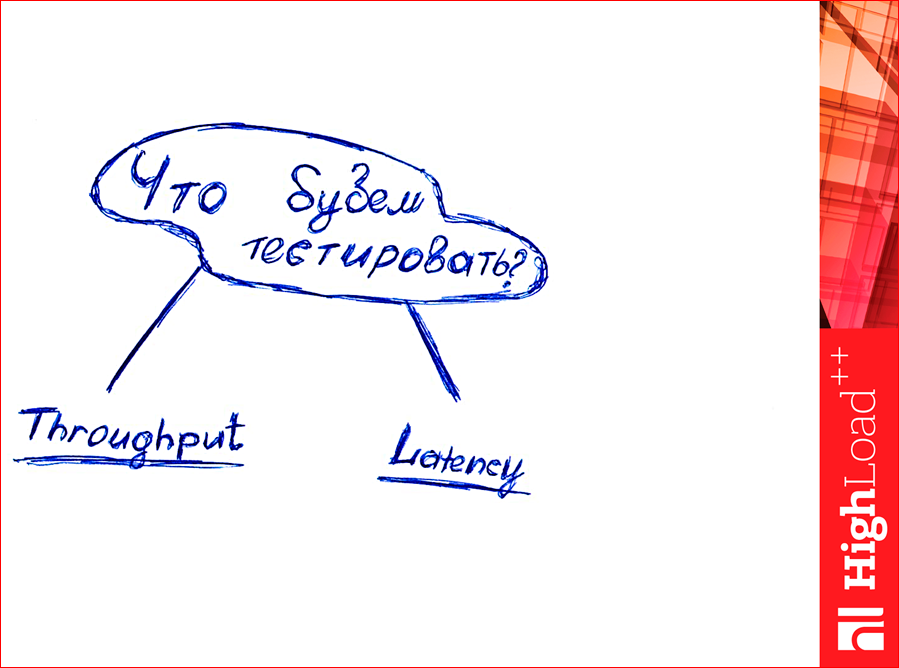
Raise your hands, who understands the difference between these parameters? Somewhere 10% of students in the hall. Then I will explain. Who went to such a shop sometime?

Are there any smokers? Where do you go for cigarettes, in Auchan or closer? Closer, probably, yes? So, this store is special, it has a very small latency. Latency is the expected time when you go for cigarettes, for example, between making a decision and, in fact, how you got them. Those. you realized that you had to buy them, went down to the courtyard, went into the store, took it, went to the cash register, bought it, came back. It took 15 minutes. This is your latency.
Throughput is already a shop parameter — how many people like you can miss per unit of time. Those. There is usually one cash register in this store, with a bunch of people, and one person passes there in two minutes.
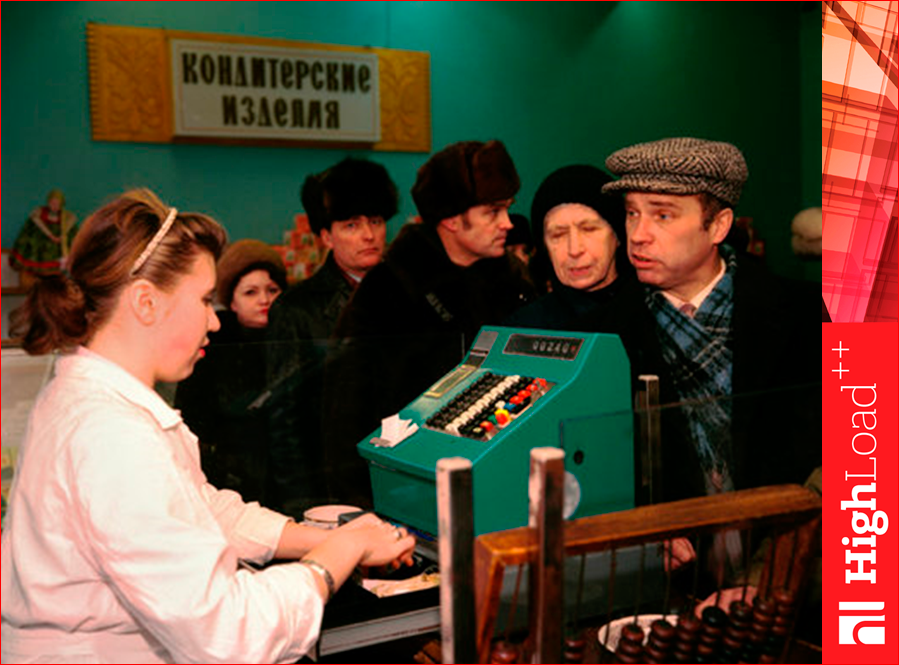
Those. slow enough. On the one hand, for us it is pretty fast, but if there are a lot of people like us, the store will drown, there will be long lines and nothing good will come of it. If we overload this shop, then we will also grow latency, because everyone will have to stand in lines.
There is the other side, the reverse side of the moon. It looks like this:

Who was in Auchan? All were. Fine. Have you seen how it works? There are many cass. And they work in parallel, at the same time.
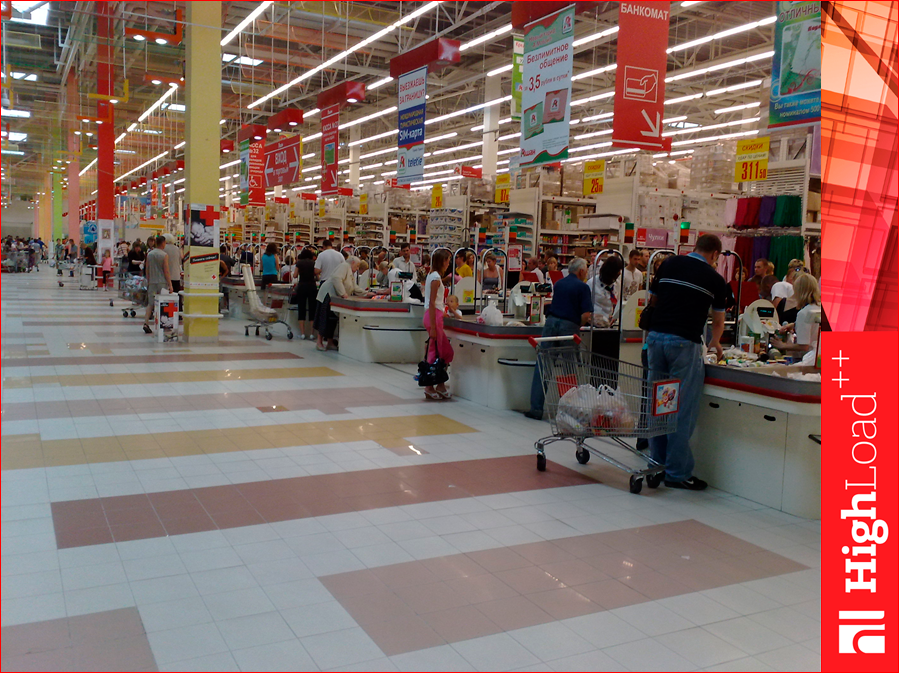
Thus, at one moment Auchan passes more people through itself. But if you want to buy something in Auchan, you must first get into the car, drive somewhere behind the Moscow Ring Road, park, get out, take a cart, spend two hours there, buy it and come home. Those. latency for you will be very large, but throughput at this store is small.
Everyone understood what is throughput and latency, if we are talking about databases? The expected request execution time is latency, and throughput is how many requests per second we are able to process.
And one more parameter that needs to be tested is the memory footprint.
Do you know how “footprint” is translated from English? Footprint. This is it.

Specially in the morning I circled my wife's leg while she was sleeping, signed it, this is a memory footprint. What is it? If we shove a GB of clean data into the database and see how much our program itself is in memory in a DBMS, then it will not be GB, it will be more. How much more is the footprint memory value. Even “in” many more times, i.e. how many bytes are we spending by 1 byte? This is an important parameter, because it determines how much we need to buy RAM. Those. This is such a monetary option.
And how are we going to test the database? There is a utility YCSB - Yahoo! Cloud Serving Benchmark. This link has its clone:

This is my github repository, there are some changes, I’ll tell you about them.
Why should this utility be used?

- Firstly, it is an industry standard, everyone trusts it, i.e. it generally tests NoSQL database.
- Further, there it is very easy to write your own load profiles, i.e. if you have some non-standard profile, then you can easily write a configuration and
to test. - It is easy to write drivers for other databases there, and there are already many standard ones, but if you have something non-standard, you can write yourself.
Why not use it? I found one big reason:
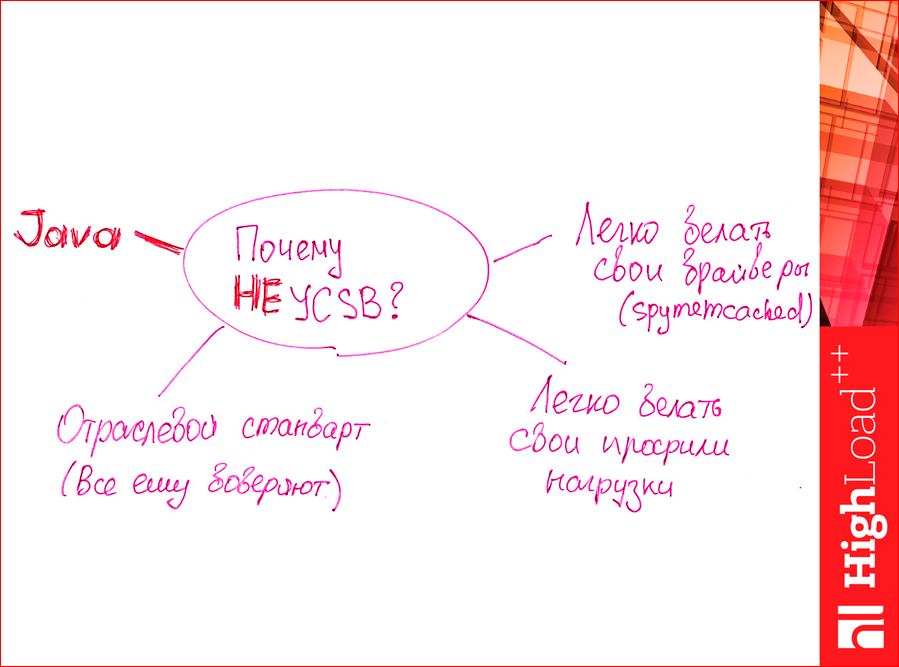
Those who love Java are probably the best you know, its negative sides. She spends a lot of resources. And, just, Kostya was talking about money, it was Java that ate my money, because the tester machine had to be ordered more powerful than if ... I thought it would take a bit there, but Java does not fit into the memory, and CPU there many cores required. I needed a more expensive machine to test, so I wrote it down to minus. But this is a minus of my personal, maybe you are a millionaire, and Java will not hurt you in this matter.
This YCSB has standard workloads. Workload is a load profile. What are they? Their six standard types are:

A is 50% of read requests, 50% is for write. Simple workload.
B is 95% read, 5% update, write.
C is 100% read-only.
Further more interesting.
D is 95% for reading, 5% for insert, but there is one specificity - it reads only what has been recently inserted. This, for example, you write news in VK, wrote, sent - this is insert. 5% insert. And your friends, you have their ton, they begin to read, F5 teasing, and the load is created like this. Those. such a profile is something like a news feed.
Profile E is a heavy scan type query. This is a range request. 5% insert and 95% scan. Those. This is when you have some kind of search on a pile of data that does not lie nearby.
And the last one is also an interesting workload. There are 50% of bare reads, and 50% of such a composition - first read, then modify, then write. Those. we read a piece, changed it and wrote it down. Quite often such a combination.
We can very easily write any layer. There are very simple configs - in five lines, we just write the percentage and the method of influence, for example, if insert, then we select the most recent data - this is for workload D.
So, how to write your driver? Because there was no memcached driver. I understand that many memcached are not considered to be a database in general. What are we doing?
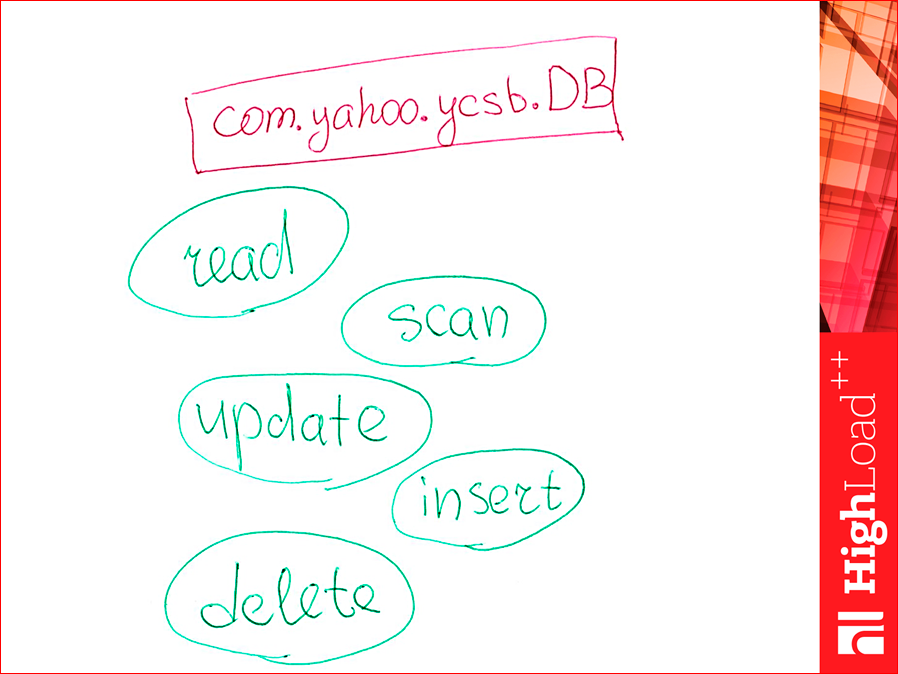
There is such a java class, we can inherit from it. We realize these. There are five methods. They are simply implementable. If some workload does not imply a method, for example, we did not have a workload with the delete method, then we can not even implement it.
We will build these graphics:
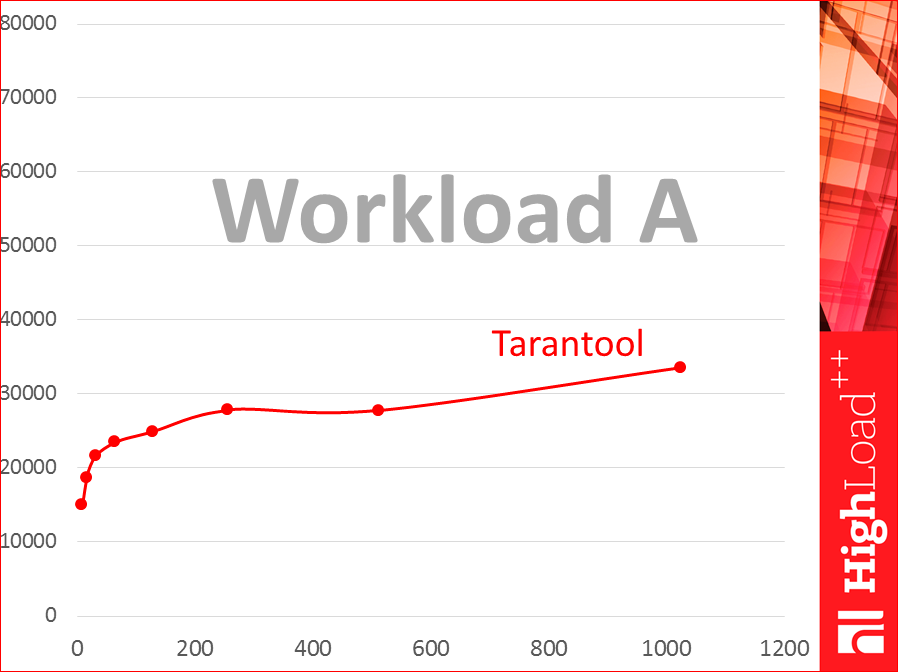
Look, horizontally we have the number of streams, and we point the logarithmically points - 8 streams, 16, 32, and so on up to 1024. And vertically - throughput schedule - how many requests per second. This is a weak, frail virtual. This is the Tarantool database. This is workload A.
How are we going to test?

It is very important that the tester machine and the database machine are located within the same data center and as close as possible in order to eliminate the influence of the network on latency.
Why not test on the same machine? I tested it. See, this is the same Tarantool on the same machine. The green one is on one machine, and the red one is on two machines. It is separate, it is together.
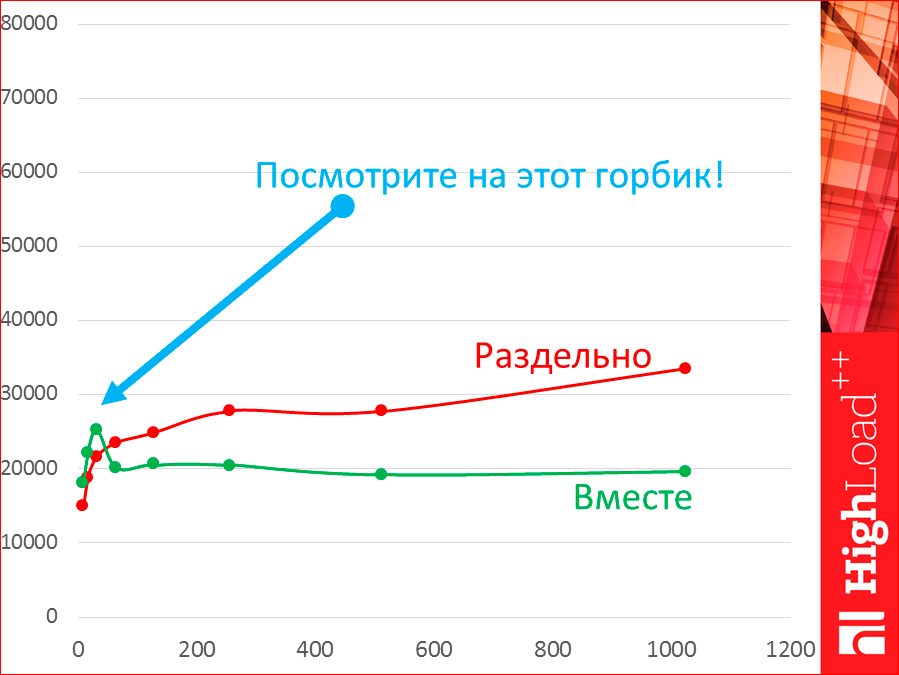
Let's take a look at this hump. While we have 8, 16, 32 threads, we really have throughput higher on one machine, but as soon as more of the two threads appear, our tester itself begins to compete for resources with the database and begins to take resources, and we fall back.
However, with latency the picture is different.
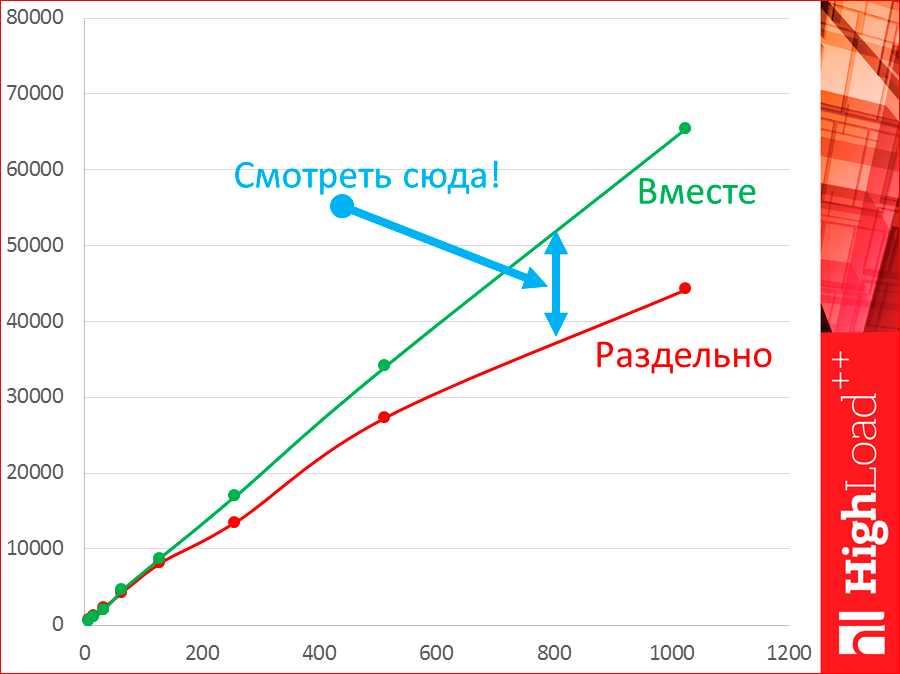
Latency, when separately, is lower, because we have some kind of network that is latency and eats, i.e. we have such a distance. When we test together, our latency will be better.
The real story is, of course, separate testing.

Further, all tests were on very frail virtualkas, very squeezed in resources. If we have a dedicated server, then we will keep the shape of the curve, but we will have a great distance.
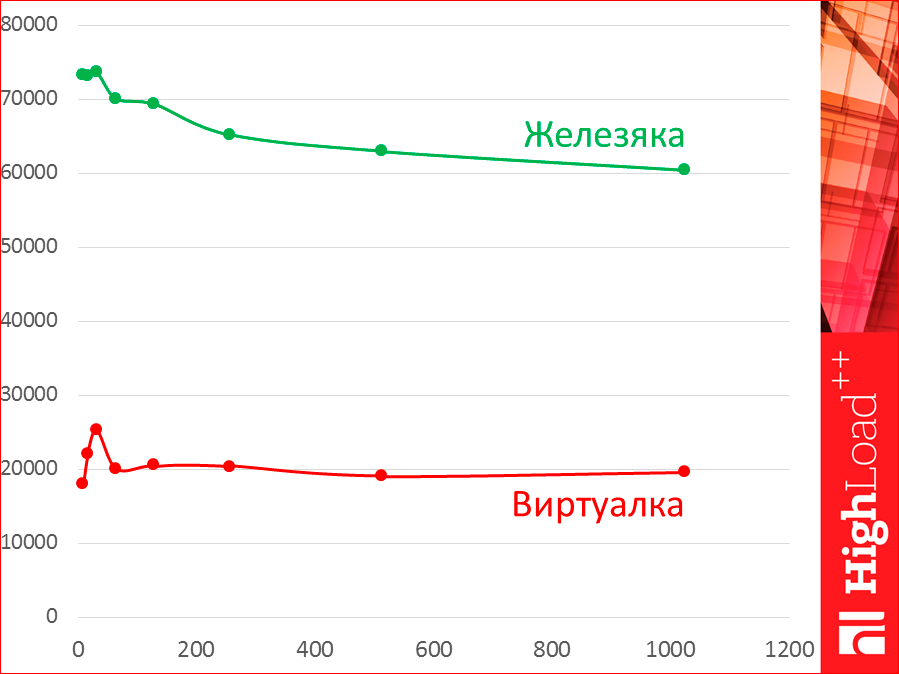
It was Azure the smallest, which is possible, or almost the smallest, with a pair of cores.

Do you know what WAL is? This is a persistence storage tool, Write-Ahead Log. How it works? You add something to the database, this is a transaction log - there at the end is recorded what you did with the database, i.e. all changes. If for some reason we turned off the power, just restarted, at the start we read it - along this log - and we read all the commands, restore the post-mortem state.
It will work differently with WAL. These all tests were without WAL. How it will work with WAL, I'll show the difference:
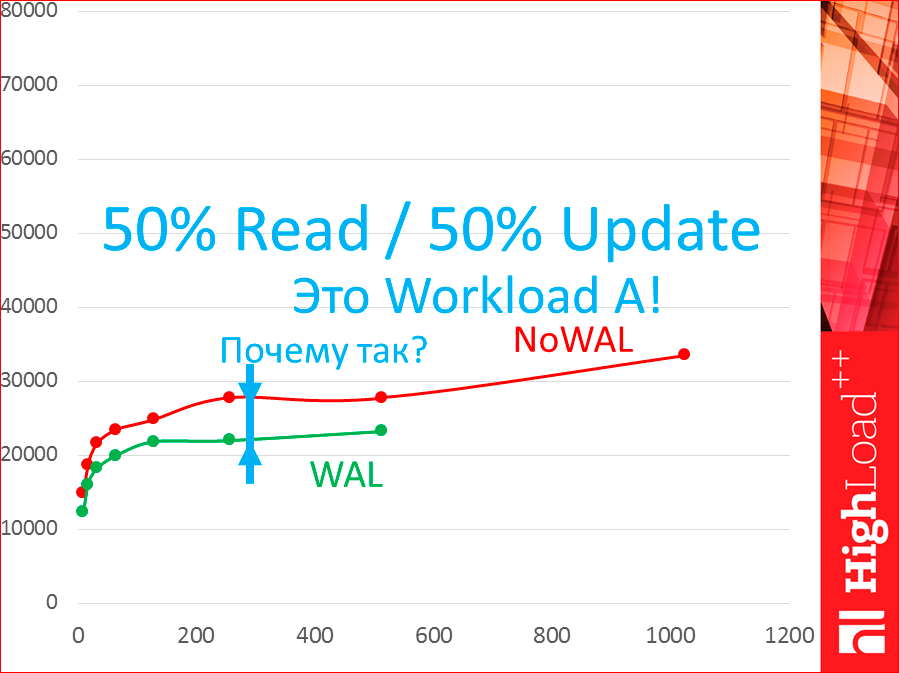
See, green is with WAL. There is a difference. This is without WAL, this is with WAL. And there is. Why the difference? This is workload A, which means that 50% read, 50% update.
If we take latency by read, see what happens:

There is no difference. Those. WAL does not affect reading at all. See how it happened?
And when we update, there is a difference:

Because we have to write to the disk and, of course, it slows down the whole thing.
Virtuals are also different. Those. why can't we take ready-made test results from the Internet? See, these are two virtuals:
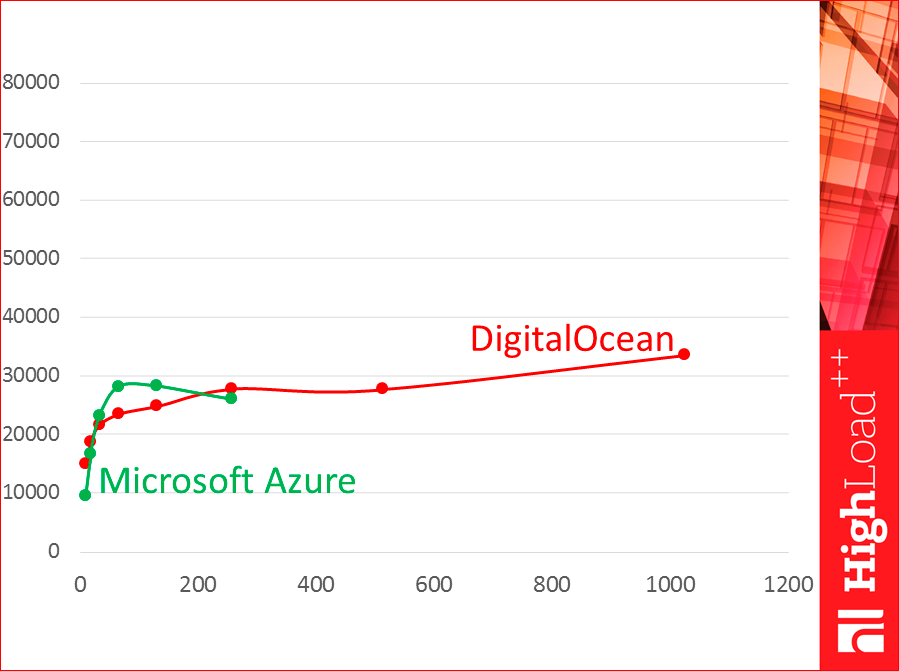
This is DigitalOcean, this is Azure. See, they work very differently.
And now - how do we, in general, choose a database? We will have, if we are talking about the engineering approach, several stages. The first stage - we choose it somehow qualitatively.
I took four databases. The first is radish.

And I just write out what is important for my project, some qualitative values, i.e. just that comes to mind, mind map paint. What does Redis have? There are Append Only Files - this is WAL, i.e. we can store some persistence. What else do you have? He has what is important for the project, for example, a developed community. If this is important to me, then I enter it myself. What else is good for Redis? It has a text protocol, but this is not good, i.e. it is written out as a minus. Typically, text protocols are slower than binary ones. This is clearly seen in the example of memcached, where there is such and such protocols and binary faster. And there are stored procedures that we often write in business logic with stored procedures, so they exist.
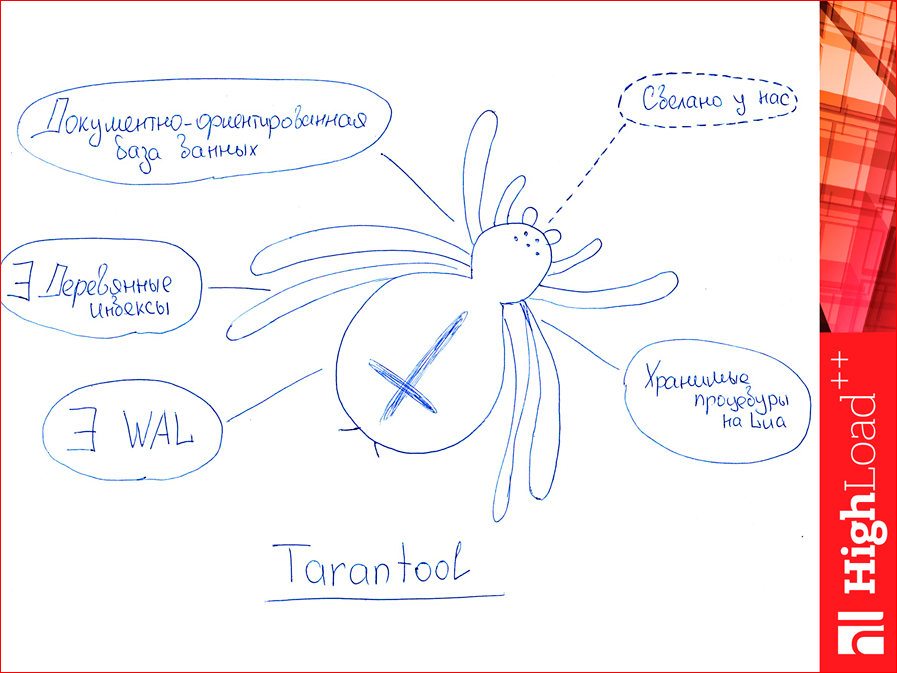
Tarantool. Who generally uses Tarantool? A bit in the hall. First, Tarantool is a document-oriented database, so real. Its main competitors are key value. Secondly, there are wooden indices (or woody? B-tree, binary tree - this is it, in general, it is such a jargon). There is also WAL in Tarantool, i.e. may have persistence. There are also snapshots there. There are stored procedures on Lua, they can also be compared. Here I will not have tests, but they can be compared with the same Redis, very interesting results are obtained. And one more piece was just for me, for you, rather, it was not so, but Tarantool was made with us, at Mail.ru, and if I have any questions (i.e., this is the same thing as the community Redis), but here I can come to Kostya Osipov and ask: “What is it?”. Therefore, I wrote this to myself in the plus sign. Specially dotted.

Next, Memcached. Do you know where the hare comes from? There are such hares on the Memcached main page. Memcached, unlike the previous two, loads all cores, it has a binary protocol, i.e. uses the old-fashioned text, but it also has a binary one, which is faster. And he has no persistence, if we fell, we all lost. Those. It is possible to use the cache as something else - it is impossible.
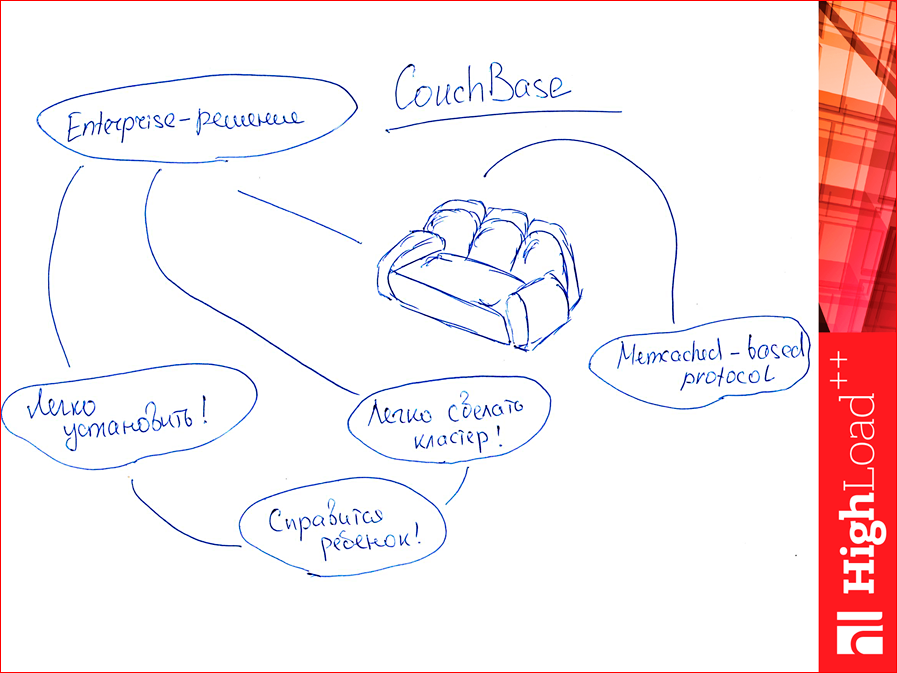
And there is CouchBase. Why, in general, CouchBase in this collection? It is slightly different. It is a complete enterprise solution. So complete that it is very easy to install. So easy that a child can handle. Moreover, it is possible to make a cluster very easily. And also the child will cope. Those. it's at the level of a couple of mouse clicks. This is very different from previous databases. And he also has a memcached protocol like memcached, well, it’s very similar, so you can use the same driver, and it’s wrong for us not to test it, this CouchBase, so we took it to the test.

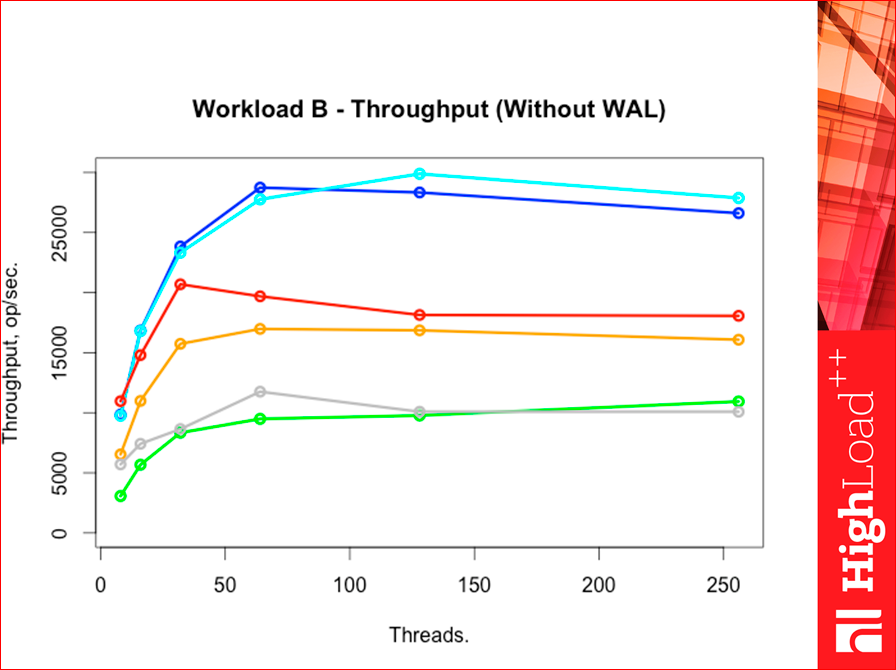
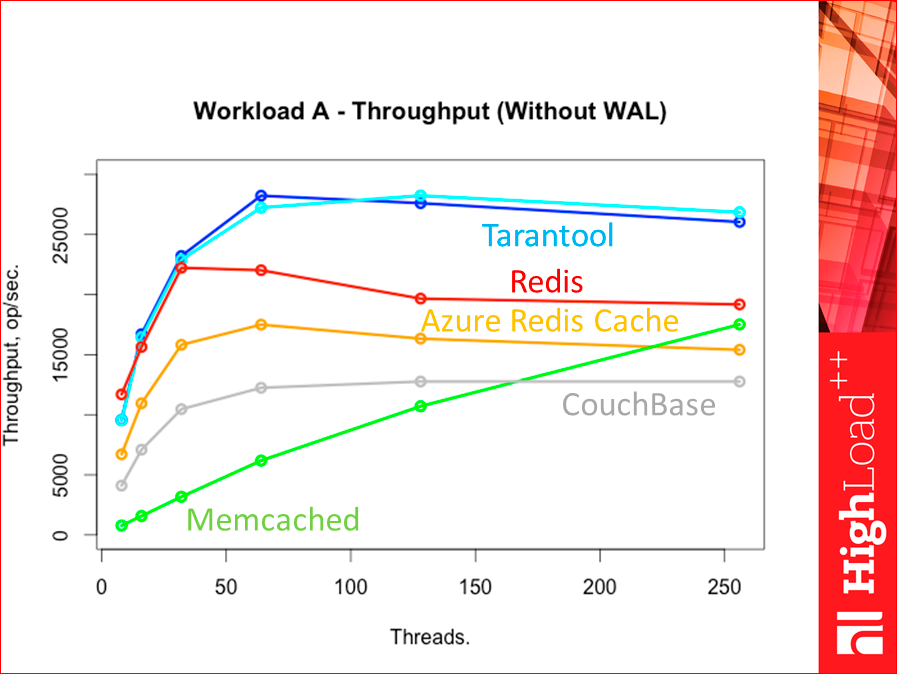
And let's test throughput. What have we got? It turned out this picture:

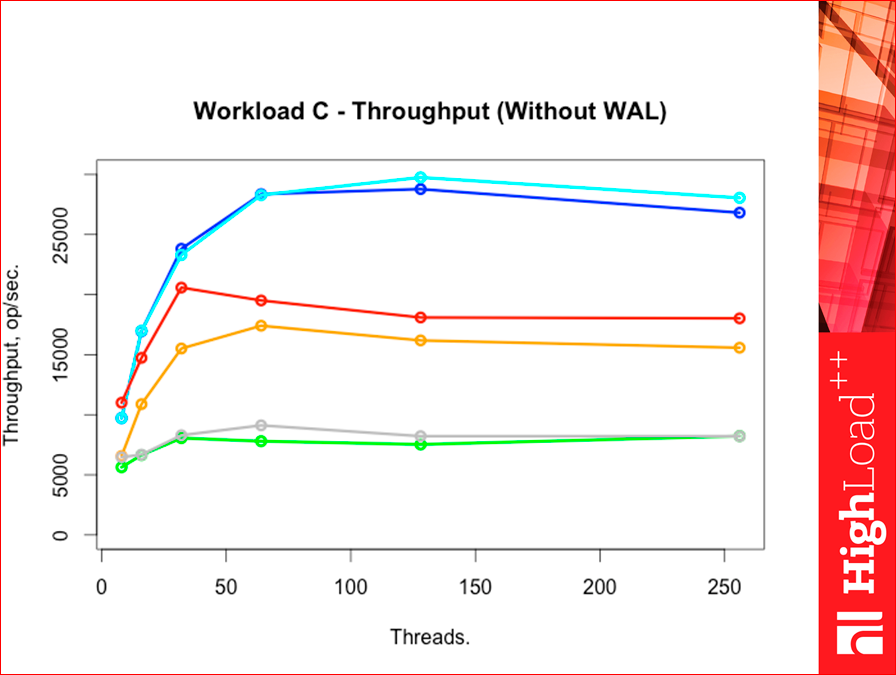
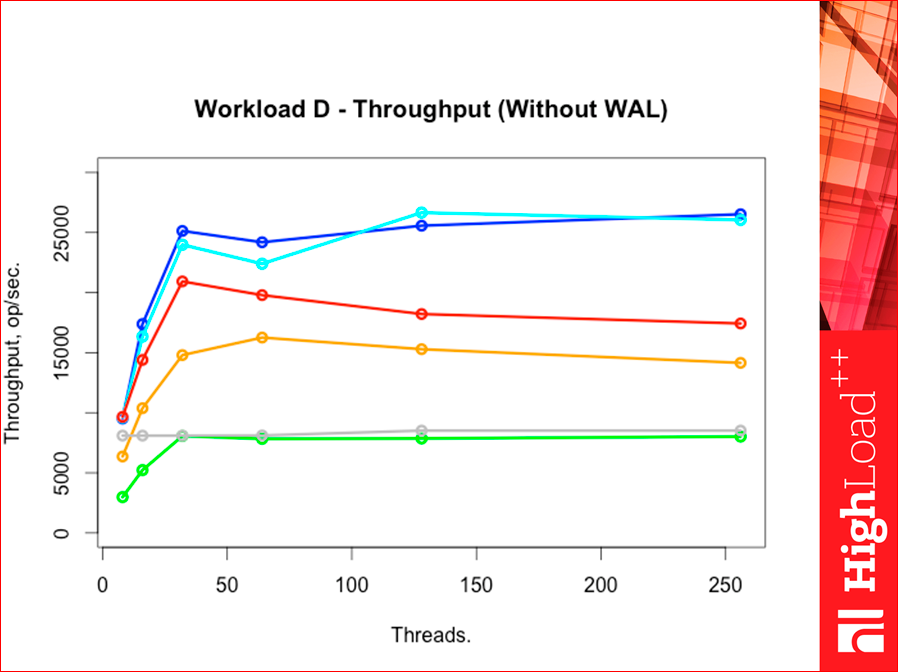
Blue is the Tarantool database. Dark blue is hash-indices, light blue is tree-indices. Red we have redis. Orange, generally speaking, also Redis, but special, it is called Azure Redis Cache. This is a service from Microsoft. It is cloudy, you can install it in the same datacenter as your test virtual machine, so you can test it. We have a gray CouchBase. And the green one is Memcached. See how memcached interestingly went. There is a hypothesis, because it loads all the cores, then it reaches the ceiling later, but it has not been tested yet.
If we change Workloads for everyone, the picture doesn’t change much.
Workload F is a heavy workload.
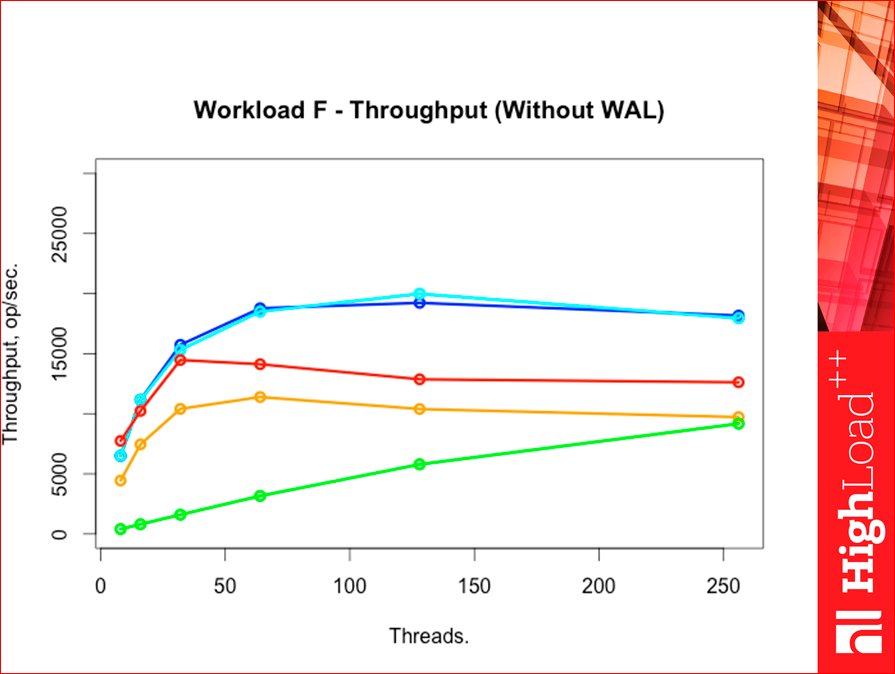
Such is the picture. Tarantool throughput was much higher than all competitors, just decent.

If you test with WAL, what will happen?
This is our picture without WAL:
And now we add WAL:
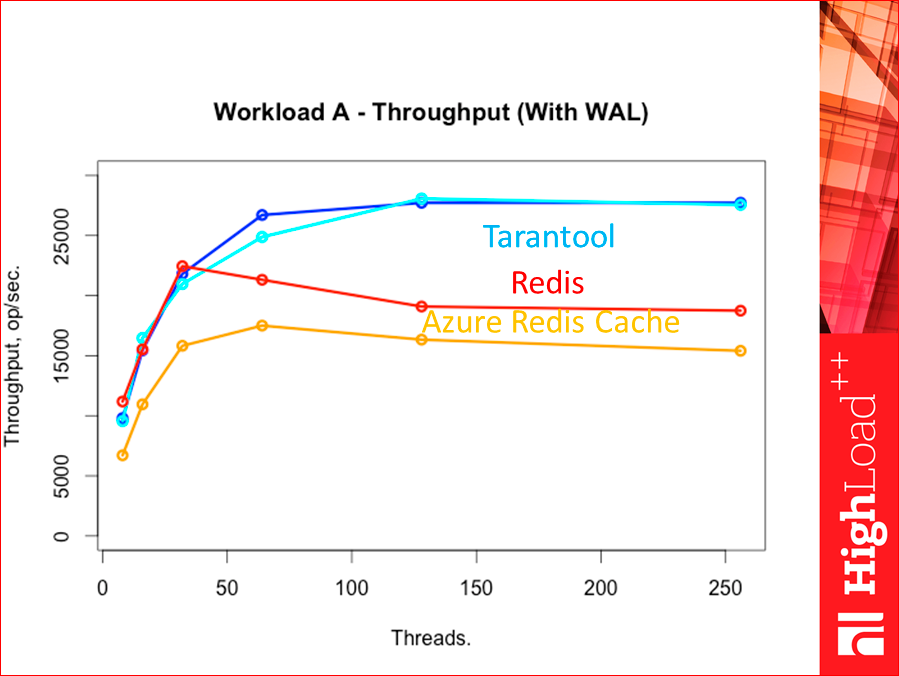
In principle, slightly decreased, but nothing changes. Tarantool and Redis - the main competition, this picture comes out. CouchBase and Memcached - they are much lower, but they do not have WAL. CouchBase has, but has not tested yet, Memcached does not.

Concerning latency. This utility Yahoo !, she counts latency on all types of commands separately. And Read latency looks like this:
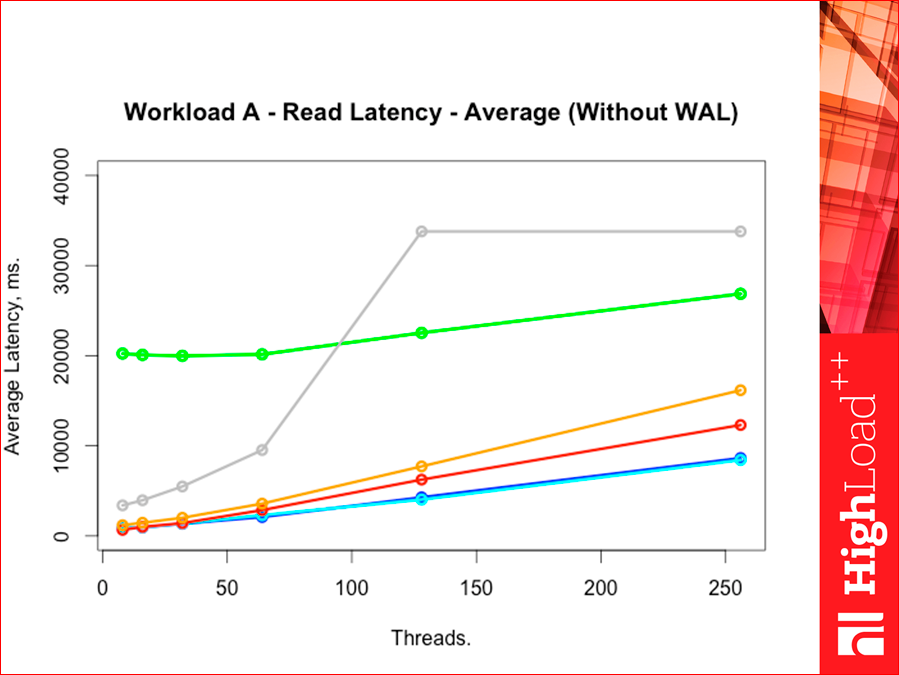
And look, latency the lower the better. Those. if throughput we looked up, then we should look down. The colors are the same, Tarantool below, then Redis. This is the latency average.

Yahoo! already gives two percents out of the box, but you can patch, he can build histograms, you can make any percentile, he gives the 95th.
And look here:
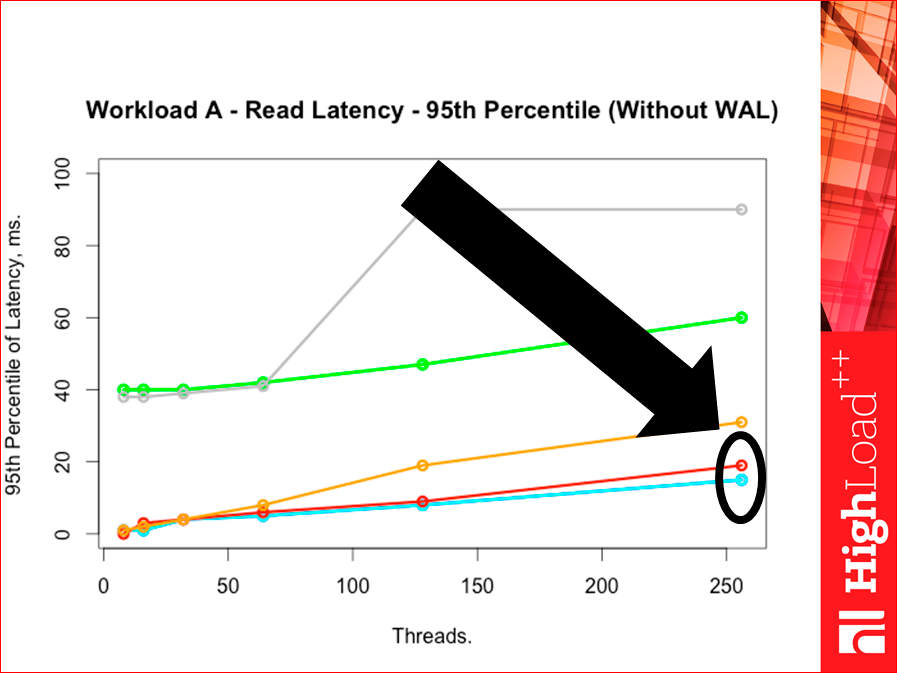
Our Redis is a bit worse than Tarantool on the 95th percentile. But on the 99th opposite:

Those. they are very close, but they change places at the 95th percentile. There is no error, there is exact data. Here the number of requests was 5 million requests, and the percentile built all these data on 5 million requests for 2 million records.
If we have Upadate (we still have workload A), then that will be:
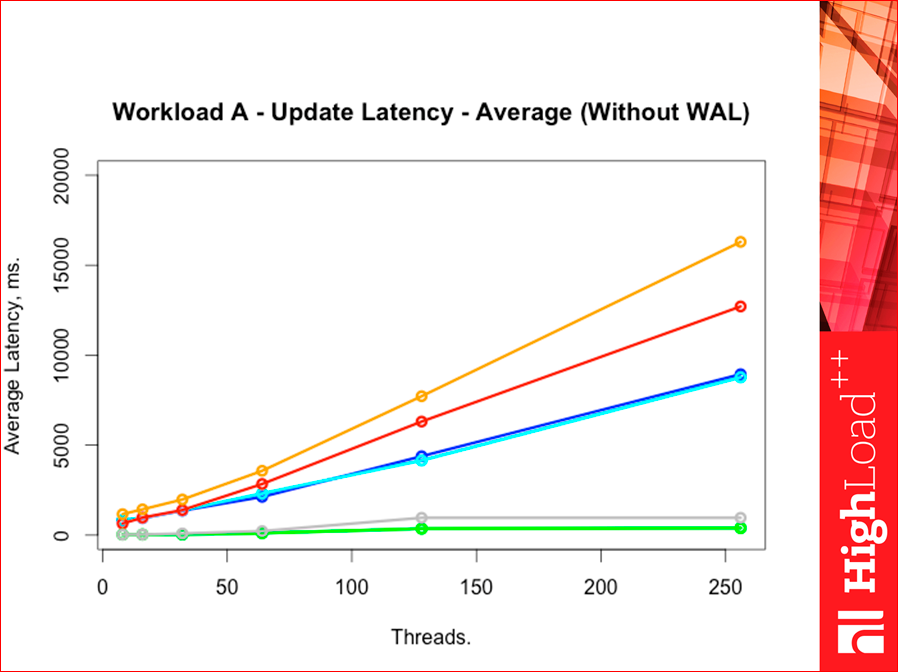
Average here we have this will be. See where Memcached turned out, I wonder how.
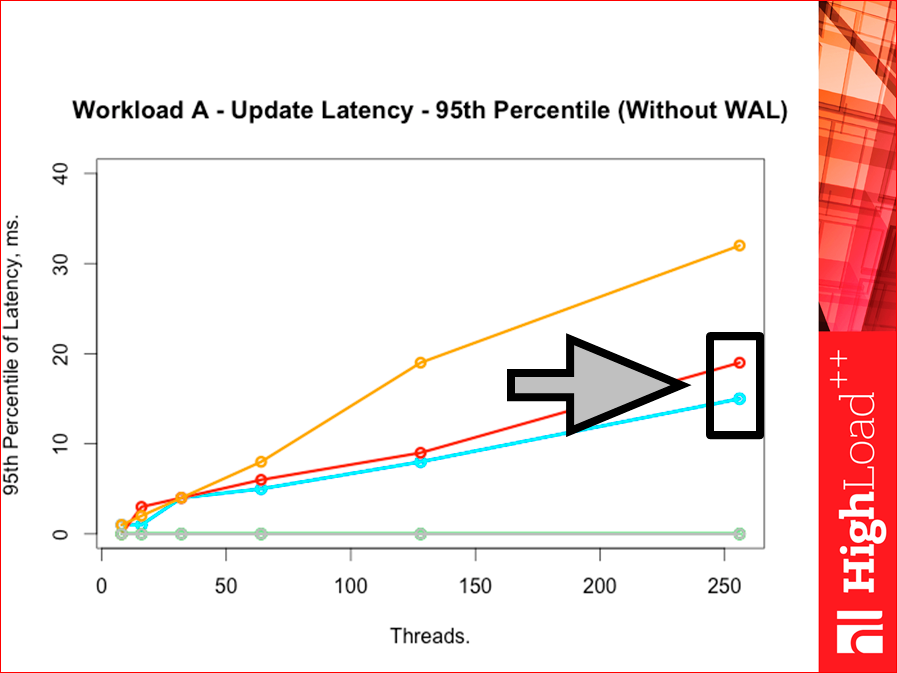
But the 95th percentile, and Tarantool is again better:
But when we go to the 99th percentile, here again Redis is better, but here the distance between them is stronger:
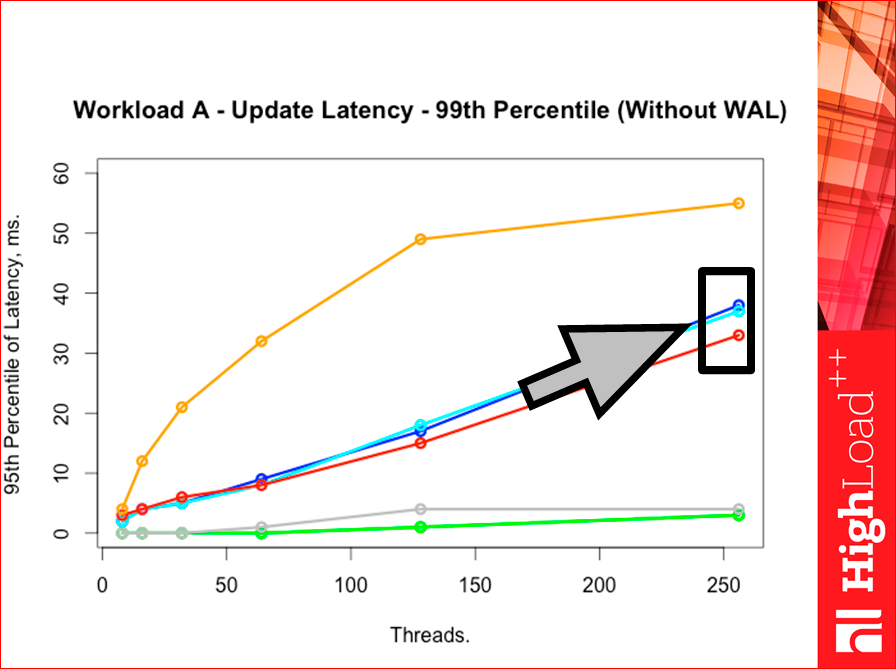
Why so what does this mean? Tarantool has a lot of fast requests, but there is a tail of slow requests, while Redis has more requests in the middle, i.e. his histogram slightly to the right goes. Tarantool has two “humps”, i.e. first, fast requests, a lot of them - 95%, and then we go further and a lot of slow requests, somewhere after the 99th, the percentile goes for Redis. And Redis has one “hump” in the middle. And if you build a bar chart, Yahoo! test can build them, then we will see. The only thing is, if there you build them yourself, then you need to build them on a logarithmic scale in X, otherwise you will not see anything.

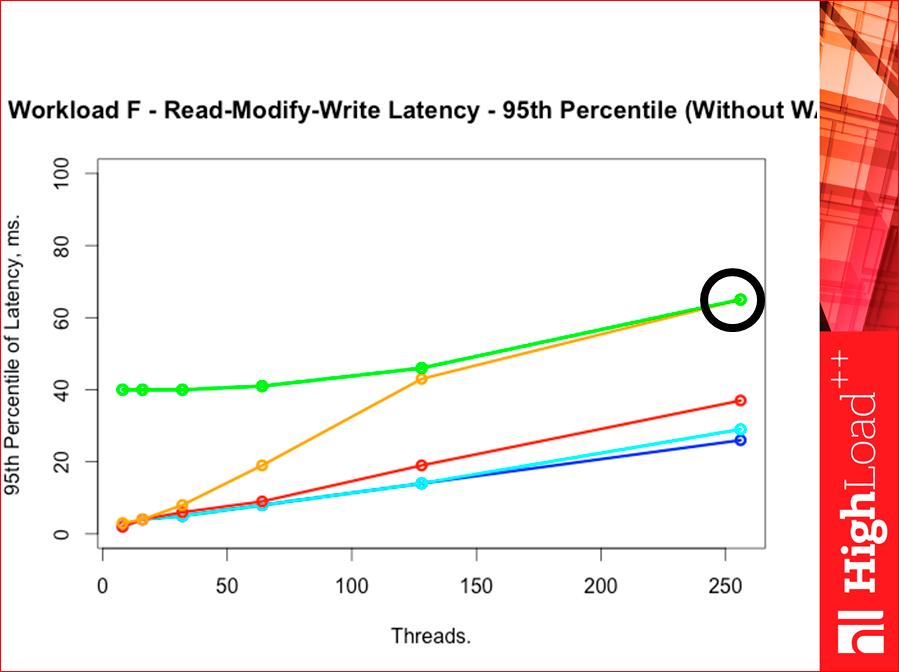
There is such an interesting command Read-Modify-Write. This is workload F. That is. read-modify-write. This is a hard command, because there throughput depends very much on latency, because we have to wait for data from readers to pass the request through ourselves.
See, there comes a picture like this:

Those. Tarantool latency much lower. And look, our Redis cloudy is very high here.
If we have the 95th percentile, Redis red pressed against Tarantool, cloudy with memcached escaped:
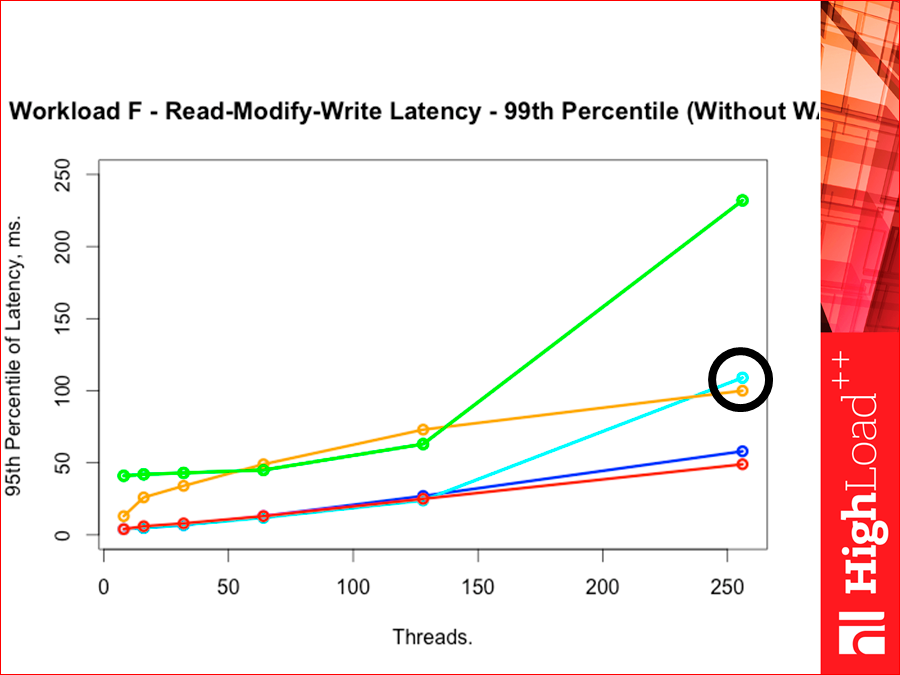
If we have the 99th percentile, then Redis is again a little overtaken by Tarantool, i.e. on the 99th pertistili Redis slightly Tarantool overtakes. Tarantool, which is with a wooden index, went up. Such is the interesting picture:
Now look, this is one way to test, Yahoo! test. I tried to write another test, tried to change a little the approach to testing, not much, tried to squeeze the maximum throughput, first of all, from the database, i.e. right up to the limit to put it on without any workloads. Such a test consists of two parts: first we hammer the data, then we subtract the data. There is a page, this is a very simple test.
Now I will tell how it works. He gave quite interesting results, apart from the fact that he gave four bugs in Tarantool, of which two crusts, which were promptly corrected, i.e. they already came out in release.

How it works? We have a bunch of pool threads to push requests to the database for throughput. There are sockets, there are n of them there, as we want, and we have two threads for each socket. One writes, generally, indiscriminately, writes, writes, writes, directly by machine. And the second reads readiness data. And there are threads for counting latency. They are few. There are many first streams and they are in pairs, streams for latency are one, sometimes two or three, and they first write, then wait for a response, read the answer, and what is highlighted there will be summed up. Special variables are atomically summed, and are considered average. Those. the percentile is not considered yet. In the near future I will do it, but for the time being it is considered average.Of course, they affect each other, but due to the fact that latency has two or three streams, and though put - there are hundreds of them, they will not be affected much. In addition, throughput strongly injects more without stopping, and latency expects. And there is a stream that once per second by the monitor reads all variables from memory and displays on the screen.
And what do we get?
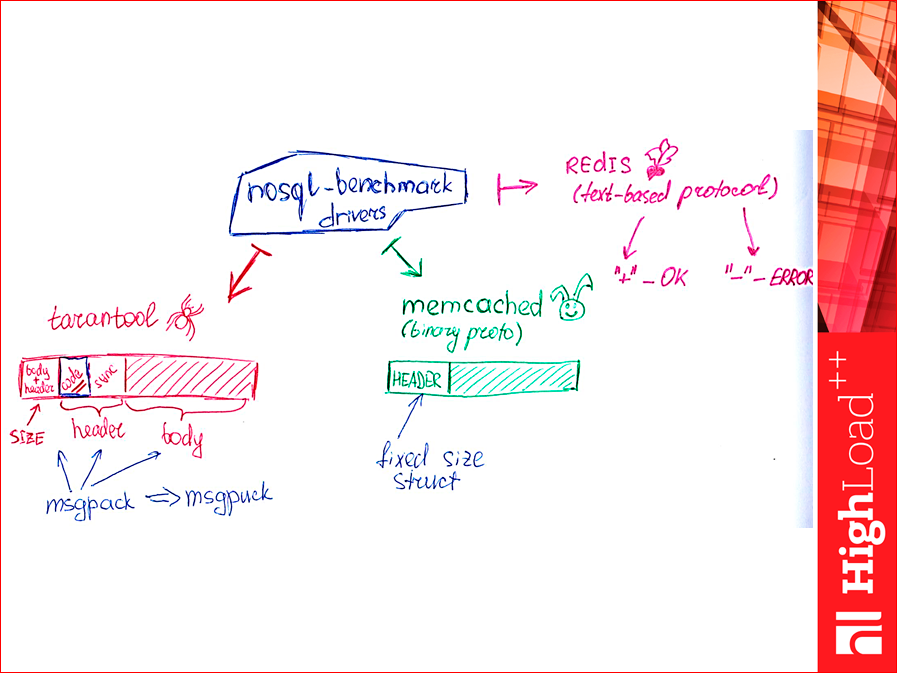
What is bad about the Yahoo! test is that it uses standard clients, i.e. it does not test the database itself, but the database in conjunction with the client. When I wrote a client for Memcached, I used spymemcached. This is a library from the authors of CouchBase, quite fast, but, nevertheless, for us it is a black box. And I set myself a goal, in general, to get rid of clients and make the simplest client, which is only for the test, it doesn’t carry functionality at all, it’s impossible to use it, it can only send requests and read answers. How to do it?See, Tarantool has three pieces there: the first is the size, header + body, and the second is the header, two numbers. We are interested in what is highlighted in blue. This is our return code - either an error or not an error. And knowing the first size field, we counted the first field, counted the header and counted the rest, knowing the size. And we simply read, read, read this business indiscriminately in these pairs of streams (see the slide even higher), there are green and red ones, which are simply read by the dray method.
Msgpack is such a binary implementation protocol. The usual library from him is slow and I tried to get rid of all the libraries, there is an implementation, also written in our company, called msgpuck. She is fast, I have modified her a little for this business.
Memcached is still easier. It has a binary protocol, a fixed size structure and plus variable field lengths. Subtracted the structure, got the return code, read the field. Everything. Those.very simple.
With Redis more difficult, he has a text protocol. If we get into the Redis protocol, we will see that any successful answer to select begins with a plus sign, i.e. “+” And then something will come back. Any mistake - with minus. And if we agree that neither in the keys, nor in the values of our data sets, which we write and read, there will be neither “+” nor “-”, then reading the bare byte stream from the socket, you can simply count the pros and count the minuses. “+” Is how many successful answers returned, “-” is how many errors returned. This implementation will be fast, i.e. "+" And "-", everything. We read if a byte is not “+”, not “-”, we skip it, if “+” or “-” we simply add the counters. And we begin to drive this thing. She chased Azure and got the following results:
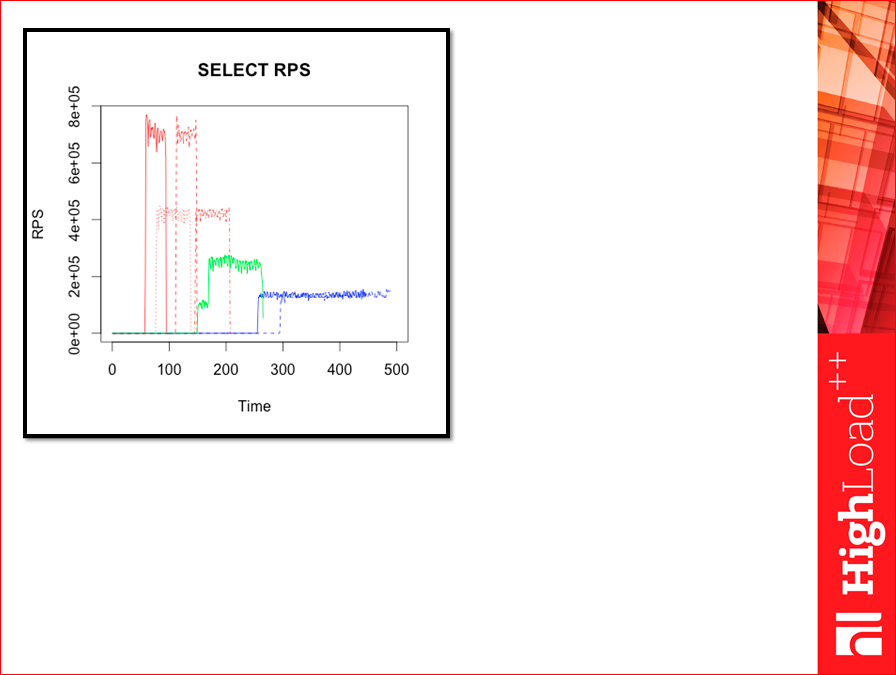
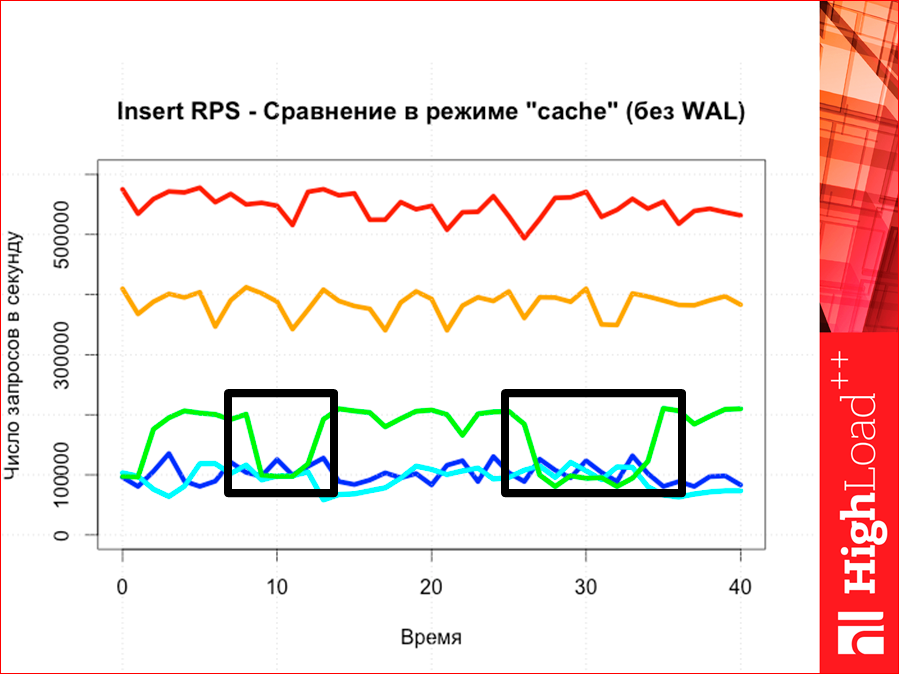
I first prepared such pictures. This is the whole test. You see, there is a beginning, these are select phases, something happens there, the RPS are quite high, they were much higher than in the Yahoo test! .. Where the dotted lines are, there is the WAL, where there are no dotted lines - without the WAL. Red - Tarantool, orange - Tarantool with a tree, green - Memcached, blue - Redis version 2.
So we had inserts:
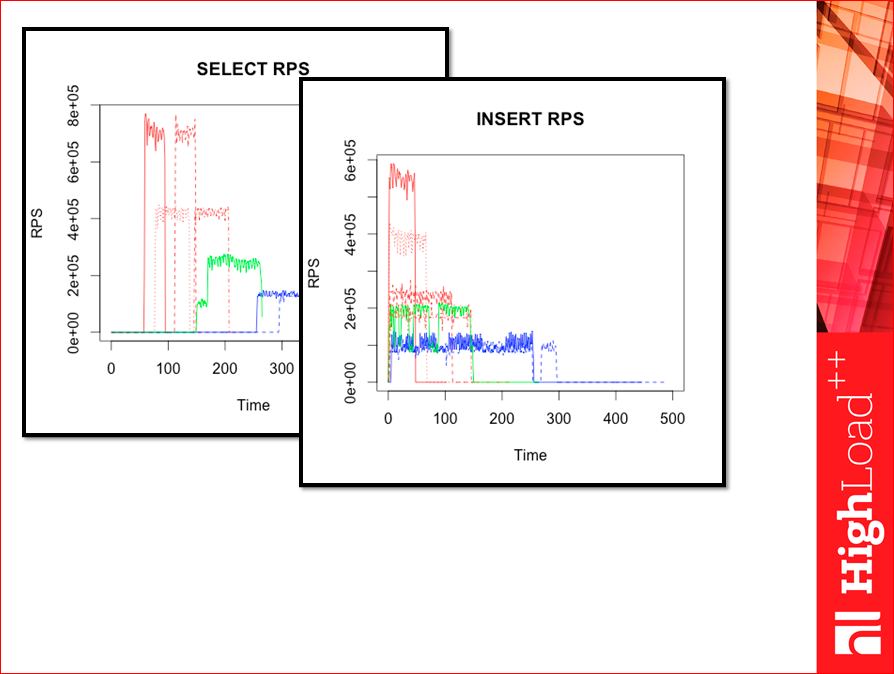
The more we have throughput, the less the test lasts, because the data is pushed faster.
And this is how latency is considered here:
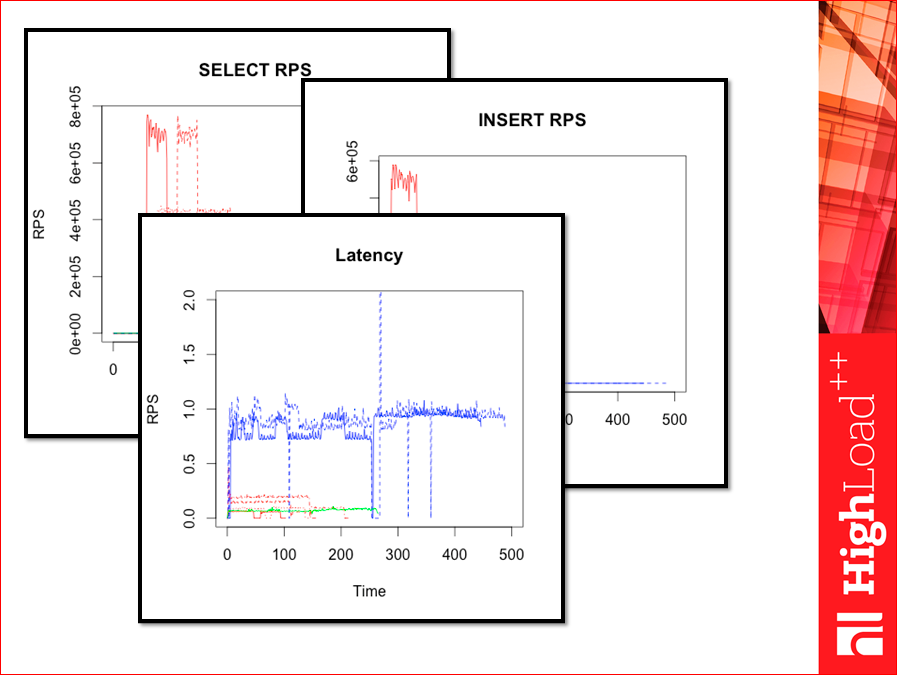
Immediately notice, this test is not based on the number of graphics streams here, but on time.

And here there are “failures”, i.e. sometimes test yahoo! It can show a good result, but when we start work, at some moments it starts to bluntly. The average, it seems, would be normal, but such stupid ones can pass. And it is desirable to build graphs on time. In Yahoo! This can be done by building small crutches. Here it is built in a rather natural way, there immediately the csv is exported to excel or somewhere else. I brought these schedules to the boss, the boss said, nonsense, unreadable. Therefore, I redraw them. Here so here:
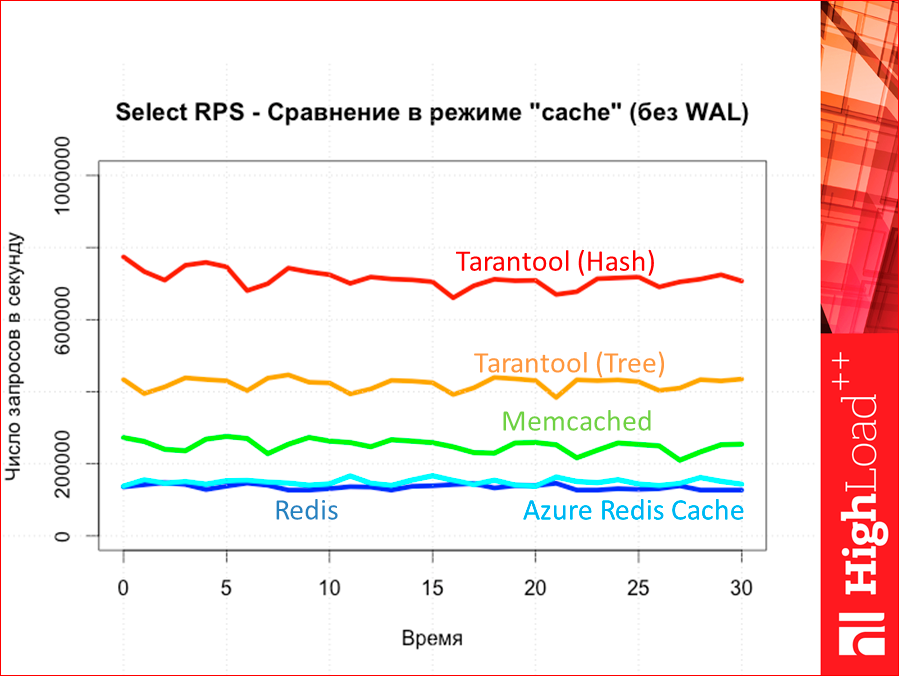
It at us throughput on. Red is Tarantool (hash), and orange is Tarantool (tree). Then Memcached and only then we have Redis and Azure Redis Cached. Here Redis version 2. Not the 3rd, the last, the 3rd a little higher or in the Memcached area will be.
If we have with WAL, then the picture does not change:

And if we have latency, then we can see, precisely, those very “failures”.
Ie, it seems, we have a big throughput, but such a thing appears, which may at some moments spoil everything that works for us here. I see.
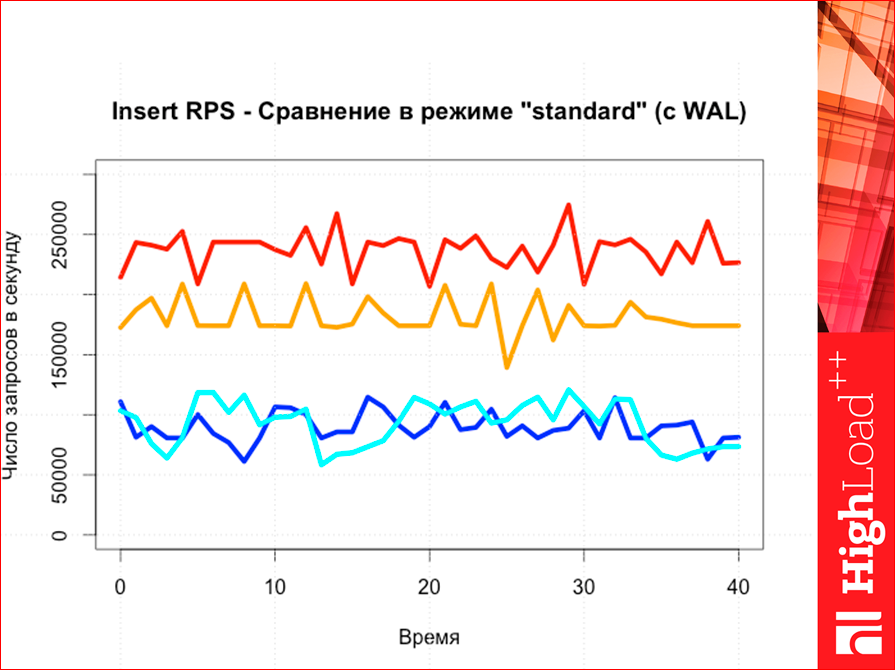
If we compare inserts, then the picture is again absolutely predictable, as we see, i.e. again tarantool above.
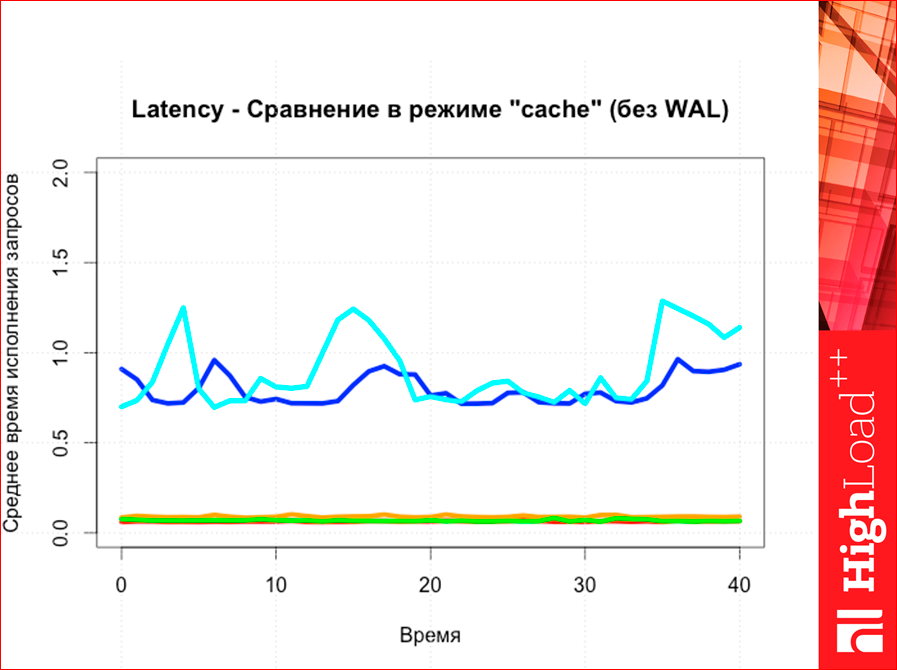
And latency. Redis latency is much higher than all the others, i.e. there are three lines - all in one.
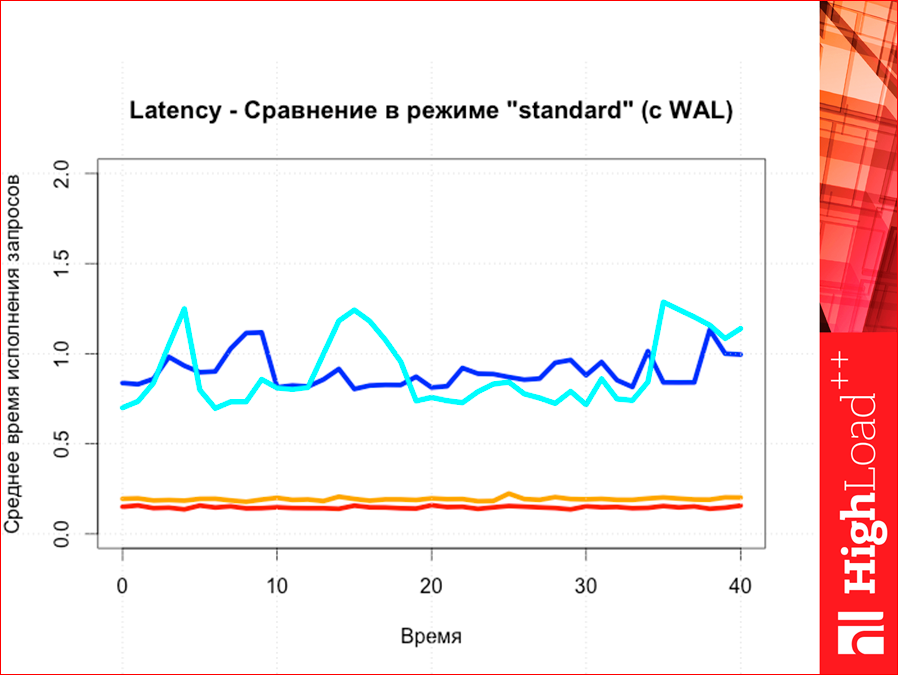
And here, too, in this way.
And how to measure memory footprint?

For this, a small script is written. It simply considers how much memory a given bit occupies with us, a given process identifier. The script is like this:

We read just RSS and we put these pieces of RSS and through bc we summarize. And we output it on the server side with timeout and add.

And at the same time, we know how much data we have left, because on the tester side, we know how many queries we sent to the database. And you can build a graph.
The charts are interesting in their own right, but the most interesting is the post-mortem state. And here is a very unexpected picture, i.e. its scope will be very unexpected.
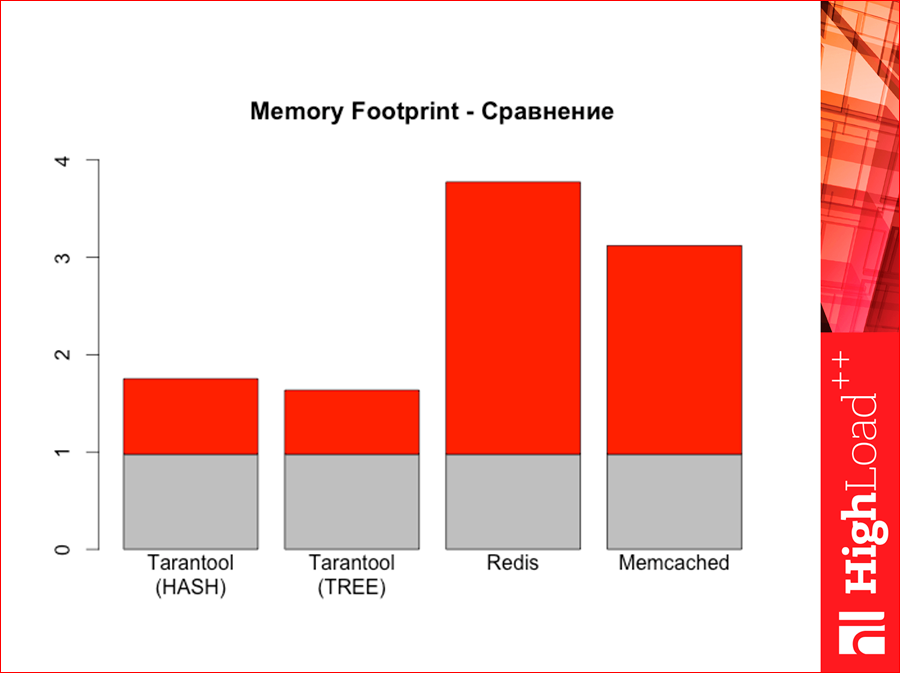
Tarantool with a hash, here is Tarantool with a tree ... Here the gray ones are how many bytes we have are physically located in the database, and the gray + red is how much memory our DBMS takes, i.e. how much RAM it spends. See what happens here - we have a lot of memory memory. Memcached is smaller. Such are the pictures.
And we are coming to an end. Those.I started with an engineering approach, as we generally choose a database, and I will remind him. We will have such a funnel:
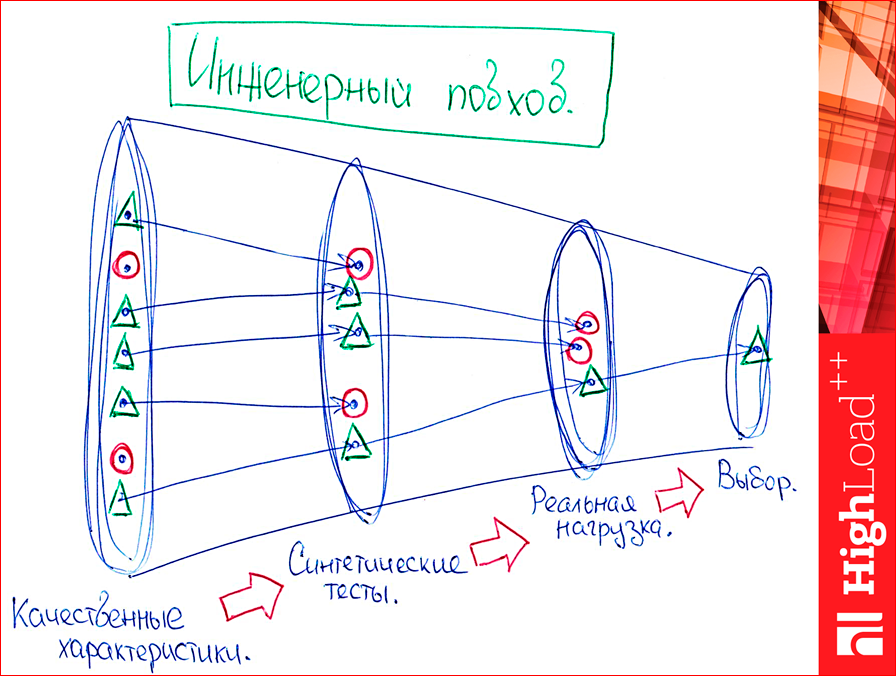
At the entrance, we have some points - these are databases. And we sift them out with every move.
There is a reasonable question: "And on hell, in general, to test on synthetics?". Immediately answer.
We have a lot of databases. I tested four of them, of course, more. Can and should be tested more. We first choose exactly according to quality characteristics, for example, we need select from range from to, we definitely need a B-tree, and we can weed out what we have with just a hash, some Memcached or anything. Or we definitely need WAL, Memcached will also be eliminated. And we will sift first by quality characteristics. We have some kind of task, and we just delete those databases. Reds are those that are not suitable.
Then we test on synthetics. Look, we have a lot of databases, in the picture we have five pieces. Why on synthetics? Because if we immediately test on real data, we die. We will have to implement business logic for all databases, and this is difficult. Synthetics is written very quickly. Any utilities, in general, “on the knee” are being made, debugged, of course, verified, so that it seems to be true, but still they are not made for long. If you write more business logic, then it takes longer, much longer.
And only then, when we have already eliminated on synthetics what is obviously not suitable for us, there are absolutely bad results in some cases, we begin to test on real data and finally choose something.
Such an approach. My goal was to show how to choose a database.
Contacts
» Rvncerr
» Mail.ru company blog
This report is a transcript of one of the best speeches at the conference of developers of high-loaded systems HighLoad ++ . Now we are actively preparing for the conference in 2016 - this year HighLoad ++ will be held in Skolkovo on November 7 and 8.
Also, some of these materials are used by us in an online training course on the development of high-load systems HighLoad.Guide is a chain of specially selected letters, articles, materials, videos. Already, in our textbook more than 30 unique materials. Get connected!
Source: https://habr.com/ru/post/312062/
All Articles