JSOC availability: metrics and measurement
We continue the series on Security Operations Center materials, and present to you the second edition.
Today's article is devoted to the “magic nines” of the availability and readiness of services. We will tell you what the service indicators of cloud SOC are made up from the point of view of hardware and software, by what means they are controlled in Solar JSOC.
The main goal of the Solar JSOC service is to identify and quickly analyze information security incidents with customers. This creates five basic conditions for its availability [1] :
It was these five postulates that formed the basis of our monitoring system used by us, which uses a similar number of levels.
Here I would like to give the typical customer wiring diagram that I used in the first article:

Using this scheme divides the access control process into the following subsystems:
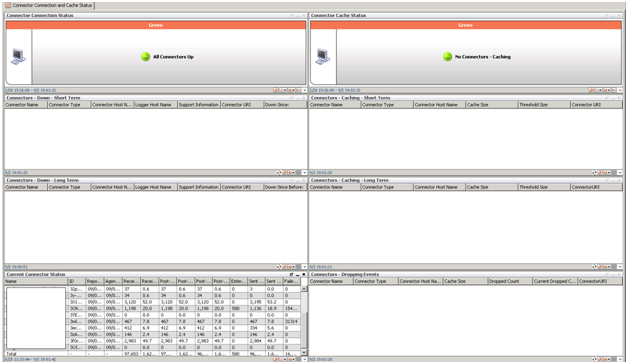
Monitoring of these indicators is fully carried out either through Zabbix, or by internal means of ArcSight. For each indicator, statistics are collected and the triggers are set to the specified threshold values: warning - 20% of the maximum value, critical - 2-5% of the maximum value. In general, everything is fairly standard, so we will not waste time on a detailed description and move on.
Using this model provides an opportunity to quickly receive information about external and internal problems in the service and potentially "narrow" places in terms of infrastructure. But the above parameters do not give us an idea of the completeness of the information we have, the necessary types of events collected from the customer's infrastructure, and the confidence that we see everything that is required to identify and respond to an incident.
This leads us to the second task - the need to control the parameters of information coming to us from source systems: completeness, relevance, correctness of its parsing. In the case of a SIEM system, the following parameters acquire criticality:
Obviously, the task to control the incoming data and analyze them for completeness and integrity is, first of all, the task of the SIEM itself. Unfortunately, out of the box it is not always possible to get acceptable results. There are certain limitations:
But against the background of the above limitations, ArcSight has high-quality mechanisms for controlling the content itself:
But, as noted in the previous article, HP ArcSight is, first of all, a framework. And we, creating Solar JSOC, modified our model of control of incoming information.
First, we changed the source definition logic. For each type of source, we identified categories of important events for us and identified the most frequent ones from them, the presence of which can be taken as a basis.
For example, for Windows, you can write this "mapping":
ArcSight allows you to simply make such a mapping through configuration files.
Previously, the source status event looked like this (on the example of Windows):
Now, in JSOC, each of our categories of events has its own status:
For each new source, long-term dynamic profiling is carried out in terms of the volume and number of events coming from it to ArcSight. As a rule, the profile measurement unit is 1 hour, the profiling duration is 1 month. The main purpose of profiling is to determine the average and maximum values of the number of events from sources at different time intervals (working day, night, weekend, etc.).
Once the profile is built, you can evaluate the completeness of the incoming information. For example, using the following rules:
Thus, the implemented “long” dynamic profiling allows us to quickly track problems in data transfer and monitor the integrity of the information coming to us.
Secondly, we have refined the standard rules and dashboards for monitoring sources. Added information about customers and two separate status tracking profiles for connectors and connected devices. As a result, all the rules are entered into a single structure for generating incidents, and a case is created for each of them (as well as when monitoring system components).
It turned out about the following: there are two dashboards near the same ESM (one is standard, the other is ours). There is no problem with standard monitoring. And our version reflects problems with connecting the connector to sources, the absence of events of a certain category and the increased flow of events from one of the devices.

One small but important problem remains: a part of audit events on target systems is very rare. For example, adding a user to a domain administrators group in Active Directory or events to change the configuration of a network device (collected through Cisco ACS tacacs-server), etc. At the same time, the very fact of the occurrence of such an event is often already an information security incident even without the additional construction of complex chains of event correlation.
In this case, we have to resort to the scripting equipment: in agreement with the customer, we emulate a test event on the target system with a certain frequency and thus make sure that random errors in working with the audit will not cause an incident not to be detected.
It is worth noting that, despite the high level of control over events, built in the framework of the model described above, we, nevertheless, regularly conduct combat tests of the audit system and our incident handling team. The methodology is as follows: the customer independently (or with our help) performs a set of actions on the sources connected to Solar JSOC, triggering various scenarios (brute-force on the system, changing the ACL to a ME, starting a remote administration session, scanning the network, etc.). First, we fix the fact of receiving all the initial information in Solar JSOC, secondly, we once again confirm the correctness of the correlation rules, well, and finally, we check the reaction and the level of incident analysis with the first line of the Solar JSOC team.
An equally important indicator of the service is the performance of the SLA. Therefore, it is very important to ensure maximum system performance when building reports, channels, reports when an incident is analyzed by a monitoring engineer or analyst.
In this case, as a rule, it is sufficient to determine the set of operations and reports necessary for investigating the most critical or frequency incidents, and to measure their execution time on the customer’s weighted average case. Information about the speed of execution we take from two sources at once.
The first one is reports and operations that are performed on a schedule and show us “reference” performance indicators. In this case, we made two types of reports that run according to a schedule: a report on a deliberately empty filter and a report on typical events (the same monitoring of sources) with summation over the fields. Based on the results of the work of these reports, we collect statistics and look at the dynamics of changes:

The second is information on the time of execution of current reports by employees.
Within the framework of the compensating measure, most of the information necessary for the analysis of the incident (information about the host, user, statistics on proxies, domain operations, recent authentication, sessions), we brought to the lists, the use of which greatly accelerates the work of the first line of case analysis. In our experience, it is rarely necessary to build channels with a search depth of more than three days.
In the presence of a large number of customers and several installations of a SIEM system, it becomes necessary to work with a single window when analyzing incidents. ArcSight's standard case management did not satisfy all of our wishes, so it was decided to switch to an external ticket system, and we chose Kayako.
Due to this transition, the number of errors due to incorrect delivery of notifications has disappeared. All routes of notifications and escalations are built automatically; the first-line engineer and analyst have access to the application for editing at the same time.
It was also possible to avoid problems with confusion in installations, when there were more than 4 of them: inside each case in Kayako there is immediately a hyperlink to the desired ArcSight ESM.
More information about the case management scheme, the features we came to, will be discussed in one of the following articles.
In the meantime, back to accessibility issues.
One of the most important moments in the provision of service is the timely analysis of incoming cases, regardless of their number and time of day.
As part of the JSOC, we have developed the following mechanisms to address these issues:
These methods allowed us to comply with the SLA metrics and quickly analyze any number of incidents registered with our customers.
This concludes the second article in the series. The next will be devoted to the case management system that we use in providing services.
Today's article is devoted to the “magic nines” of the availability and readiness of services. We will tell you what the service indicators of cloud SOC are made up from the point of view of hardware and software, by what means they are controlled in Solar JSOC.
The main goal of the Solar JSOC service is to identify and quickly analyze information security incidents with customers. This creates five basic conditions for its availability [1] :
- The platform for collecting and processing information, collecting collectors at the sites, data transmission channels should be accessible and operational with the highest possible rate. If information about events and incidents has nothing to collect and process, if it has no place to go, it is out of the question to identify incidents.
') - Information from the sources of information security events should be as complete as possible: we need to receive all the required audit events, on the basis of which the scenarios to identify incidents are built. Completeness should reflect both the necessary list of event types (start / end of the connection, authentication, etc.), and the fields within the single event (addressing, zones, processes, event parameters) required for investigation.
- At the time of recording the incident by technical means, the process of collecting and analyzing information should be as quick as possible.
- Trouble-free registration in the case management system and a guaranteed route for the delivery of alerts to the desired customer.
- Round-the-clock seamless incident analysis as part of a guaranteed SLA.
It was these five postulates that formed the basis of our monitoring system used by us, which uses a similar number of levels.
Level 1. Solar JSOC infrastructure
Here I would like to give the typical customer wiring diagram that I used in the first article:
Using this scheme divides the access control process into the following subsystems:
- Network availability component:
- availability of the SIEM-system core for the ability to work with the system of monitoring engineers;
- channel performance between the Solar JSOC kernel sites and the client: the presence of network connectivity between the connector servers and the system kernel;
- communication between connector servers and key client sources that are connected to collect events;
- availability of access from the SIEM-system core to additional servers for event processing and analysis, as well as the case management system.
- Analysis of the state of network components:
- the number of packet processing errors on network equipment;
- information on the quality of site-2-site tunnel operation between sites (session status, percentage of losses, etc.);
- utilization of network interfaces on all intermediate equipment;
- load on the Internet channel created by the transfer of traffic.
- Performance levels of hardware and OS:
- processor load and performance;
- use and distribution of RAM;
- availability of free space in the file partitions (system, productive and partition for backup);
- general performance of the disk subsystem.
- Monitoring the status of key system and application services at the OS level:
- Monitoring for system log errors:
- network equipment and firewalls;
- virtualization tools;
- OS on kernel components and connector servers.
- Monitor connector logs and the ArcSight core for errors.
- Monitor the performance of the ArcSight database (read / write options).
Monitoring of these indicators is fully carried out either through Zabbix, or by internal means of ArcSight. For each indicator, statistics are collected and the triggers are set to the specified threshold values: warning - 20% of the maximum value, critical - 2-5% of the maximum value. In general, everything is fairly standard, so we will not waste time on a detailed description and move on.
Using this model provides an opportunity to quickly receive information about external and internal problems in the service and potentially "narrow" places in terms of infrastructure. But the above parameters do not give us an idea of the completeness of the information we have, the necessary types of events collected from the customer's infrastructure, and the confidence that we see everything that is required to identify and respond to an incident.
Level 2. Completeness of information from sources
This leads us to the second task - the need to control the parameters of information coming to us from source systems: completeness, relevance, correctness of its parsing. In the case of a SIEM system, the following parameters acquire criticality:
- control not only the state of sources, but also incoming types of events;
- detection and prevention of parsing errors: a clear understanding of the correct event handling is necessary for the successful operation of the correlation rules;
- the desire to receive events in real-time mode with minimal losses.
Obviously, the task to control the incoming data and analyze them for completeness and integrity is, first of all, the task of the SIEM itself. Unfortunately, out of the box it is not always possible to get acceptable results. There are certain limitations:
- "Out of the box" does not take into account the ability to connect to one SIEM-system of several customers.
Therefore, although ArcSight has a sufficiently high-quality mechanism for determining the state of connected systems (in case of connectors falling, problems with availability of end sources or cache presence on the connector, the built-in correlation rules + visualization work), all “boxed” rules and dashboards are not suitable for cloud SOC tasks. - Limited functionality to determine the absence of information from the source of events according to the principle “there has not been a single event in the last N hours.”
The first difficulty (or a feature, whichever one you like more) is that the control goes over the whole source (Microsoft Windows, Websense Proxy, McAfee ePolicy) and various types of events are not taken into account. The second difficulty is that the out-of-the-box solution does not allow for monitoring events based on their normal number and deviation from the profile.
As an example, consider gathering events from a Cisco ASA firewall with the required audit level. One of the most important tasks in monitoring this equipment is to identify and process remote access VPN sessions that are terminated by a firewall. At the same time, in the general flow of events they make up less than 1%. Their absence (for example, due to changes in audit settings) in the total volume of events may simply go unnoticed.
But against the background of the above limitations, ArcSight has high-quality mechanisms for controlling the content itself:
- The presence of a built-in mechanism for parsing events and assessing the success of its normalization.
This mechanism signals that the received event was not successfully parsed by the connector due to a format mismatch.
This event is called the “Unparsed Event”, and notification of it can be delivered either by mail or by creating a case directly in the ArcSight console. This mechanism helps to successfully solve the problem number 2 - to form an idea of the completeness of the information received. - A mechanism to control the time stamps of incoming events and ArcSight time.
Together with the definition of caching of events on the connector, this is almost a ready-made solution to the problem of promptly collecting and analyzing information. In addition, along the way, there are facts of incorrect time settings on the devices.
But, as noted in the previous article, HP ArcSight is, first of all, a framework. And we, creating Solar JSOC, modified our model of control of incoming information.
First, we changed the source definition logic. For each type of source, we identified categories of important events for us and identified the most frequent ones from them, the presence of which can be taken as a basis.
For example, for Windows, you can write this "mapping":
4624, Logon / Logoff: Logon
4768, Account Logon: Kerberos Ticket Events
4663, Object Access: File System
4688, Detailed Tracking: Process Creation
4689, Detailed Tracking: Process Termination
4672, Logon / Logoff: Special Logon
5140, Object Access: File Share
etc.
For Cisco ASA, this is:
602303,602304,713228,713050, VPN Connection
302013-302016, SessionStatistic
106023, AccessDenied
etc.
ArcSight allows you to simply make such a mapping through configuration files.
Previously, the source status event looked like this (on the example of Windows):
| Timestamp | CustomerName | ConnectorName | Eventname | DeviceName | Event count | DeviceVendor | DeviceProduct |
| 28 Jun 2016 15:23:36 MSK | Solar security | Solar_Windows Srv Connector | Status - OK | ex-hub1 - 10.199. *. * | 164152 | Microsoft | Microsoft Windows |
Now, in JSOC, each of our categories of events has its own status:
| Timestamp | CustomerName | ConnectorName | Eventname | DeviceName | Event count | DeviceVendor | DeviceProduct |
| 28 Jun 2016 15:23:36 MSK | Solar security | Solar_Windows Srv Connector | Status - OK | ex-hub1 - 10.199. *. * | 35423 | Microsoft | Object Access: File Share |
| 28 Jun 2016 15:23:36 MSK | Solar security | Solar_Windows Srv Connector | Status - OK | ex-hub1 - 10.199. *. * | 7576 | Microsoft | Logon / Logoff: Logon |
| 28 Jun 2016 15:23:36 MSK | Solar security | Solar_Windows Srv Connector | Status - OK | ex-hub1 - 10.199. *. * | 1530 | Microsoft | Detailed Tracking: Process Creation |
For each new source, long-term dynamic profiling is carried out in terms of the volume and number of events coming from it to ArcSight. As a rule, the profile measurement unit is 1 hour, the profiling duration is 1 month. The main purpose of profiling is to determine the average and maximum values of the number of events from sources at different time intervals (working day, night, weekend, etc.).
Once the profile is built, you can evaluate the completeness of the incoming information. For example, using the following rules:
- The absence of events is determined not by a given interval, but by comparison with a profile that takes into account whether there should be events from a given source during this period of time.
- If the number of events in the last hour is 20% less / more than the baseline at similar intervals in our profile, this is considered a deviation and, therefore, the reason for more detailed understanding of the situation.
- If there are new types of events from new sources, we automatically determine this by the absence of a filled profile. This may occur if the customer, for example, changed the level of audit settings at the source, or “wrapped” a new piece of hardware to UDP Syslog in the direction of the connector server.
Thus, the implemented “long” dynamic profiling allows us to quickly track problems in data transfer and monitor the integrity of the information coming to us.
Secondly, we have refined the standard rules and dashboards for monitoring sources. Added information about customers and two separate status tracking profiles for connectors and connected devices. As a result, all the rules are entered into a single structure for generating incidents, and a case is created for each of them (as well as when monitoring system components).
It turned out about the following: there are two dashboards near the same ESM (one is standard, the other is ours). There is no problem with standard monitoring. And our version reflects problems with connecting the connector to sources, the absence of events of a certain category and the increased flow of events from one of the devices.
One small but important problem remains: a part of audit events on target systems is very rare. For example, adding a user to a domain administrators group in Active Directory or events to change the configuration of a network device (collected through Cisco ACS tacacs-server), etc. At the same time, the very fact of the occurrence of such an event is often already an information security incident even without the additional construction of complex chains of event correlation.
In this case, we have to resort to the scripting equipment: in agreement with the customer, we emulate a test event on the target system with a certain frequency and thus make sure that random errors in working with the audit will not cause an incident not to be detected.
It is worth noting that, despite the high level of control over events, built in the framework of the model described above, we, nevertheless, regularly conduct combat tests of the audit system and our incident handling team. The methodology is as follows: the customer independently (or with our help) performs a set of actions on the sources connected to Solar JSOC, triggering various scenarios (brute-force on the system, changing the ACL to a ME, starting a remote administration session, scanning the network, etc.). First, we fix the fact of receiving all the initial information in Solar JSOC, secondly, we once again confirm the correctness of the correlation rules, well, and finally, we check the reaction and the level of incident analysis with the first line of the Solar JSOC team.
Level 3. Speed
An equally important indicator of the service is the performance of the SLA. Therefore, it is very important to ensure maximum system performance when building reports, channels, reports when an incident is analyzed by a monitoring engineer or analyst.
In this case, as a rule, it is sufficient to determine the set of operations and reports necessary for investigating the most critical or frequency incidents, and to measure their execution time on the customer’s weighted average case. Information about the speed of execution we take from two sources at once.
The first one is reports and operations that are performed on a schedule and show us “reference” performance indicators. In this case, we made two types of reports that run according to a schedule: a report on a deliberately empty filter and a report on typical events (the same monitoring of sources) with summation over the fields. Based on the results of the work of these reports, we collect statistics and look at the dynamics of changes:
The second is information on the time of execution of current reports by employees.
Within the framework of the compensating measure, most of the information necessary for the analysis of the incident (information about the host, user, statistics on proxies, domain operations, recent authentication, sessions), we brought to the lists, the use of which greatly accelerates the work of the first line of case analysis. In our experience, it is rarely necessary to build channels with a search depth of more than three days.
Level 4. Case management and customer notification
In the presence of a large number of customers and several installations of a SIEM system, it becomes necessary to work with a single window when analyzing incidents. ArcSight's standard case management did not satisfy all of our wishes, so it was decided to switch to an external ticket system, and we chose Kayako.
Due to this transition, the number of errors due to incorrect delivery of notifications has disappeared. All routes of notifications and escalations are built automatically; the first-line engineer and analyst have access to the application for editing at the same time.
It was also possible to avoid problems with confusion in installations, when there were more than 4 of them: inside each case in Kayako there is immediately a hyperlink to the desired ArcSight ESM.
More information about the case management scheme, the features we came to, will be discussed in one of the following articles.
In the meantime, back to accessibility issues.
Level 5. People and SLA
One of the most important moments in the provision of service is the timely analysis of incoming cases, regardless of their number and time of day.
As part of the JSOC, we have developed the following mechanisms to address these issues:
- With the introduction of the round-the-clock shift, there is a buffer zone in the morning and evening — a shift from 9 to 10 in the morning and from 8 to 9 in the evening. This is the stage when night and day shifts intersect. The previous shift closes those cases that arose before the shift change, transmits relevant information to the customer, indicates important points that occurred in their shift (for example, an attack on the customer, the need for regular monitoring of certain hosts, etc.). New shift is included in the work and begins to disassemble the cases that come in shift change.
- For emergency situations with a large number of incidents, there are reserves. During the day this is the second line of monitoring and analytics. At night, there is one monitoring engineer in the shift, and the second is always waiting “at a low start”, ready to join the case study for 15 minutes. In addition, there is a duty analyst who owns information on all customers and is connected to the analysis in the event of an escalation of criticality, expertise, or number of incidents. Or around at the same time.
These methods allowed us to comply with the SLA metrics and quickly analyze any number of incidents registered with our customers.
This concludes the second article in the series. The next will be devoted to the case management system that we use in providing services.
- ↑ Then I will use this term, although many will probably accuse me of misusing established terms. From the point of view of GOST R 53480-2009, there is the concept of “readiness”, the concept of “accessibility” is absent. There is also the IEC 60050, which uses several concepts: accessibility, availability, capability. But within this article, for simplicity and time saving, I will use only one “well-established” term - accessibility. It may not be entirely technically correct, but, in my opinion, it best reflects the objectives of the business.
Source: https://habr.com/ru/post/311770/
All Articles