How to make toast and visualize IT systems at the same time
Greetings, dear readers! In this article I want to share the story of the preparation of toasts and tell you how we expanded the functionality of Zabbix using a coil of wire and an integrated chip of Open Source solutions. Everything in order, I ask under the cat.

Let's imagine the following: you work in an organization (it can be yours), which has a business process supported by one or more IT systems. I know for sure that there is a monitoring system. Then the vision blurs a little, and it is not clear: is it an industrial system or a free Open Source. However, you have situations when all the sensors on it are green, but the business process itself gives inexplicable failures, showing a decrease in key indicators. As a stun gun outbreak at a unauthorized rally, the thought that the situation is out of control and you need to act immediately rises in your head. Only now it is not clear how. I tell you, this is a fairly common case, from the manifestations of which it is desirable to quickly get rid of. A systematic approach to solving this problem will provide a service model.
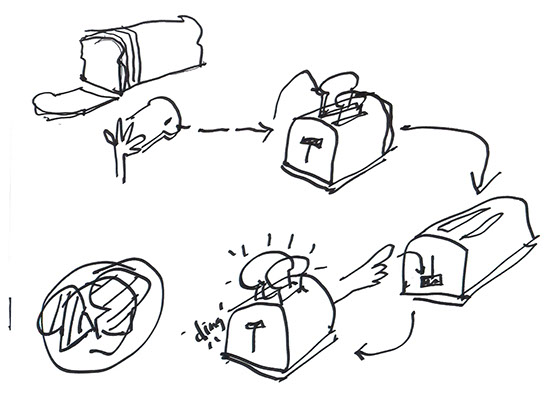
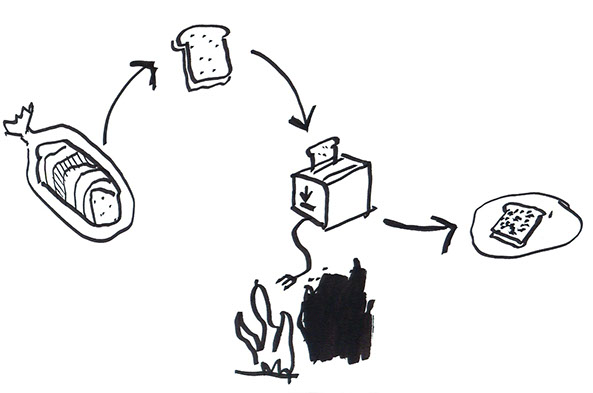
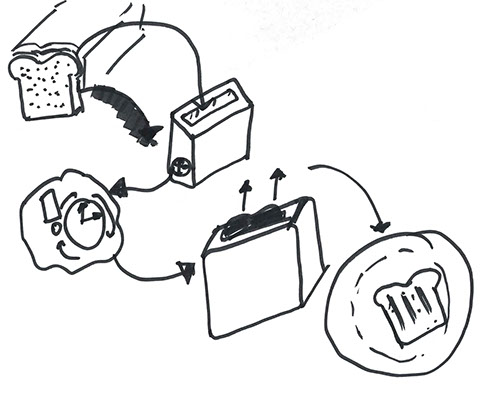
Tom Wudzek , who provides services for the visualization of processes occurring in companies (not only IT), conducted a curious study. He asked different people to draw a process of making toasts. Below are some results of this work.
What do we see in many pictures? Right! Objects and connections present in any system. The more of them, the more systematic the approach will be. The correct degree of granularity will allow you to more accurately track the "health" of the business system. You can try to use Visio to build a scheme, but it is much more interesting to take a marker for drawing links, sticky note paper for objects and draw your system on a whiteboard. The greater the number of yellow leaves, the more connections, the higher the chance to determine the maximum number of monitoring points to accurately determine the source of the problem.
')
And now it's time to talk about our developments in the field of expanding the standard Zabbix functionality and applying the systematic approach described above. There are exactly two of them.
The first is mapping systems and creating a heat map of services. Considering our serious experience in monitoring banking business processes, we will give an example from this area. Consider the three most typical banking systems. If there are more typical systems in your bank, please excuse me - we will not consider them here.
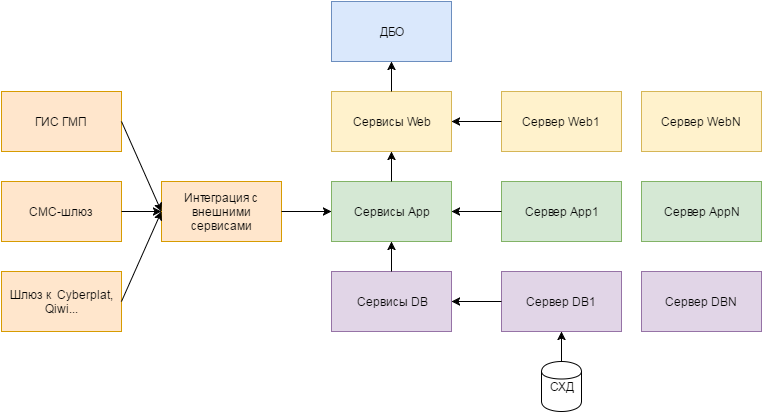
Remote Banking System (RB):
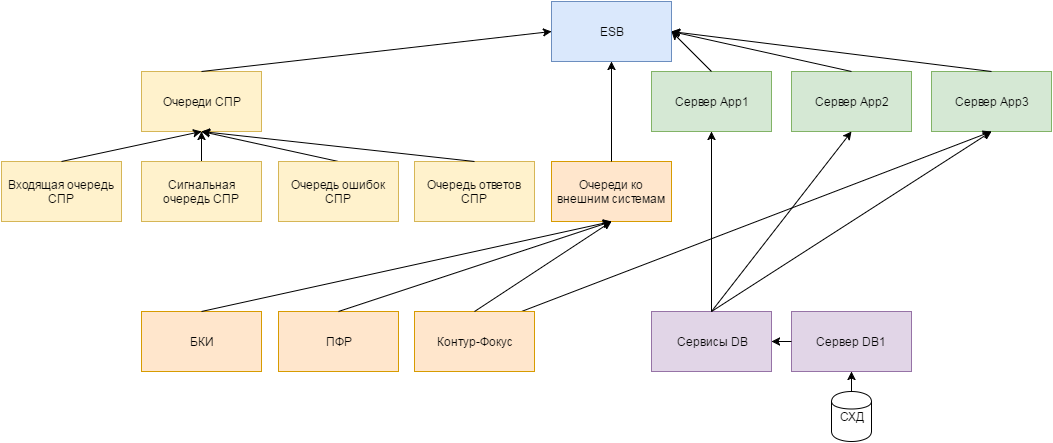
Corporate data transmission bus (ESB):
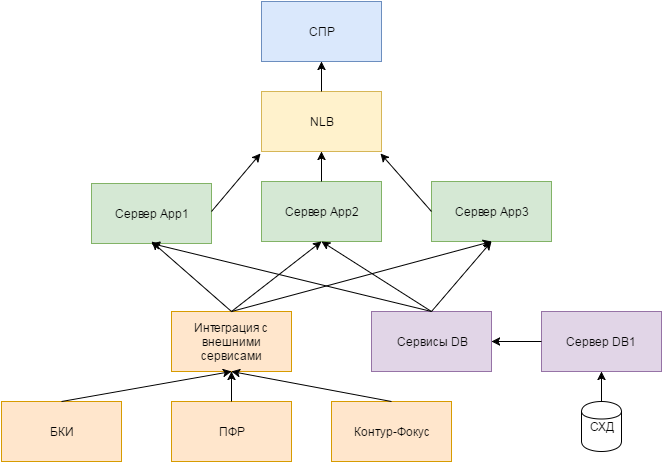
Decision Making System (DSS):
In our application, it will look like this (yes, the structure is somewhat disturbed, but the clarity remains):
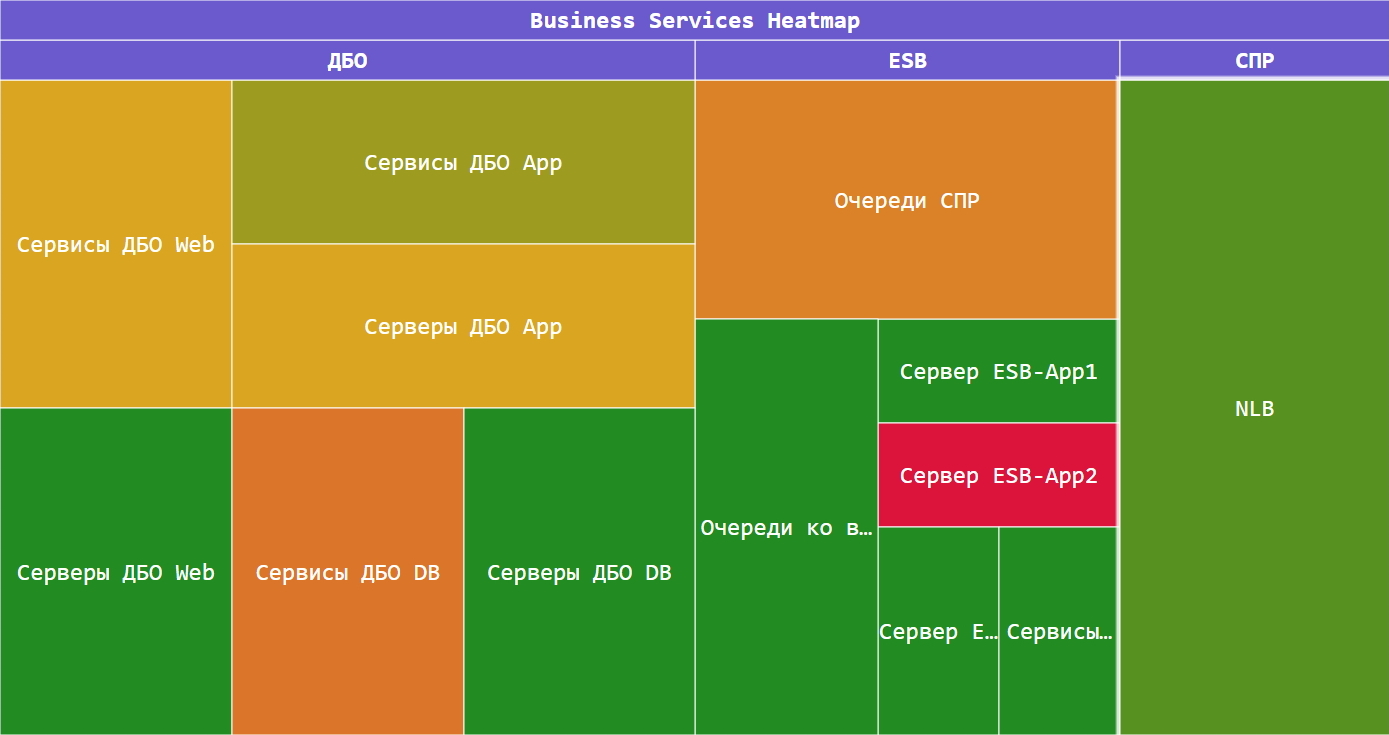
If necessary, you can go to the level below. And, last but not least, when you hover on an object, a pop-up window pops up with a description of the event and a link to the chart in Zabbix:

Thanks to this approach and a given degree of detail, the output we get a convenient dashboard, and at the same time a simple tool for localizing the problem. A few words about the functionality of our system:
- visualization of dependencies between corporate systems;
- setting the degree of influence of components on each other (weight of connection);
- integration with Zabbix (objects on the heat map are connected with triggers);
- pop-up windows with the text of the event when you hover on the object;
- visual interface for setting object links;
- visual interface for setting connection of objects with Zabbix triggers.
As an example, I will cite several already developed interfaces.
Adding objects to the heatmap:
Adding integration with Zabbix:
Connecting Zabbix triggers to objects on a heat map:
The system runs on Google Charts and Bootstrap . While this is an alpha version, we plan to develop it further, adding useful features from industrial systems with which we have been working successfully for many years. I will try to keep you informed and publish posts as a pile of new features accumulates.
The second development is integration with Zabbix and the thermal map of the functionality of synthetic transactions. In fact, this is a continuation of the heat map, but a look from the other side. Definitely, controlling the system only from the side of the application and infrastructure, you will not have the necessary information completeness. Synthetic transactions will allow to look at this business from the user and localize the problem even before the first user visits to the Help Desk.
Synthetic transactions are based on the phantom.js framework (but nothing prevents you from switching to casper.js, to pure selenium, or to something else to your taste). In our test lab, the test script execution is configured via cron and then the resulting data is transferred to Zabbix via zabbix_trapper. As an example of a test scenario, a login is taken to the MTS personal account and receiving the balance of the account and traffic in the Internet package. Below is a listing script. In banking, the most likely use of this tool may be, for example, RBS. Nobody bothers you to make a login to the system and transfer 1 ruble from one account to another.
Assembled items are as follows:
Each has its own schedule.
In no case do not want to say that the use of monitoring in Open Source solutions is a pill for all the trouble. I will reveal the secret of Pusinel: as in physics, there is the law of saving money and labor. The more money you pour into the finished product, the less labor costs for revision, and vice versa. You should always be guided by common sense, the available budget and the human factor: will your team be ready to rush to the embrasure of business monitoring at the first call?
Particularly interested in monitoring technologies, I suggest to get acquainted with our previous article on this topic, "Principles of monitoring business applications . "
Article author: Anton Kasimov
Let's imagine the following: you work in an organization (it can be yours), which has a business process supported by one or more IT systems. I know for sure that there is a monitoring system. Then the vision blurs a little, and it is not clear: is it an industrial system or a free Open Source. However, you have situations when all the sensors on it are green, but the business process itself gives inexplicable failures, showing a decrease in key indicators. As a stun gun outbreak at a unauthorized rally, the thought that the situation is out of control and you need to act immediately rises in your head. Only now it is not clear how. I tell you, this is a fairly common case, from the manifestations of which it is desirable to quickly get rid of. A systematic approach to solving this problem will provide a service model.
Tom Wudzek , who provides services for the visualization of processes occurring in companies (not only IT), conducted a curious study. He asked different people to draw a process of making toasts. Below are some results of this work.
 |  |  |
What do we see in many pictures? Right! Objects and connections present in any system. The more of them, the more systematic the approach will be. The correct degree of granularity will allow you to more accurately track the "health" of the business system. You can try to use Visio to build a scheme, but it is much more interesting to take a marker for drawing links, sticky note paper for objects and draw your system on a whiteboard. The greater the number of yellow leaves, the more connections, the higher the chance to determine the maximum number of monitoring points to accurately determine the source of the problem.
')
And now it's time to talk about our developments in the field of expanding the standard Zabbix functionality and applying the systematic approach described above. There are exactly two of them.
The first is mapping systems and creating a heat map of services. Considering our serious experience in monitoring banking business processes, we will give an example from this area. Consider the three most typical banking systems. If there are more typical systems in your bank, please excuse me - we will not consider them here.
Remote Banking System (RB):
Corporate data transmission bus (ESB):
Decision Making System (DSS):
In our application, it will look like this (yes, the structure is somewhat disturbed, but the clarity remains):
If necessary, you can go to the level below. And, last but not least, when you hover on an object, a pop-up window pops up with a description of the event and a link to the chart in Zabbix:
Thanks to this approach and a given degree of detail, the output we get a convenient dashboard, and at the same time a simple tool for localizing the problem. A few words about the functionality of our system:
- visualization of dependencies between corporate systems;
- setting the degree of influence of components on each other (weight of connection);
- integration with Zabbix (objects on the heat map are connected with triggers);
- pop-up windows with the text of the event when you hover on the object;
- visual interface for setting object links;
- visual interface for setting connection of objects with Zabbix triggers.
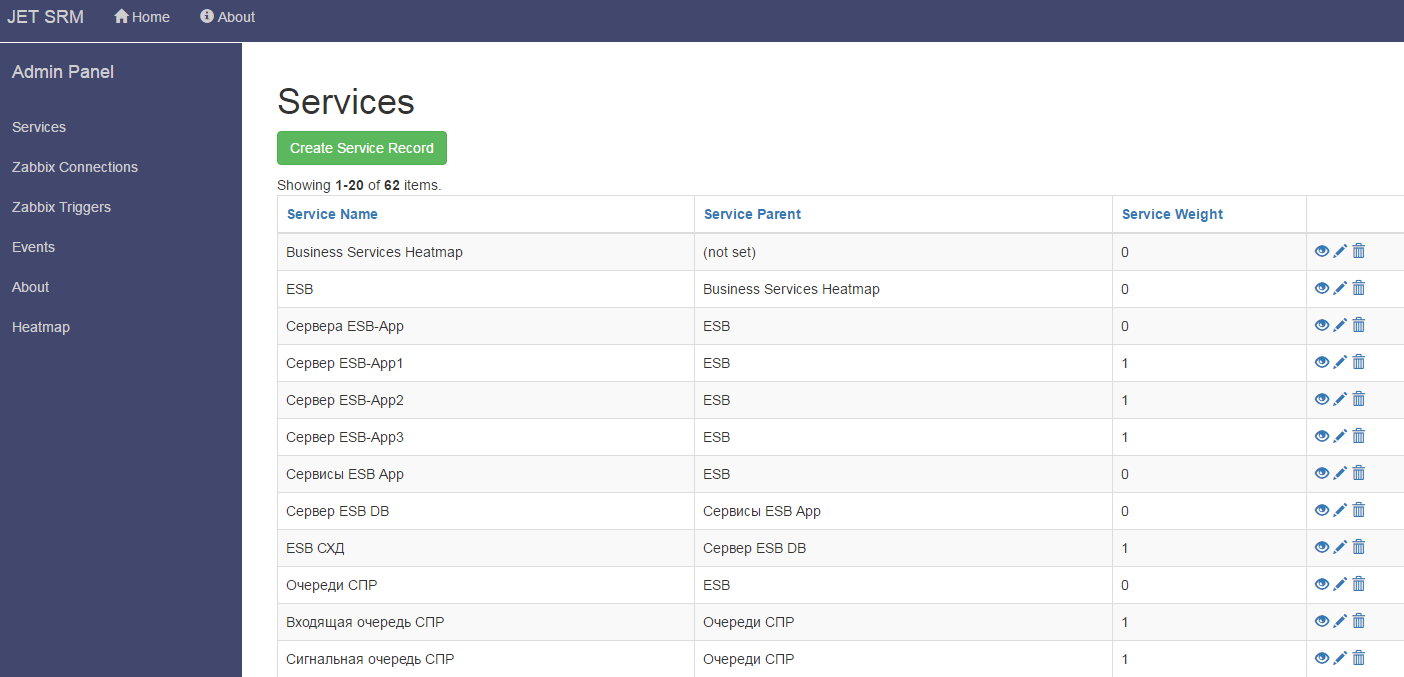
As an example, I will cite several already developed interfaces.
Adding objects to the heatmap:
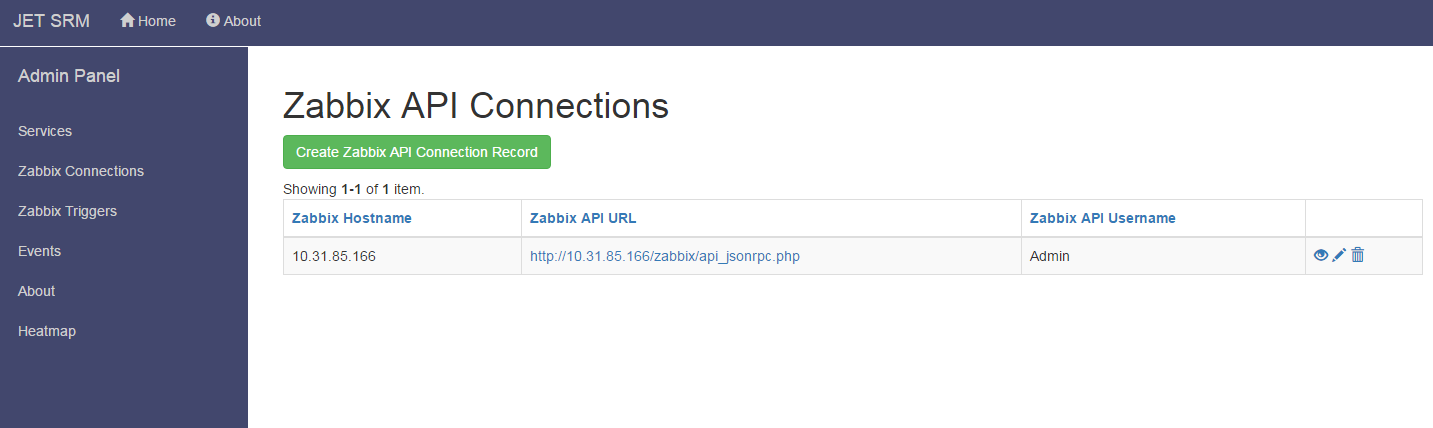
Adding integration with Zabbix:
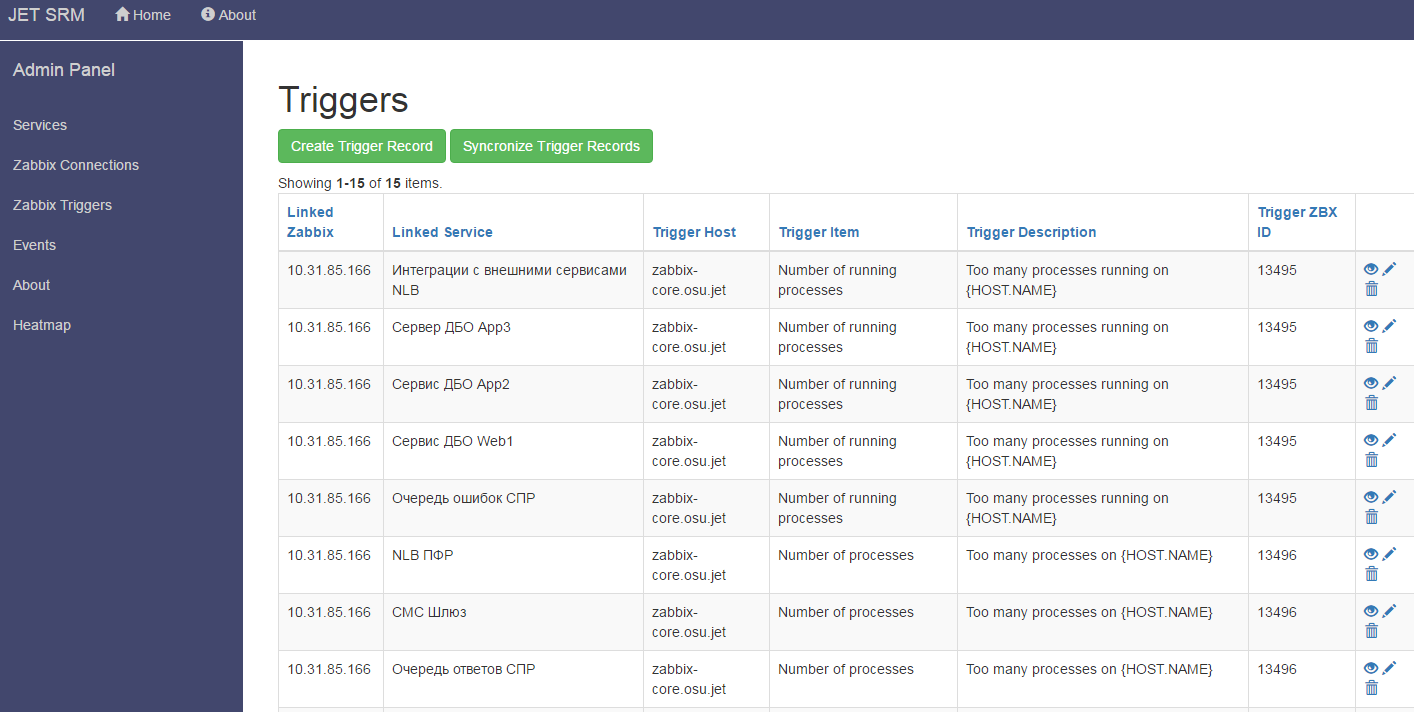
Connecting Zabbix triggers to objects on a heat map:
The system runs on Google Charts and Bootstrap . While this is an alpha version, we plan to develop it further, adding useful features from industrial systems with which we have been working successfully for many years. I will try to keep you informed and publish posts as a pile of new features accumulates.
The second development is integration with Zabbix and the thermal map of the functionality of synthetic transactions. In fact, this is a continuation of the heat map, but a look from the other side. Definitely, controlling the system only from the side of the application and infrastructure, you will not have the necessary information completeness. Synthetic transactions will allow to look at this business from the user and localize the problem even before the first user visits to the Help Desk.
Synthetic transactions are based on the phantom.js framework (but nothing prevents you from switching to casper.js, to pure selenium, or to something else to your taste). In our test lab, the test script execution is configured via cron and then the resulting data is transferred to Zabbix via zabbix_trapper. As an example of a test scenario, a login is taken to the MTS personal account and receiving the balance of the account and traffic in the Internet package. Below is a listing script. In banking, the most likely use of this tool may be, for example, RBS. Nobody bothers you to make a login to the system and transfer 1 ruble from one account to another.
Test script for checking balance and traffic balance (Javascript)
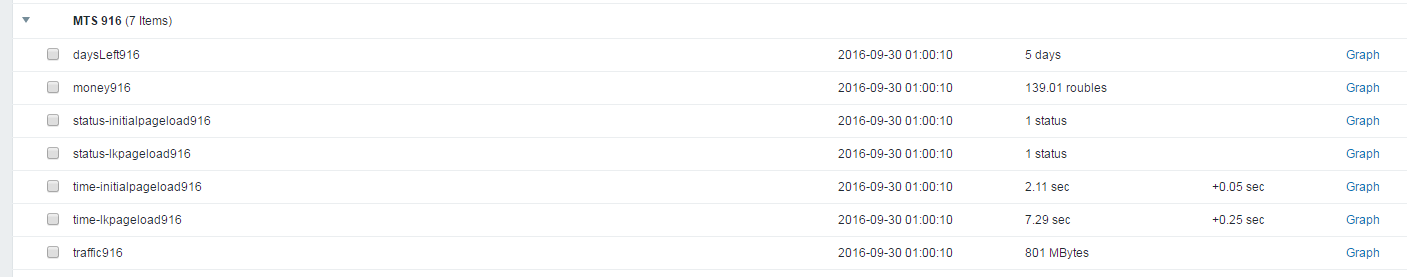
/** * * 1.0 * * : * phantomjs --web-security=no getMtsBalance.js "< >" " (XXX) XXX-XX-XX" "<>" * : * phantomjs --web-security=no getMtsBalance.js "/tmp/getMtsBalance" "(916) 123-45-67" "P@ssw0rd" * * (c) Jet/ 2016 */ // PhantomJs stuff var fs = require('fs'); var system = require('system'); var webpage = require('webpage'); var args = system.args; var TRAFFIC_REGEX = /.{1,100}?([0-9.]+).{0,50}?(|).{0,50}? (\d+) /i; var DATE_REGEX = / - ([0-9]{1,2})\.([0-9]{1,2})\.([0-9]{2}) ([0-2][0-9]):([0-5][0-9])/; var SCRIPT_TIMEOUT = 40000; var config = { lkUrl : 'https://lk.ssl.mts.ru/', lkLogin: null, lkPass : null, outDir : null, debugDir: null, formattedStartTime: null }; var timer = { lastActionStartTime: null, lastActionTimeMs : null, currentTimeMillis: function() { return Date.now(); }, startAction: function() { this.lastActionStartTime = this.currentTimeMillis(); this.lastActionTimeMs = null; }, stopAction: function() { lastActionTimeMs = this.currentTimeMillis() - this.lastActionStartTime; }, getLastActionTimeMs: function() { return lastActionTimeMs; }, getLastActionTimeSec: function() { return lastActionTimeMs === null ? null : lastActionTimeMs/1000; } } var metrics = { trafLeftMb: null, daysLeft : null, balance : null, pages: { login: { availability : null, responseTimeSec: null }, lk: { availability : null, responseTimeSec: null } } }; ////////// HELPER FUNCTIONS ////////// var func = { log: function(s) { console.log(this.formatDateTimeForLog(new Date()) + " " + s); }, roundToTwo: function(num) { return +(Math.round(num + "e+2") + "e-2"); }, zero: function(i) { return i < 10 ? '0' + i : i; }, formatDateTimeForLog: function(date) { var dd = date.getDate(); var mm = date.getMonth() + 1; var yy = date.getFullYear(); var hh = date.getHours(); var min = date.getMinutes(); var ss = date.getSeconds(); var ms = date.getMilliseconds(); ms = ('00' + ms).slice(-3); return yy + '-' + this.zero(mm) + '-' + this.zero(dd) + ' ' + this.zero(hh) + ':' + this.zero(min) + ':' + this.zero(ss) + '.' + ms; }, formatDateTimeForFileName: function(date) { return date.getFullYear() + this.zero(date.getMonth() + 1) + this.zero(date.getDate()) + '-' + this.zero(date.getHours()) + this.zero(date.getMinutes()) ; }, writeMetricToFileAndLog: function(filePrefix, metricName, metricValue) { if ( metricValue == null ) { metricValue = 0; } fs.write(config.outDir + filePrefix + config.formattedStartTime + '.log', this.roundToTwo(metricValue), 'w'); this.log(' ' + metricName + ' = ' + metricValue); } } // config.outDir = args[1] + '/'; config.lkLogin = args[2]; config.lkPass = args[3]; config.debugDir = config.outDir + 'debug/'; fs.makeDirectory(config.debugDir); func.log(" : " + config.outDir); // - setTimeout(function() { func.log(" " + SCRIPT_TIMEOUT + " "); if ( metrics.pages.login.availability == null ) { metrics.pages.login.availability = 0; metrics.pages.login.responseTimeSec = 0; } if ( metrics.pages.lk.availability == null ) { metrics.pages.lk.availability = 0; metrics.pages.lk.responseTimeSec = 0; } outMetricsAndExit(); }, SCRIPT_TIMEOUT); // "" var page = webpage.create(); page.settings.userAgent = 'Mozilla/4.0'; // config.formattedStartTime = func.formatDateTimeForFileName(new Date()); // func.log(" " + config.lkUrl); timer.startAction(); page.open(config.lkUrl, function (status) { timer.stopAction(); metrics.pages.login.responseTimeSec = timer.getLastActionTimeSec(); if (status !== "success" ) { func.log(" " + config.lkUrl + " "); metrics.pages.login.availability = 0; outMetricsAndExit(); } else { func.log(" " + config.lkUrl + " "); metrics.pages.login.availability = 1; page.render(config.debugDir + 'login.png'); // iframe', var contentN = 0; page.onLoadFinished = function(status) { // , // (iframe'), // , .. , // -. - // "", // . . // timer.stopAction(); contentN++; func.log(' N' + contentN + ':' + status); page.render(config.debugDir + contentN + '.png'); fs.write(config.debugDir + contentN + '.html', page.content, 'w'); if ( status === 'success') { getMtsMetrics(page, contentN); } }; func.log(" , : " + config.lkLogin); timer.startAction(); page.evaluate(function(config) { var form = document.forms[0]; form.phone.value = config.lkLogin; form.password.value = config.lkPass; form.elements[2].click(); }, config); } }); function getMtsMetrics(page, contentN) { if ( page.content.match(' ') ) { func.log(" : . "); metrics.pages.lk.availability = 0; metrics.pages.lk.responseTimeSec = 0; outMetricsAndExit(); } // iFrame' findBalanceInPage(page, contentN); // - findTrafficInfoInPage(page); // , if ( checkGotMetricsAlready() ) { outMetricsAndExit(); } } /** * */ function findBalanceInPage(page, contentN) { // iframe' if ( page.framesCount == 0 ) { return; } func.log(" iframe'"); var balanceResult = page.evaluate(function() { var result = { iframes: [], balance: null }; $("iframe").each(function(i, iframe) { var iframeBody = $(iframe).contents().find('body'); if ( iframeBody.size() > 0 ) { result.iframes.push( iframeBody.html() ); // 1 - DOM if ( result.balance === null ) { iframeBody.find(".b-header_balance").each(function() { var m = $(this).text().match(/([0-9.]+) /i); if ( m ) { result.balance = m[1]; } }); } // 2 - regex if ( result.balance === null ) { var m = iframeBody.text().match(/\s*:\s*-?([0-9.]+)\s*/i); if ( m ) { result.balance = m[1]; } } } }); return result; }); var iframesAnalyzed = balanceResult.iframes.length; func.log(" iframe':" + iframesAnalyzed); if ( iframesAnalyzed > 0 ) { // iFrame' for (var i = 0; i < iframesAnalyzed; i++) { var iframeContent = balanceResult.iframes[i]; func.log(" iframe " + config.debugDir + contentN + '_iframe' + i + '.html'); fs.write(config.debugDir + contentN + '_iframe' + i + '.html', iframeContent, 'w'); } // , if ( balanceResult.balance !== null ) { if ( metrics.pages.lk.availability === null ) { // , metrics.pages.lk.availability = 1; metrics.pages.lk.responseTimeSec = timer.getLastActionTimeSec(); } func.log(" : " + balanceResult.balance); metrics.balance = balanceResult.balance; } } } /** * - */ function findTrafficInfoInPage(page) { var traf = page.content.match(TRAFFIC_REGEX); if ( traf ) { func.log(" - : " + traf); metrics.trafLeftMb = traf[1]; var trafUnits = traf[2]; if ( trafUnits.toLowerCase() == '' ) { metrics.trafLeftMb *= 1024; } metrics.daysLeft = traf[3]; } else if (page.content.match(" ") ) { func.log(" : "); metrics.trafLeftMb = 0; if ( page.injectJs("jquery.min.js") ) { metrics.daysLeft = page.evaluate(function() { var p = $("p:contains('- ')"); var pText = p.find("b").text(); console.log( " : " + pText); return pText.replace(/\D/g, ''); }); } } } /** * , */ function checkGotMetricsAlready() { if ( metrics.pages.login.availability == 0 || metrics.pages.lk.availability == 0 ) { // ( ) // , return true; } if ( metrics.balance != null && metrics.daysLeft != null && metrics.trafLeftMb != null ) { // , return true; } return false; } /** * , * */ function outMetricsAndExit() { func.log(":"); func.writeMetricToFileAndLog('traffic', 'metrics.trafLeftMb', metrics.trafLeftMb); func.writeMetricToFileAndLog('money', 'metrics.balance', metrics.balance); func.writeMetricToFileAndLog('daysLeft', 'metrics.daysLeft', metrics.daysLeft); func.writeMetricToFileAndLog('status-initialpageload', 'metrics.pages.login.availability', metrics.pages.login.availability); func.writeMetricToFileAndLog('time-initialpageload', 'metrics.pages.login.responseTimeSec', metrics.pages.login.responseTimeSec); func.writeMetricToFileAndLog('status-lkpageload', 'metrics.pages.lk.availability', metrics.pages.lk.availability); func.writeMetricToFileAndLog('time-lkpageload', 'metrics.pages.lk.responseTimeSec', metrics.pages.lk.responseTimeSec); phantom.exit(); } Assembled items are as follows:
Each has its own schedule.
In no case do not want to say that the use of monitoring in Open Source solutions is a pill for all the trouble. I will reveal the secret of Pusinel: as in physics, there is the law of saving money and labor. The more money you pour into the finished product, the less labor costs for revision, and vice versa. You should always be guided by common sense, the available budget and the human factor: will your team be ready to rush to the embrasure of business monitoring at the first call?
Particularly interested in monitoring technologies, I suggest to get acquainted with our previous article on this topic, "Principles of monitoring business applications . "
Article author: Anton Kasimov
Source: https://habr.com/ru/post/311640/
All Articles