AI Cradle

There is one topic in modern Computer Vision, which often remains behind the scenes. There is no complicated mathematics and deep logic in it. But the fact that it does not illuminate in any way - drives many beginners into a stupor. And the topic is not simple: it has a lot of rakes, about which you do not know until you step.
The topic is called this: preparing a database of images for further study.
In the article:
')
- How can you distinguish a good base
- Examples of good bases
- Examples of programs that are convenient to mark the base
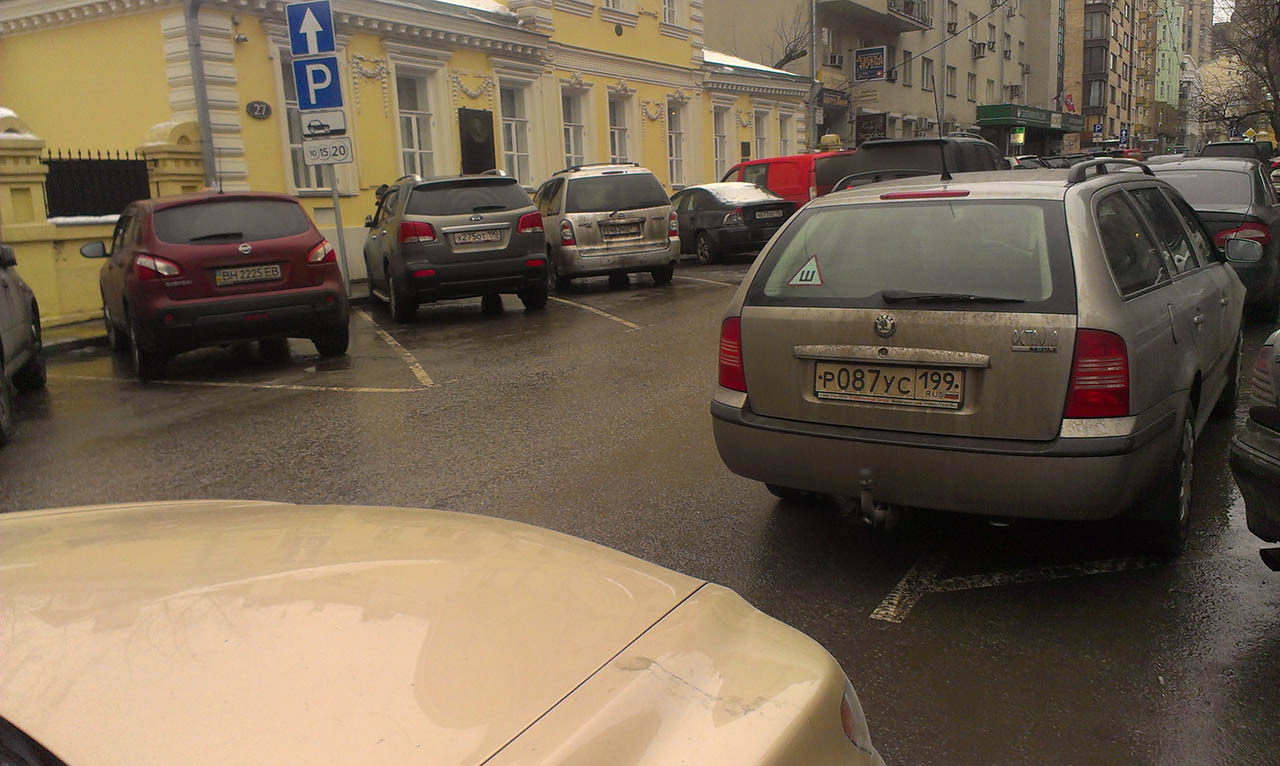
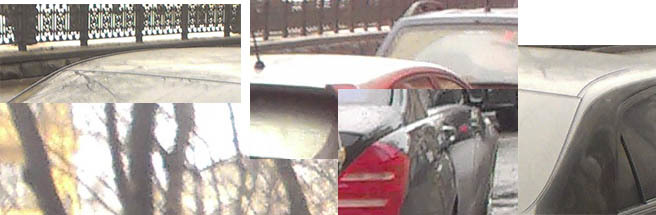
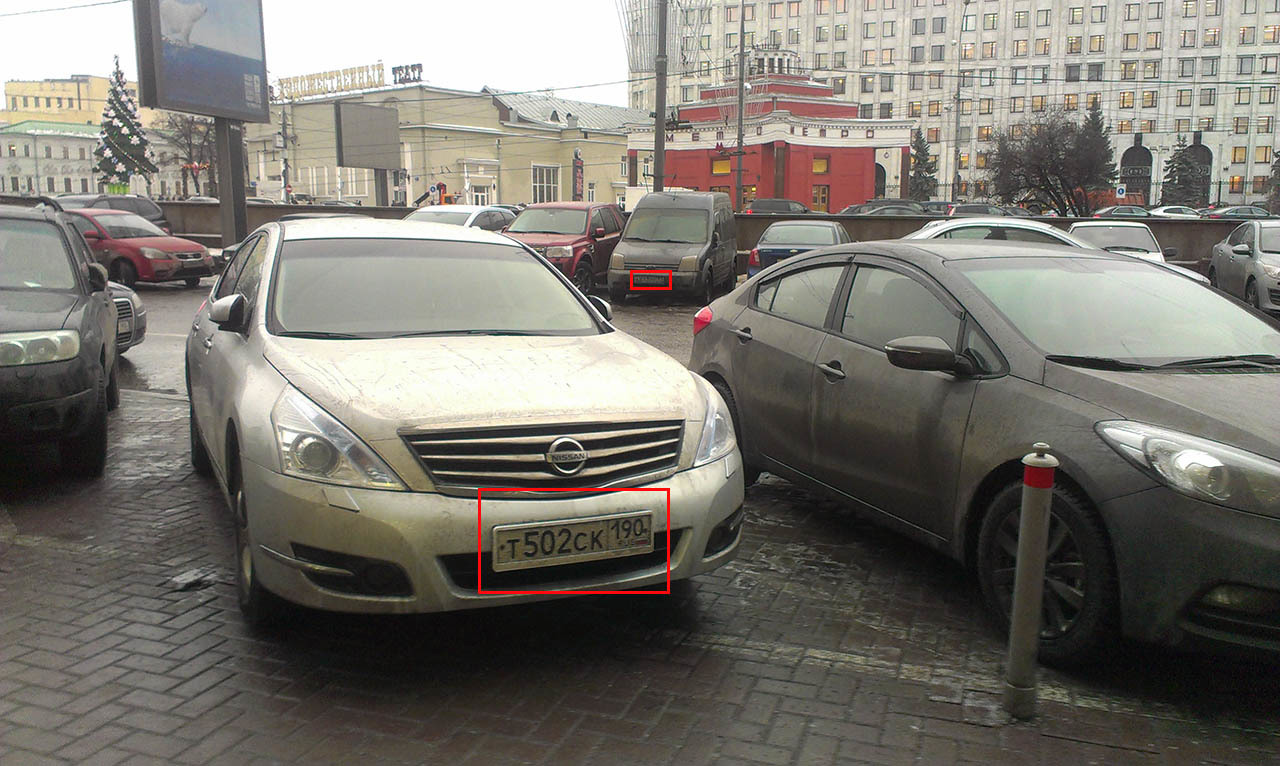
To begin, let me show the simplest and most beloved example: recognition of license plates. Suppose we make a system from scratch. What we should designate in this image:
The ideal option, in my opinion, is:
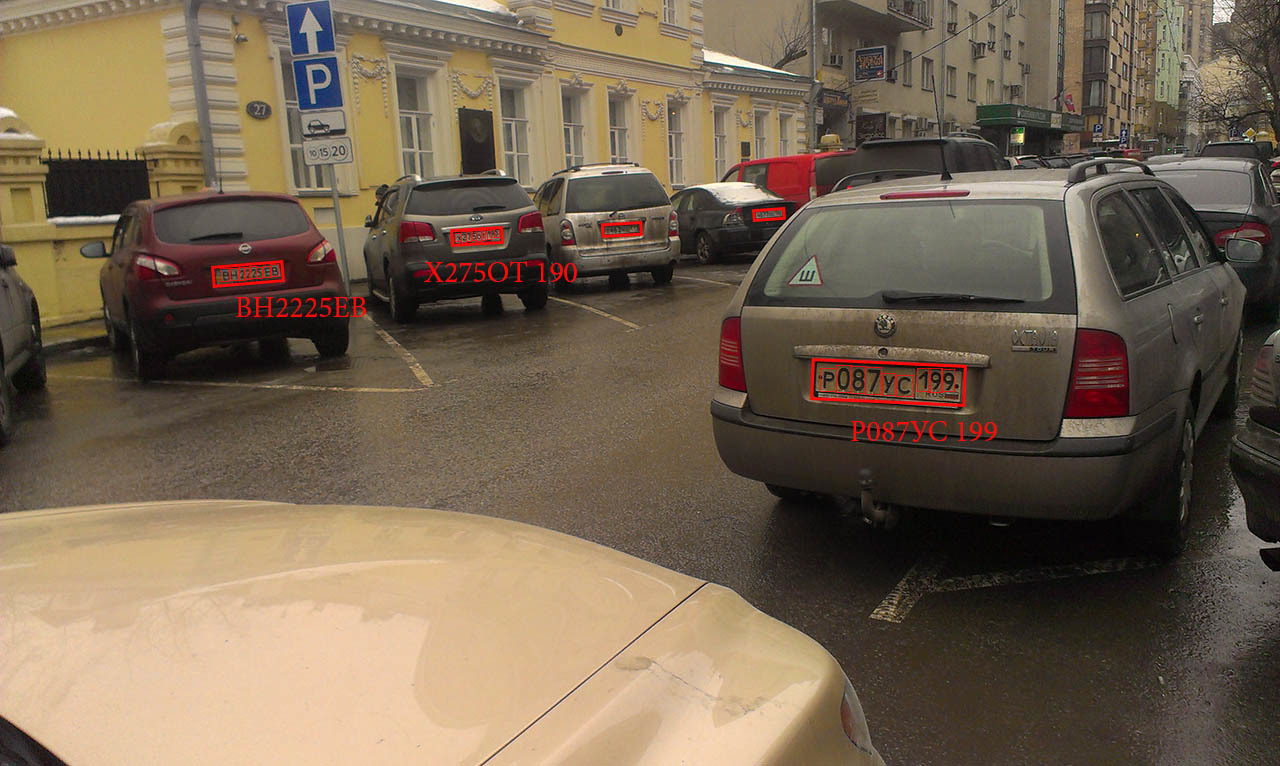
It is noted here:
- Frame for each number that is visible. The key point: you need to emphasize the angle of inclination of the room + its position.
- The value of each number that is visible. The system will not recognize better than the person who looks at the photo, so that the numbers that can hardly be seen can not be denoted.
- The position of each character number.
Once again: this is the perfect markup. It is possible that it is somewhat redundant, but on its basis almost any algorithm can be configured / trained. I myself have never done such detailed markup in any task that I solved. Usually there is an ideal balance between what you want and what you have strength for.
Now consider where it comes from. And why this is enough. The classic number allocation algorithm is as follows:
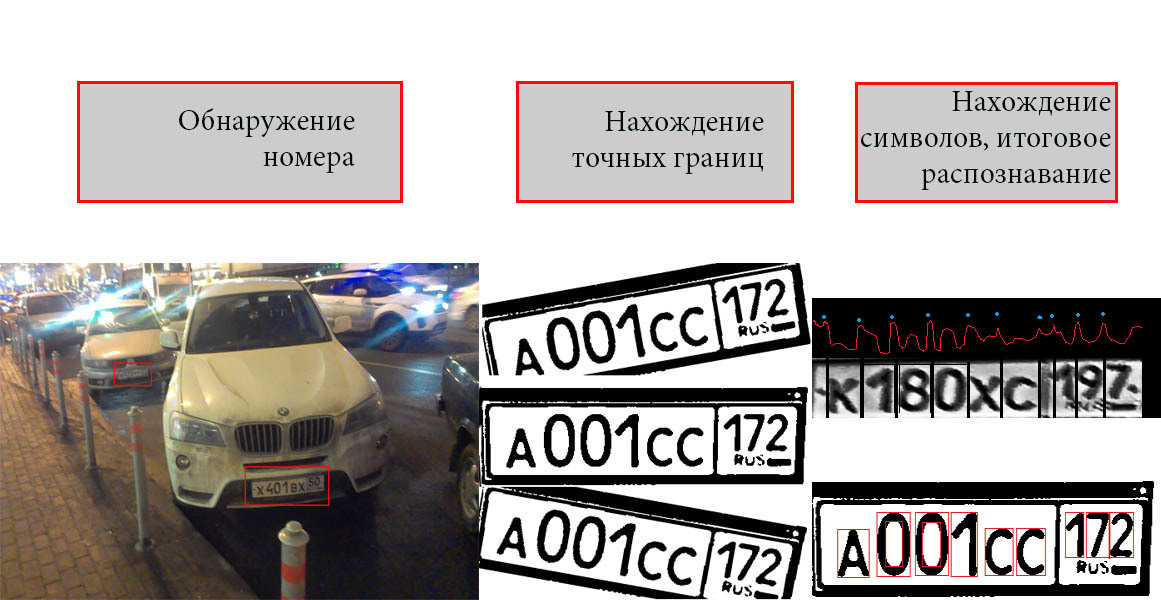
In this case, each part is usually responsible for its own algorithm or their group.
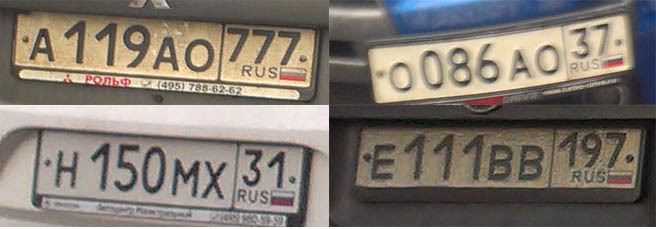
The first part - we need to find the numbers. Suppose we allocate a number through a Haar cascade, or through HOG descriptors. Then we will need to submit a set of positive and negative examples to the input of the learning algorithm:
Positive:
Negative:
If we implement the search for a number through some neural network, then the purpose of training the network will be such a set of rectangles:
As you can see, from the data that we have marked just get both options.
After the number is found it needs to be processed. Again, there are many approaches. But in general, the second part is “number normalization”. You can make an algorithm that searches for borders manually, as described here :
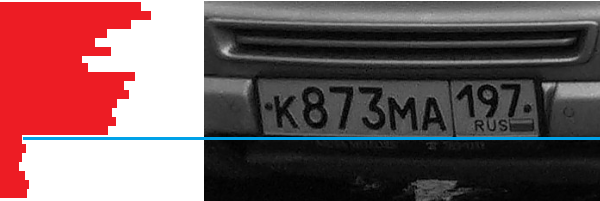
This algorithm does not require training, but according to the data that we have, we will be able to evaluate its quality of work.
And you can train several neural networks. For example, the first is looking for an angle, the second is looking for a cropping.
And again. The data that we have marked out is completely enough.
You can combine part one and part two and make a search network for numbers, which immediately displays both the angle and rotation of the number. For her, data is also enough.
Principles
Let's try to formulate the basic principles of markup:
1. Think in advance about all possible algorithms that can solve your problem. Define the input data for each of the options. If this does not require a large number of markup forces, think up a markup format that would provide you with any of the existing solutions to the problem with input data. If possible, it is better that the markup is redundant. Otherwise, if your algorithm does not work, you have to do it all over again.
2. Try to markup in a simple, verifiable format. Remember that any tasks of computer vision are quite difficult to debug and search for bugs. Any part should be simply visualized and easy to check with your eyes. Prefer text data formats or graphic. Try to avoid binary formats, or formats with large amounts of metadata. Try to write all the possible information. For example, do not forget the text name of the image. If you use some function “get a list of file names”, remember that in Windows, Linux, C #, Python, the order of these files may differ.
3. Remember that markup is a long process. Often, marking a large base can take days or weeks. Monotonous labor. Try to provide in your program everything you need.
Database examples
MSRA dataset . MSRA is a whole series of datasets. Take for example dataset with the detection of objects. For each picture, the bounding rectangle of the object in this picture is set:
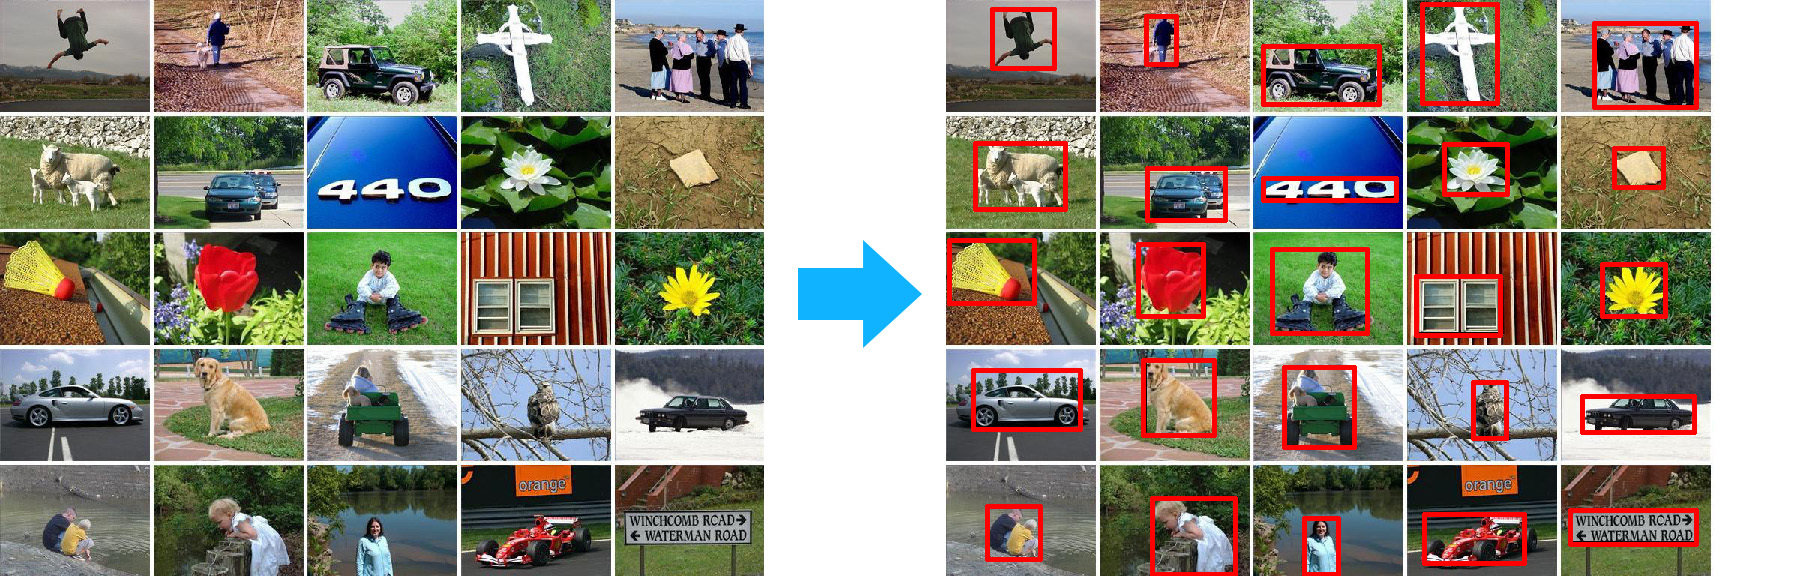
In this case, all parameters are in a text file of the following type:
235 - 0\0_101.jpg - 400 300 - 89 10 371 252; 87 9 379 279; 89 11 376 275; - 0\0_108.jpg 400 300 112 4 241 214; 119 0 241 208; 118 0 238 141; ..... In addition, each text file describes all the objects of one of the classes.
VOC2012 One of the most comprehensive datasets. It was done for research purposes => tried to describe everything well and efficiently. Until 2012, the dataset was updated every year (2005-2012). Description format: xml.
Rectangles of all objects are marked on each image:
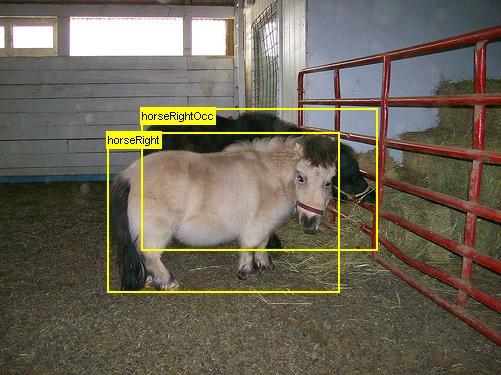
In this case, all data is written:
<annotation> <folder>VOC2007</folder> <filename>000019.jpg</filename> <source> <database>The VOC2007 Database</database> <annotation>PASCAL VOC2007</annotation> <image>flickr</image> <flickrid><owner> <flickrid>Rosenberg1 Simmo</flickrid> <name>?</name> </owner>330638158</flickrid> <source> <size> <width>500</width> <height>375</height> <depth>3</depth> </size> <segmented>0</segmented> <object> <name>cat</name> <pose>Right</pose> <truncated>0</truncated> <difficult>0</difficult> <bndbox> <xmin>231</xmin> <ymin>88</ymin> <xmax>483</xmax> <ymax>256</ymax> </bndbox> </object> <object> <name>cat</name> <pose>Right</pose> <truncated>0</truncated> <difficult>0</difficult> <bndbox> <xmin>11</xmin> <ymin>113</ymin> <xmax>266</xmax> <ymax>259</ymax> </bndbox> </object> </annotation> Also, some of the images in the VOC are colored by class membership. A segmentation task ( for example ) requires input images in which interesting areas would be marked. Usually the type of object is set in color:

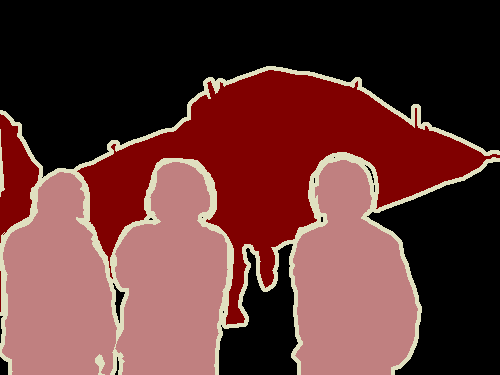
In this case, the markup is essentially a coloring.
CIFAR Research dataset with small images. An example of an inconvenient dataset. All pictures are in one big file. There are descriptions of them. To access the file there are wrappers for Python and for Matlab. The picture description is the class number. There is nothing more in dataset. Dataset was once popular. But it was unfortunate in the design format. Now it is rarely used.
The Street View House Numbers (SVHN) Dataset Famous dataset with house numbers from Google.
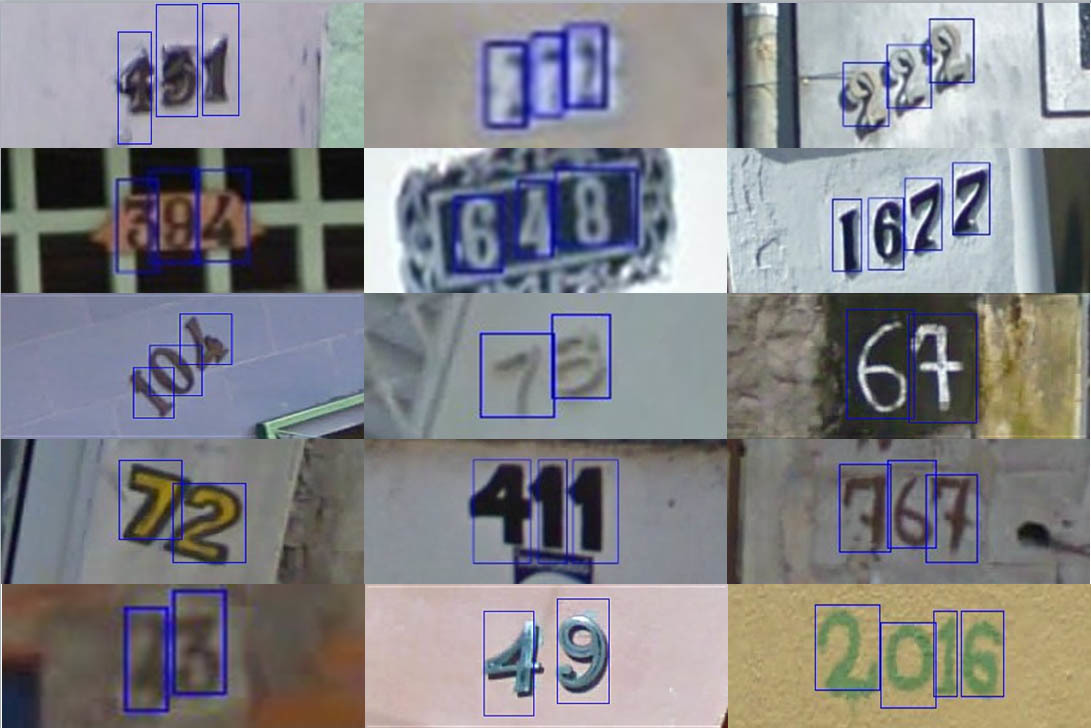
Description format - binary matlabovsky file for each image. In the file there is a rectangle bounding the digit and the value of the digit.
MS COCO Dataset from Microsoft. Probably one of the best to date. In composition - approximately as VOC, but more data, much more information on markup.
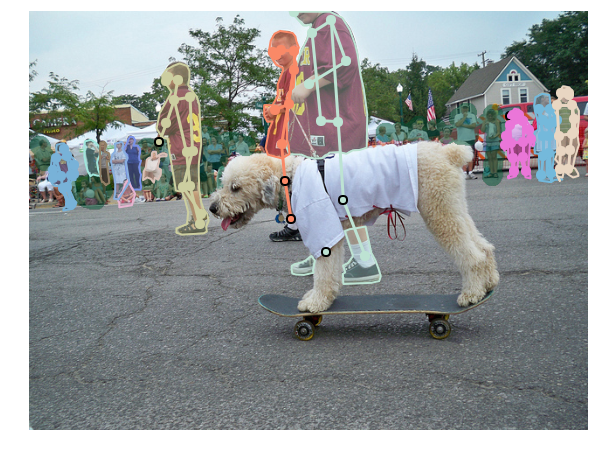
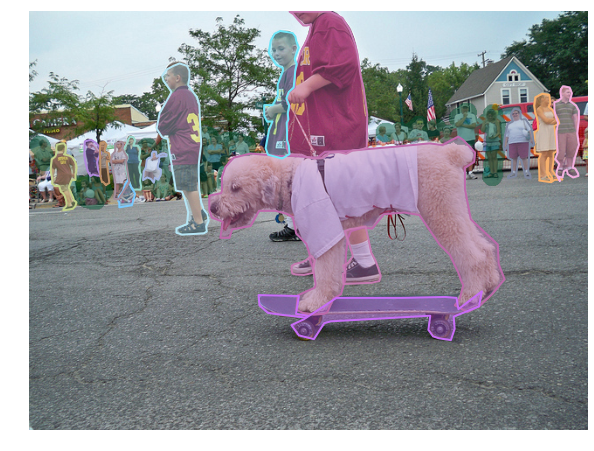
Information is stored in the accompanying json-files . Here is an example of how it is annotated:
annotation{ "id" : int, "image_id" : int, "category_id" : int, "segmentation" : RLE or [polygon], "area" : float, "bbox" : [x,y,width,height], "iscrowd" : 0 or 1, } categories[{ "id" : int, "name" : str, "supercategory" : str, }] One of the interesting moments dataset. Segmentation areas are set not by the image, which floods them, but by the closed polyline, which is stored in the same json-file. This greatly reduces the amount of data. Although it degrades the quality of the markup.
The second point - for each of the pictures there is a text description of what is happening.
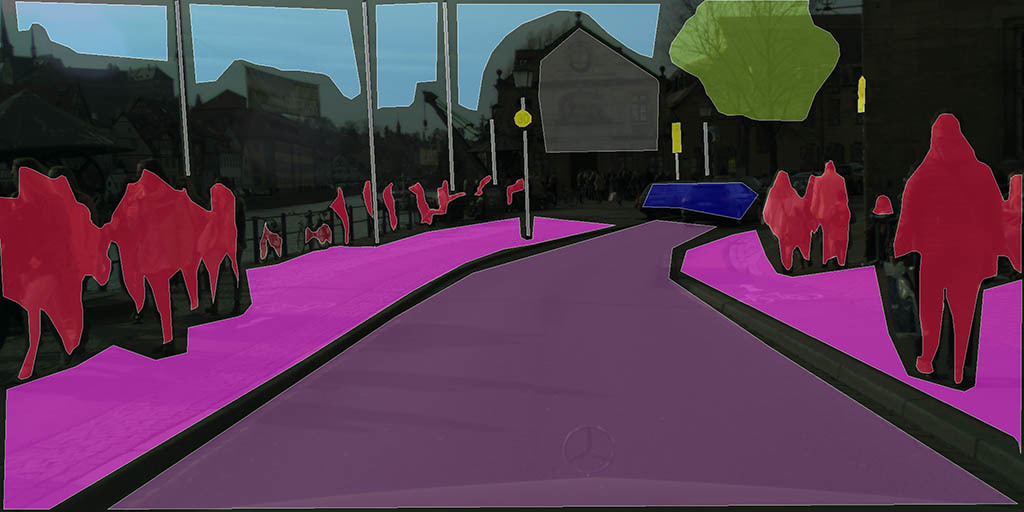
The Citycapes Dataset A set of datasets for a purely segmentation task: mark up everything that happens on the streets. For each picture the second picture with markup. In a separate file, the description of what each color means.
kaggle On kaggle many dataset and they are always different for different puzzles. This is an example of how to do datasets. All datasets are as simple as possible. Are there 10 classes? Here they are on daddy without unnecessary tekstovikov. Need to discover something? Here is the segmentation markup.
IMAGENET A huge, but without a dataset. To be honest, I could not finally understand all the descriptions available to him. Most of the descriptions are in mat-files. The recognition task requires the classification of the displayed data. So the creators decided to give a complete classification for each image:
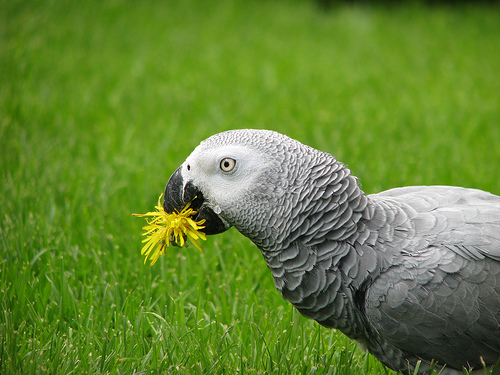
animals → chordate → vertrbrate, craniate → bird → parrot → African gray. - image description format.
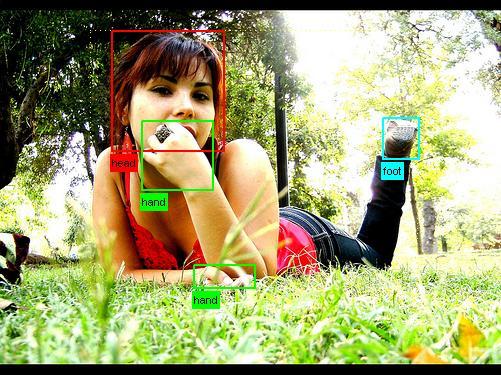
A set of datasets on the points of the face . Description formats vary, but in most cases, textual coordinates are given for all points on the face:
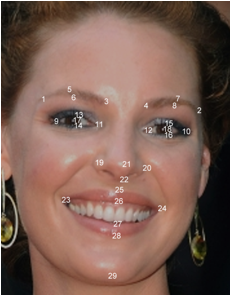
http://www.absolutely.net/wenn/handy_manny_05_wenn5360250.jpg worker_2 205.056122449 274.885204082 0 409.147959184 276.691326531 0 287.535714286 291.441326531 0 336.903061224 295.956632653 0 249.306122449 268.864795918 0 249.005102041 281.507653061 0 371.821428571 274.283163265 0 373.928571429 282.410714286 0 227.734693878 307.787755102 0 388.840816327 304.416326531 0 273.489795918 309.473469388 0 340.195918367 309.714285714 0 250.371428571 298.636734694 0 252.779591837 314.771428571 0 362.168 296.06 0 365.72244898 312.844897959 0 252.297959184 305.13877551 0 363.073469388 301.526530612 0 275.655102041 378.605612245 0 352.23877551 377.945408163 0 327.151020408 376.625 0 315.92755102 393.790306122 0 244.620408163 413.645918367 0 359.391836735 417.219387755 0 311.255102041 419.11122449 0 310.204081633 424.996938776 0 308.102040816 438.239795918 0 311.044897959 453.794897959 0 118.526530612 259.768877551 0 446.133 275.046 0 145.594897959 364.081122449 0 438.369 380.507 0 142.954081633 321.828061224 0 435.781 330.688 0 317.351020408 518.537755102 0 A set of biometric dataset from CASIA . It's all pretty simple. Datasets for biometrics algorithms. For each person, there is a separate daddy, inside of which everything is laid out like a note: different spectra, many approaches.
KITTI A set of various data taken from a car. Each picture has its own textual description:
Pedestrian 0.00 1 1.43 694.62 175.43 703.96 201.82 1.74 0.75 0.64 5.98 1.92 48.22 1.55 Van 0.00 1 2.15 68.34 174.12 189.52 222.12 1.94 1.88 5.30 -21.22 2.03 32.10 1.57 Misc 0.00 1 2.06 184.58 181.15 230.79 211.99 1.54 0.85 2.84 -20.97 1.97 37.62 1.56 Car 0.00 0 2.01 221.83 183.54 302.47 223.76 1.48 1.61 3.39 -13.87 1.93 28.89 1.56 Car 0.00 1 2.07 168.24 186.13 265.38 223.54 1.44 1.79 4.32 -16.76 2.04 30.95 1.58 Description is an example of a good dataset. Here everything is set: as far as the object is covered, the object's borders. How much the object is turned to the camera, what are the real coordinates of the object in depth. But, as I understand it, most researchers use only the coordinates of the frame of the object.
In addition to images with a marking of rectangles in dataset there is a lot of interesting information. There is a stereo pair for road conditions.
There is an optical stream for each frame, which at each point sets the color encoding the direction and speed of movement ( 1 ), ( 2 ):
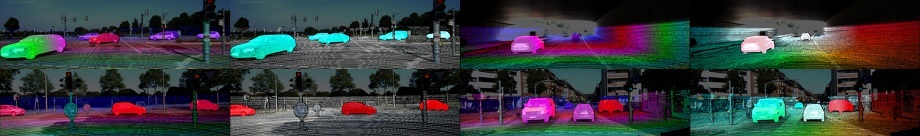
In this dataset a lot of interesting and correctly specified information.
There is a huge variety of datasets that I did not mention here. The main thing that unites them: if it is serious, it is well done. It is convenient to work with him. When you make datasets for your tasks - do not forget about it.
Operator convenience
Even if you do not mark up the base - do not forget about the convenience of the operator who will mark. Convenience of the operator = speed of work + quality markup. Here are some tips:
• Try to duplicate all possible keyboard operations. Leave on the mouse only the operation of selecting objects in the image. This increases the speed of work at times.
• Save your work constantly. Do not keep it in the memory of the program. Since markup programs are often written on the knee, departures are possible. It's a shame to lose 5000 tagged images.
• Make it possible to edit tagged data. Errors can not be avoided.
• Do not give the operator extra tools. Everything should be easy, all corners should be cut. Do you have 3 types of objects? No need to give the operator a program where you can mark 10 types. Your motto is “only necessity and sufficiency”.
A couple of examples
I give here some examples that I used in different tasks. Written in C # + with an EmguCV connection for working with images (I know what is redundant, but it was easier that way).
There are 2 programs in the repository - one for coloring images for segmentation tasks, the second for drawing rectangles. Nothing extraordinary, but maybe someone will need it.
Other
I liked the Yandex service - Toloka . In part, he can solve base marking issues. But, it must be said that not much of what is described in it is there.
A bit lower in the comments, vfdev-5 says that this application is also a good choice for markup.
Source: https://habr.com/ru/post/311558/
All Articles