Artificial Intelligence in Excel predicts the gold medal winner in the men's tournament at Rio 2016
Every time we use complex mathematical algorithms and modern methods of machine learning, we set ourselves the task of obtaining a trend, understanding internal dependencies, and ultimately producing predictions. More accurate results can be obtained if the algorithm can be adapted to the available knowledge, to the existing process model. One of the directions in machine learning, which allows you to create and train models to obtain predictions, is "generating (or Bayesian) modeling" ( as opposed to "discriminative" modeling , for example, neural networks ). To create probabilistic models and work with them there are platforms that recently belong to the direction of "probabilistic programming". In more detail about probabilistic programming, you can read in other articles on Habrahabr: "Probabilistic programming" , "Probabilistic programming - the key to artificial intelligence?" And "Probabilistic programming . "
More recently, a startup Invrea appeared, which suggests using Excel as a probabilistic programming language: a probabilistic model can be created in Excel and predictions can be obtained there as well. Below is the translation of one of the articles from the startup site (the translation is made solely for educational purposes). In the article, the authors consider an example of a “everyday” situation. They are interested in understanding who will win the tennis tournament at the 2016 Olympics. They make predictions about who is the most likely candidate to win. The article was written on August 7, during the games, after the completion of all the games of the first round.
***
')
“In our opinion, it is very important to make machine learning easy to use and accessible to everyone. It is necessary to eliminate as much as possible the need to adjust the existing question or task to the necessary framework for possible calculations. The authors present the Invrea Scripts plugin (for Excel), which can be used to make decisions about current and regular events. To demonstrate this, the authors reproduced the course of the tournament in the men's single-player tournament in an Excel spreadsheet. Using the plugin, the probabilities of victory were determined for each of the players in the Association of Tennis Professionals (ATP), based on their rating in this organization.
A video demonstration (in English) of using Excel plug-in to predict the winner of the men's tennis tournament in Rio 2016:
Predictions about the winner of the gold medal after the first round. Calculated using the Invrea plugin:
In the men's single tournament, 64 people participate, each of whom faces face to face one on one with another player. The winner goes to the next round, the loser leaves the competition. This continues to the final, where the winner is awarded a gold medal. The question is who will most likely get the gold? It would be nice to get the probability of winning each player in the tournament. Tennis has a large share of uncertainty. The fact that Murray has a rating higher than that of Nishikori does not guarantee that Murray will go further. As in any sporting event, disappointments and surprises can occur at any time.
Fortunately, machine learning was created to find an opportunity to cope with this problem. With its use, we can take into account a certain amount of randomness when deciding whether Murray or Nishikori will win. Murray has a slightly higher probability according to the rating, but there is a fair chance that Nishikori will win.
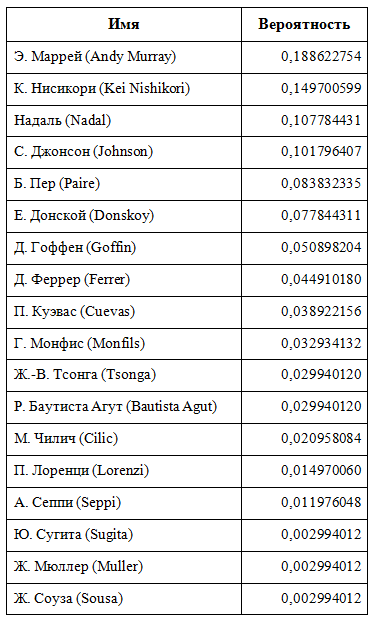
The following is an Excel spreadsheet that the authors created to determine the chances for each player to win in Rio. The file has two sheets: the first contains a list of all players, its rating and the logarithm of this rating. A random variable was added to each of the ratings, because the number of points is not always critical in the player’s description (see Figure 1). For example, Del Potro has only 140 points in the ATP rating, but this is mainly due to the small playing period. His recent results lead us to believe that he is a better player than his rating indicates. Accident helps to account for these minor inconsistencies.
Auxiliary spreadsheet with a priori "forces" of each of the players, based on the rating of the Association of Tennis Professionals:

Fig. one.
The second sheet contains the standings. Column C reflects the first round that you can find on any page describing this tournament. But you can also see that all further state of the tournament, including the winner, is also filled (see fig. 2). How did it happen? If you update the spreadsheet (by pressing F9), you may notice that all players in the second round and after it will change. In other words, cells that reflect who will go to the next round contain values calculated on the basis of probability.
The basic spreadsheet to simulate the results of matches:
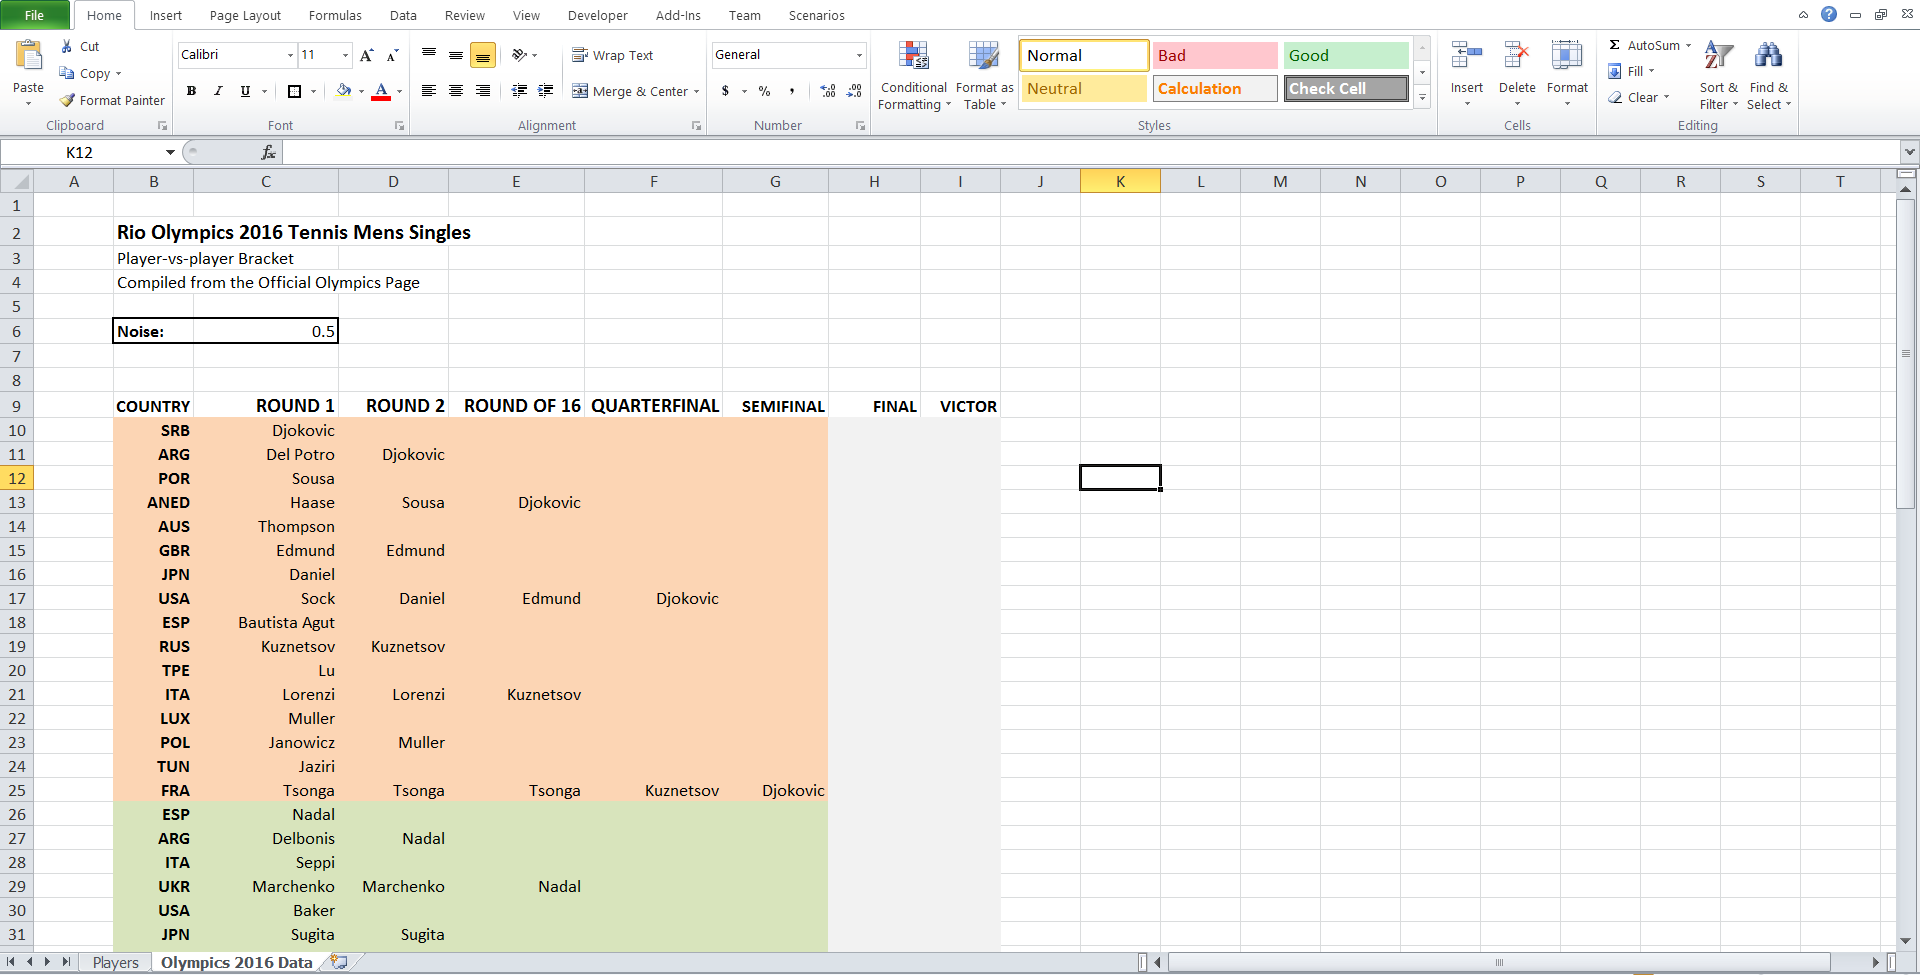
Fig. 2
But their random nature is based on the rule: Imagine that you choose a random variable close to player A rating and choose another random variable close to player B. Sometimes these values will be lower than the real rating ... sometimes higher. In this case, the rule: the one with the higher random variable wins. Thus, having a higher ATP rating means that you have a higher chance of defeating your opponent, but you may have a bad day / you may suffer from injury and conditionally acquire a low random value. From here, things are repeated. The third round displays the same equality for players who passed in the second round. And so on. That is why if you update the spreadsheet many times, different people will be declared the winners of the tournament.
What Invrea's “Scripts” allow you to do is define these random cells using functions such as GAUSSIAN, and this plugin allows you to generate thousands of scripts automatically and display them. You can see what the distribution in each random cell is: who wins in the first round? In the second round? In the semifinals? In the final? You can look at probabilities in any cell that interests you.
The histogram that you see below (see Fig. 3) is a posteriori probabilities calculated for the victory of each player, not knowing what happened at the end of the first round. The higher the bar, the more likely the victory of the corresponding player. Just by glancing at her, we see that Djokovic has a pretty good chance. The only ones who can potentially stop him are Murray, Nadal and Nishikori (Federer does not participate in the competition). Thanks to this information, you may be more reason to say about your expectations for the victory of Djokovic.
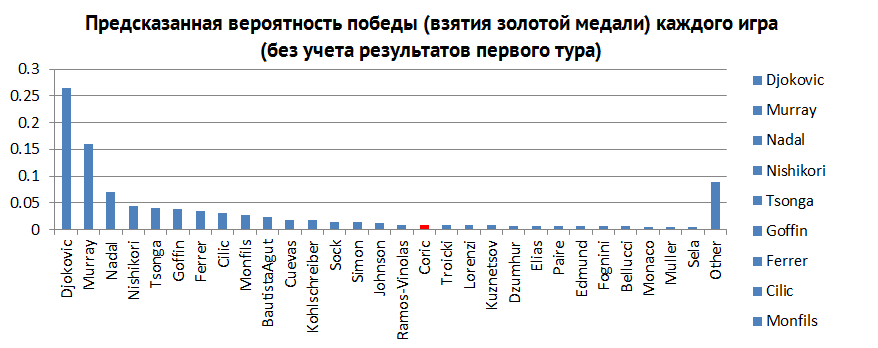
Fig. 3
In fact, you can do more interesting. Once the results are obtained at the end of the round, you can take this into account in the table using ACTUAL (Invrea special function). With this in mind, we can see the scenarios, who will win in the final, focusing on the results already obtained from previous rounds. For example, the authors used the results of all matches after the first round.
Among them were several unforeseen situations, including the fact that Djokovic lost to Del Potro (see Figure 4).
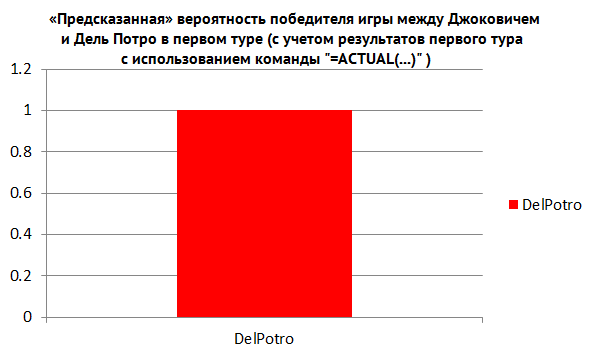
Fig. four.
After the launch of the plug-in, taking into account the new data, you can see (see Fig. 5) the change in the probability distribution of who wins the final: now there are fewer players, and the probability of Djokovic winning is now zero, while the results of Murray, Nadal and Nishikori have increased after the first round.
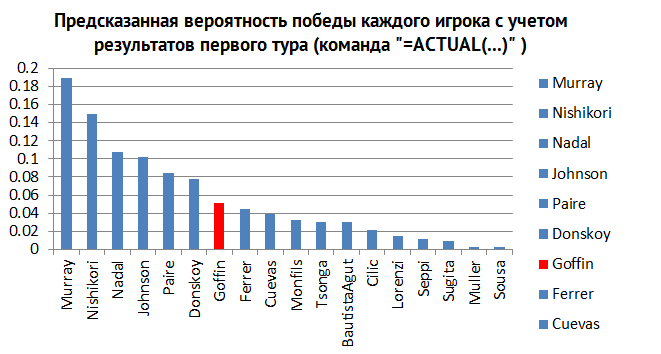
Fig. five.
In fact, the distribution of each random cell has changed, because the information on the results of the first round helped the plugin to better calculate who would be the most likely winner. Drawing conclusions on these results, we can assume the winner in the person of Murray or Nishikori. You can continue further in the course of the tournament by adding information about current events. As soon as the results of the second round appear, you can add them using ACTUALS, and the predictions will be even better.
Also, there is a large amount of information that can be predicted during the tournament. Who is the most likely winner in the 4th quarter-finals (Fig. 6)? The second semi-final (pic. 7)? Looking at the histograms above, we can get answers to each of these questions.
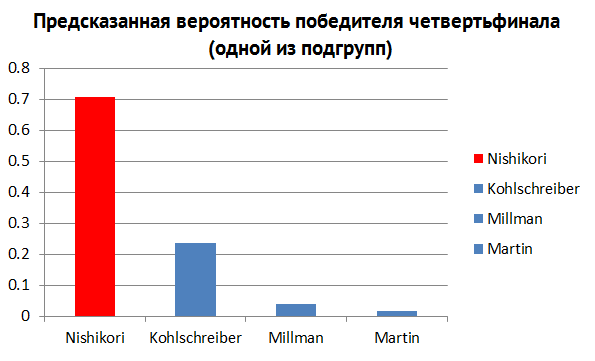
Fig. 6
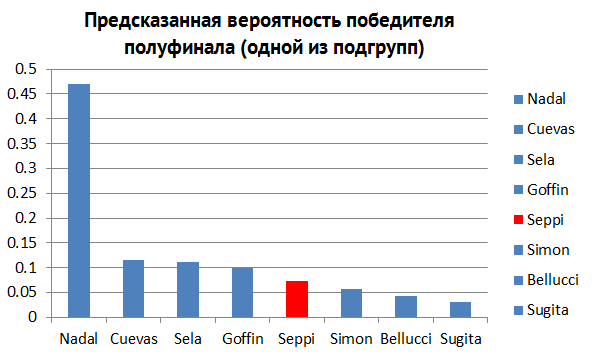
Fig. 7
Invrea's “scripts” help with obtaining predictions of this kind, but that's not all. The plugin can simulate uncertainty and predict something based on assumptions, new information and new data for business decisions, insurance, payment schedules. If it is possible to model your solution as a relationship between cells in an Excel spreadsheet, then there is enough probability that Invrea can help. Further, we will continue the cycle of articles related to the prediction of certain events, using situations and tasks from other spheres of our life. ”
***
As we mentioned earlier, the article was written on August 7, after only the first round of the men's tournament ended. As we already know, the winner at Rio 2016 was Andy Murray, whose victory was predicted in the article with the highest probability (see fig. 5 in translation).
If you are interested in this direction and liked the translation, there are plans for translations of other articles related to machine learning in general and with probabilistic programming in particular. There are also ideas to talk about modern machine learning applications in educational and commercial projects.
More recently, a startup Invrea appeared, which suggests using Excel as a probabilistic programming language: a probabilistic model can be created in Excel and predictions can be obtained there as well. Below is the translation of one of the articles from the startup site (the translation is made solely for educational purposes). In the article, the authors consider an example of a “everyday” situation. They are interested in understanding who will win the tennis tournament at the 2016 Olympics. They make predictions about who is the most likely candidate to win. The article was written on August 7, during the games, after the completion of all the games of the first round.
***
')
Task Description
“In our opinion, it is very important to make machine learning easy to use and accessible to everyone. It is necessary to eliminate as much as possible the need to adjust the existing question or task to the necessary framework for possible calculations. The authors present the Invrea Scripts plugin (for Excel), which can be used to make decisions about current and regular events. To demonstrate this, the authors reproduced the course of the tournament in the men's single-player tournament in an Excel spreadsheet. Using the plugin, the probabilities of victory were determined for each of the players in the Association of Tennis Professionals (ATP), based on their rating in this organization.
A video demonstration (in English) of using Excel plug-in to predict the winner of the men's tennis tournament in Rio 2016:
Predictions about the winner of the gold medal after the first round. Calculated using the Invrea plugin:
In the men's single tournament, 64 people participate, each of whom faces face to face one on one with another player. The winner goes to the next round, the loser leaves the competition. This continues to the final, where the winner is awarded a gold medal. The question is who will most likely get the gold? It would be nice to get the probability of winning each player in the tournament. Tennis has a large share of uncertainty. The fact that Murray has a rating higher than that of Nishikori does not guarantee that Murray will go further. As in any sporting event, disappointments and surprises can occur at any time.
Fortunately, machine learning was created to find an opportunity to cope with this problem. With its use, we can take into account a certain amount of randomness when deciding whether Murray or Nishikori will win. Murray has a slightly higher probability according to the rating, but there is a fair chance that Nishikori will win.
Presenting a probabilistic model in a spreadsheet
The following is an Excel spreadsheet that the authors created to determine the chances for each player to win in Rio. The file has two sheets: the first contains a list of all players, its rating and the logarithm of this rating. A random variable was added to each of the ratings, because the number of points is not always critical in the player’s description (see Figure 1). For example, Del Potro has only 140 points in the ATP rating, but this is mainly due to the small playing period. His recent results lead us to believe that he is a better player than his rating indicates. Accident helps to account for these minor inconsistencies.
Auxiliary spreadsheet with a priori "forces" of each of the players, based on the rating of the Association of Tennis Professionals:
Fig. one.
The second sheet contains the standings. Column C reflects the first round that you can find on any page describing this tournament. But you can also see that all further state of the tournament, including the winner, is also filled (see fig. 2). How did it happen? If you update the spreadsheet (by pressing F9), you may notice that all players in the second round and after it will change. In other words, cells that reflect who will go to the next round contain values calculated on the basis of probability.
The basic spreadsheet to simulate the results of matches:
Fig. 2
But their random nature is based on the rule: Imagine that you choose a random variable close to player A rating and choose another random variable close to player B. Sometimes these values will be lower than the real rating ... sometimes higher. In this case, the rule: the one with the higher random variable wins. Thus, having a higher ATP rating means that you have a higher chance of defeating your opponent, but you may have a bad day / you may suffer from injury and conditionally acquire a low random value. From here, things are repeated. The third round displays the same equality for players who passed in the second round. And so on. That is why if you update the spreadsheet many times, different people will be declared the winners of the tournament.
What Invrea's “Scripts” allow you to do is define these random cells using functions such as GAUSSIAN, and this plugin allows you to generate thousands of scripts automatically and display them. You can see what the distribution in each random cell is: who wins in the first round? In the second round? In the semifinals? In the final? You can look at probabilities in any cell that interests you.
Generate and produce a posteriori distribution
The histogram that you see below (see Fig. 3) is a posteriori probabilities calculated for the victory of each player, not knowing what happened at the end of the first round. The higher the bar, the more likely the victory of the corresponding player. Just by glancing at her, we see that Djokovic has a pretty good chance. The only ones who can potentially stop him are Murray, Nadal and Nishikori (Federer does not participate in the competition). Thanks to this information, you may be more reason to say about your expectations for the victory of Djokovic.
Fig. 3
In fact, you can do more interesting. Once the results are obtained at the end of the round, you can take this into account in the table using ACTUAL (Invrea special function). With this in mind, we can see the scenarios, who will win in the final, focusing on the results already obtained from previous rounds. For example, the authors used the results of all matches after the first round.
Among them were several unforeseen situations, including the fact that Djokovic lost to Del Potro (see Figure 4).
Fig. four.
After the launch of the plug-in, taking into account the new data, you can see (see Fig. 5) the change in the probability distribution of who wins the final: now there are fewer players, and the probability of Djokovic winning is now zero, while the results of Murray, Nadal and Nishikori have increased after the first round.
Fig. five.
In fact, the distribution of each random cell has changed, because the information on the results of the first round helped the plugin to better calculate who would be the most likely winner. Drawing conclusions on these results, we can assume the winner in the person of Murray or Nishikori. You can continue further in the course of the tournament by adding information about current events. As soon as the results of the second round appear, you can add them using ACTUALS, and the predictions will be even better.
Also, there is a large amount of information that can be predicted during the tournament. Who is the most likely winner in the 4th quarter-finals (Fig. 6)? The second semi-final (pic. 7)? Looking at the histograms above, we can get answers to each of these questions.
Fig. 6
Fig. 7
Invrea's “scripts” help with obtaining predictions of this kind, but that's not all. The plugin can simulate uncertainty and predict something based on assumptions, new information and new data for business decisions, insurance, payment schedules. If it is possible to model your solution as a relationship between cells in an Excel spreadsheet, then there is enough probability that Invrea can help. Further, we will continue the cycle of articles related to the prediction of certain events, using situations and tasks from other spheres of our life. ”
***
Afterword
As we mentioned earlier, the article was written on August 7, after only the first round of the men's tournament ended. As we already know, the winner at Rio 2016 was Andy Murray, whose victory was predicted in the article with the highest probability (see fig. 5 in translation).
If you are interested in this direction and liked the translation, there are plans for translations of other articles related to machine learning in general and with probabilistic programming in particular. There are also ideas to talk about modern machine learning applications in educational and commercial projects.
Source: https://habr.com/ru/post/311328/
All Articles