Battle of droids and jedi on cellular automaton
Films where huge armies converge with each other on the battlefield in an epic battle usually cause a storm of emotions in people. Scenes of Star Wars battles with masterful lightsaber Jedi and hordes of battle droids are no exception.
But sometimes it is interesting to look at the process of the battle as if from a bird's eye view and see the whole course of events. For this you can use various virtual simulation tools. This post provides an example of simulating a battle between Federation battle droids and the Jedi Order using such a simple discrete model as a cellular automaton.

Cellular Automata
Imagine that the whole world is a grid divided into squares, called cells . Each of these cells can be in different states of a given set. The state of the cell is affected by the state of the neighboring cells, which are usually determined through the Mur neighborhood of about 1 . A vivid example of such a model is the game "Life" , invented by the mathematician John Conway in the 1970s. Its rules are very simple:
- Each cell can be either "alive" or "dead."
- The dead cell, next to which there are exactly 3 living ones, becomes alive on the next turn.
- If there are 2 or 3 living cells next to a living cell, then it continues to live on the next turn.
- If there are fewer than 2 or more than 3 living cells next to a living cell, then it dies.

It is because of the simplicity of the description of the rules of such models, we will use the cellular automaton to simulate an epic battle.
We invent our automatic
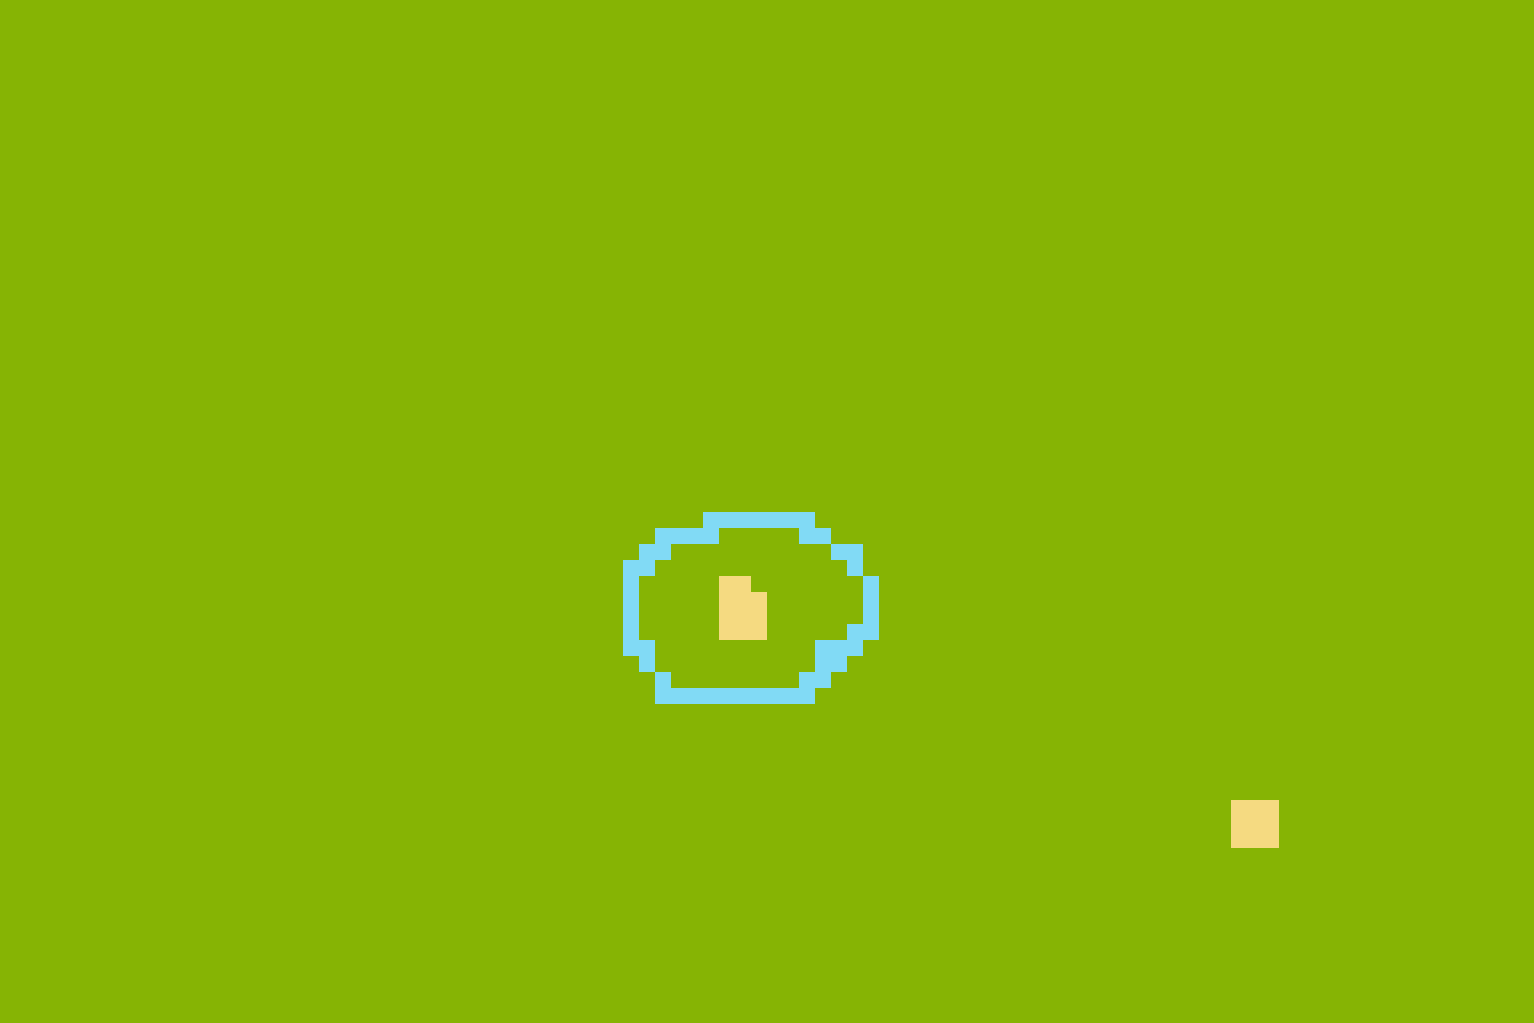
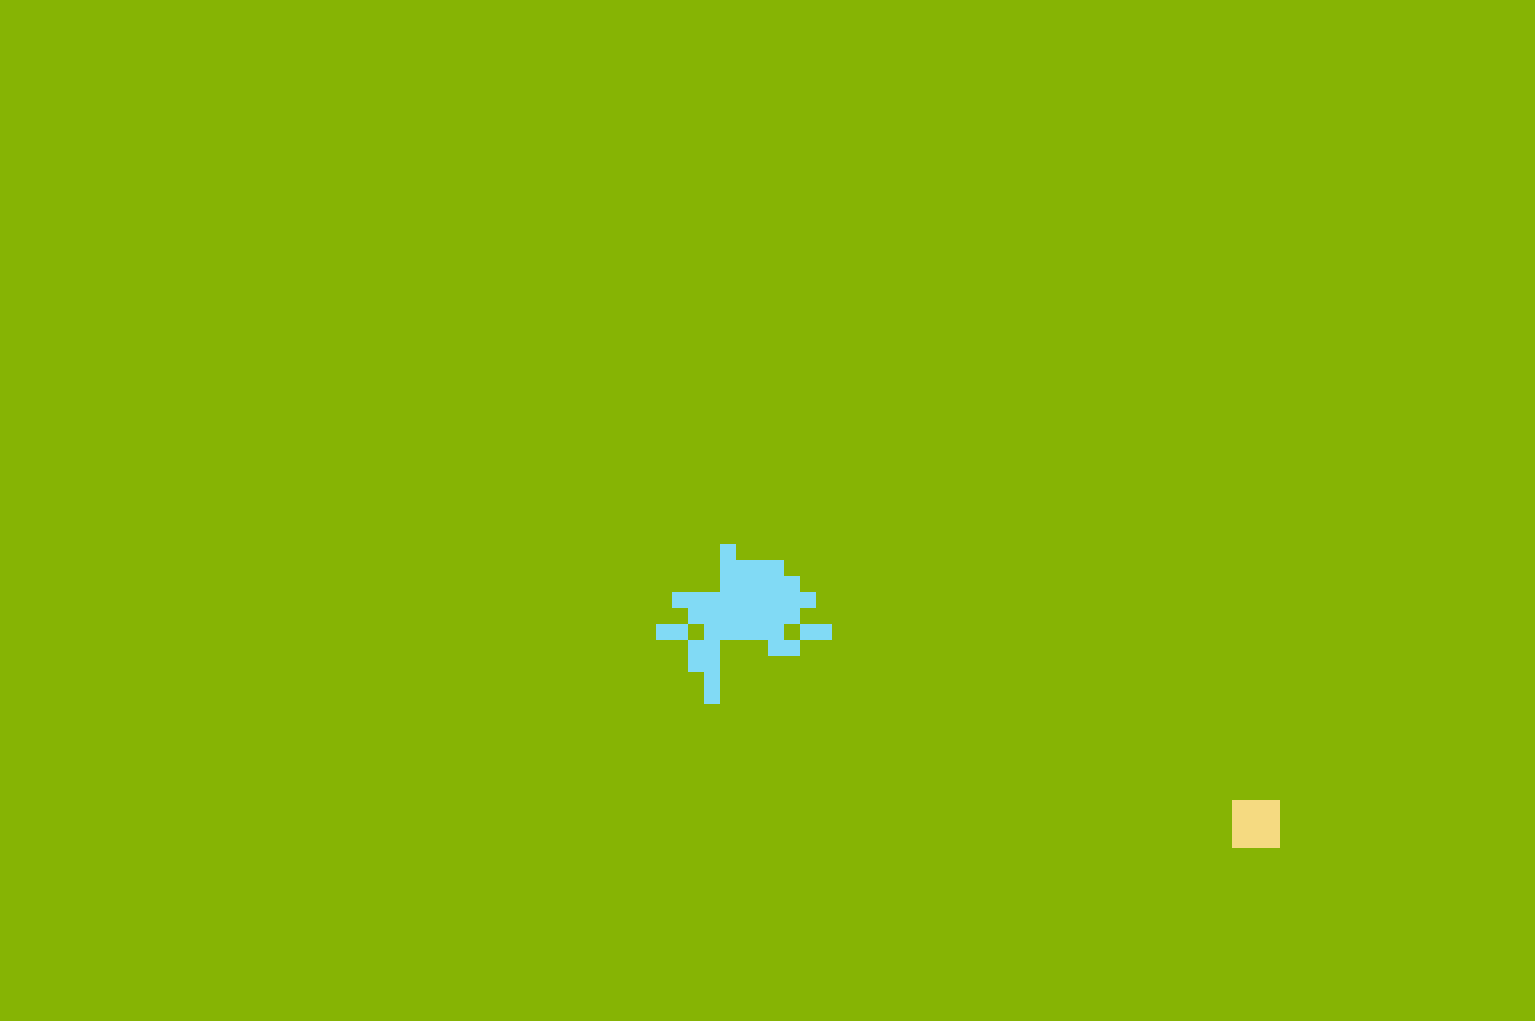
In total, there will be 4 cell types in our cellular automaton - a field (green), a droid (beige), a Jedi (blue), a blaster (red). Now we come up with the rules. We need the drones to bunch up and shoot the blasters to the Jedi, and the Jedi, in turn, attack these thick heaps of droids. For ease of modeling, we will add a new opportunity for the cells - to move. In fact, the movement of a cell in a cellular automaton can be defined as the transition of one of the cells to a state of transition, and the transition itself can be transferred to the zero state (in our case this field).
What you need to implement to create a battle simulator:
- Droids get off in groups
- The droid shoots the nearest Jedi in range.
- Jedi attacks the nearest squad
Finding Droid Groups
If the droids are represented as vertices of the graph, and the neighboring droids are connected vertices, then the droid groups are the connected components of such a graph. We can easily get them at the end of each step with the help of depth search (DFS):
components = [] var colors = new Array(field.grid.length) colors.fill(0) // 0 is white, 1 is gray, 2 is black for (var i = 0; i < field.grid.length; i++) if (field.grid[i].color == 1) if (colors[i] == 0) { var center = dfs(colors, i) components.push({ x: Math.round(center.x / center.k), y: Math.round(center.y / center.k) }) droidsAmount += center.k } The function of determining the connected component itself is recursive:
function dfs(colors, v) { colors[v] = 1 var x = field.grid[v].x, y = field.grid[v].y, k = 1 for (var i = 0; i < field.grid[v].n.length; i++) if (field.grid[field.grid[v].n[i]].color == 1 && colors[field.grid[v].n[i]] == 0) { var newPos = dfs(colors, field.grid[v].n[i]) x += newPos.x y += newPos.y k += newPos.k } colors[v] = 2 return { x: x, y: y, k: k } } The k property corresponds to the number of droids in the group and is required to calculate the center of the group (arithmetic average of the x- and y-coordinates of each droid). Each droid refers to its neighbors, whose coordinates are transferred to the first recursion call, which, in turn, will return the sums of all droid coordinates, as well as their number.
Going to a goal
All participants in the battle have goals — the cells they aim at: the Jedi are in the center of the nearest droid group, the droids are on their allies, and the projectile is in a cell with the coordinates of the Jedi at the time the shot was fired.
function moveToTarget(n, me, priority, ban) { var newX = me.x, newY = me.y var deltaX = me.tx - me.sx, deltaY = me.ty - me.sy var scope = deltaY / deltaX if ((deltaX == 0) || (deltaY == 0)) { newX = me.x + (deltaX == 0 ? 0 : deltaX / Math.abs(deltaX)) newY = me.y + (deltaY == 0 ? 0 : deltaY / Math.abs(deltaY)) } else { if (Math.abs(scope) >= 1) { newY = me.y + deltaY / Math.abs(deltaY) newX = me.sx + Math.round((newY - me.sy) / (scope)) } else { newX = me.x + deltaX / Math.abs(deltaX) newY = me.sy + Math.round((newX - me.sx) * (scope)) } } if (!set(n, { x: newX, y: newY }).length) { me.color = 0 return false } var newCell = set(n, { x: newX, y: newY })[0] for (var key in ban) if (newCell[key] == ban[key]) return false return { x: newX, y: newY, instead: { color: 0 }, priority: priority } } Consider how this works. The distance between the target and the initial position of the object along the X axis is denoted by deltaX, along the Y axis - by deltaY. It is clear that if the initial x-coordinate of the object is more important than the coordinate of the target, then deltaX will be negative. The same goes for deltaY.
Denote the ratio of deltaY to deltaX as scope (slope). If the slope is greater than one, then at each step the object is shifted by one along the Y axis, and sometimes along the X axis. Then newY = me.y + deltaY / Math.abs (deltaY), where the division by the absolute value allows to get one with the correct familiar Since movement can be defined as
x = y / scope, then newX = me.sx + Math.round ((newY - me.sy) / (scope)). We do the same for cases with scope <1.
There are cases when the object and the target are in the same column or the same row. Then division by zero may occur. For such cases, a check is made (deltaX == 0) || (deltaY == 0). If this is true, then we simply check the difference of coordinates using the ternary operator, and, if its value is nonzero, we add one with the correct sign.
The ban parameter contains properties that are not allowed for the cell to which the object passes. For example, a droid should not run into other robots. Therefore, for the droid, ban = {color: 1} (1 is the droid color index). If the cell to which the object wants to go, will have at least one property that has an equal value with the ban property of the same name, there will be no movement.
If the object tries to get on a non-existent cell (move beyond the field boundary), then it disappears from the map.
But if everything went well, then the function will return newX and newY as new coordinates.
Droid algorithm
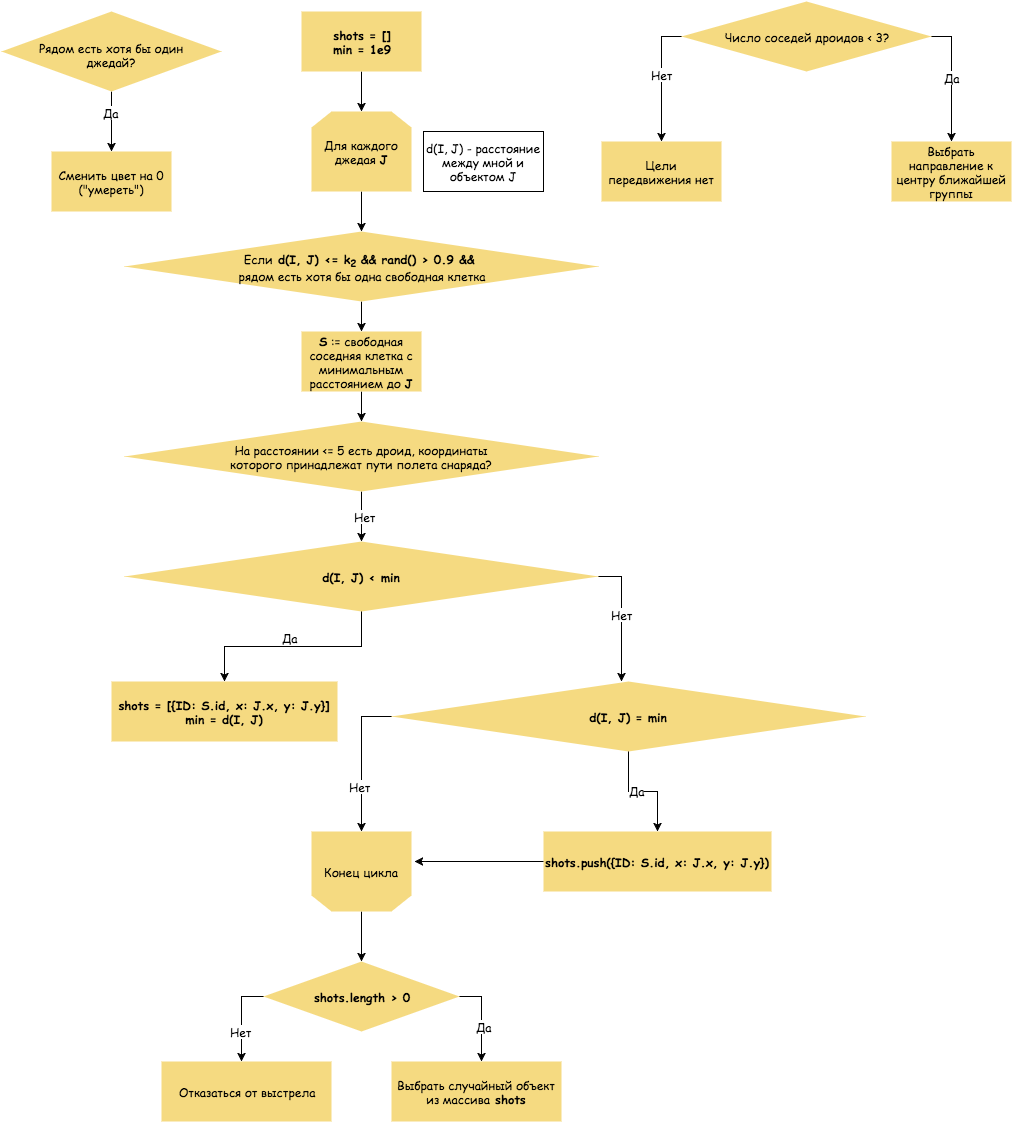
The droid makes shots in the direction of the nearest Jedi. The radius of visibility of the droid is given by the coefficient k2. The droid chooses the nearest Jedi, a shot in which would not hurt the droids that are within a radius of length 5.
The k2 coefficient is the detection distance of a Jedi droid.
Jedi Algorithm
To calculate the optimal direction of the Jedi strike, let us set a weight in accordance with each surrounding cell, which will be calculated as follows:
Jedi surrounds 8 cells (in case the Jedi is in the corner or near the field boundary - 3 or 5 cells). The weight is calculated separately for each of these cells and depends on the states of the remaining cells around the Jedi. We represent the weight as a polynomial of the form 5 a1 + 4 b1 + 4 b2 + 3 c1 + 3 c2 + 2 d1 + 2 d2 + 1 e, where each variable is equal to one if the corresponding cell is occupied by the droid, otherwise it is zero. The farther the cell is from being processed, the smaller the coefficient with its corresponding monomial.
An example of the cell weight calculation can be seen in the figure:

Cell weight in a specific situation:
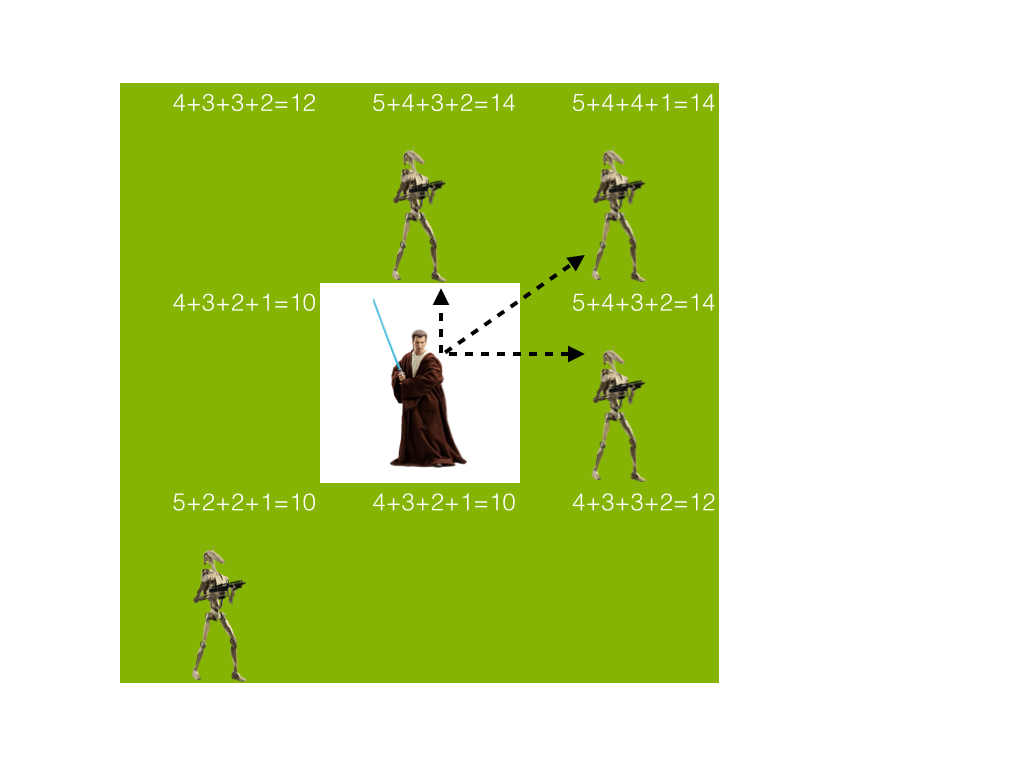
In this case, the Jedi has three optimal options for movement. One of them will be selected randomly.
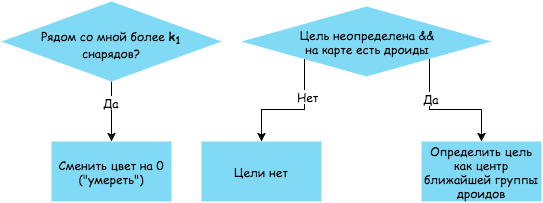
It remains to help the Jedi to detect clusters of droids. If we represent droids as graph vertices that are connected in the case of droid neighbors, then after each step, we will be able to find all the connected components of this graph using depth search (DFS), write the coordinates of their centers and the number of droids in the component into the array. In the next step, the Jedi are looking for the troops that are closest to him and immediately rush towards them.
The coefficient k1 is the maximum number of shells that a Jedi can dodge. By default, k1 = 4.
Flight projectile
Infinitely projectile can not fly, so that after 32 steps, it disappears:
function processBullet(n, me) { me.age++ if (me.age > 32) me.color = 0 } Movement of it is extremely simple - the usual call to the function direction to the goal:
function moveBullet(n, me) { return moveToTarget(n, me, 1, {}) } Unpleasant chips
What can we say - the program, formally performing a strictly specified algorithm, can sometimes surprise us with strange results.
The most noticeable is the "effect of the dead Jedi." Jedi are dead and heap.
Why? The answer is simple: one of the Jedi has reached the goal and is trying to get out of the crowd, but the other Jedi prevent him from doing so. They, in turn, try to squeeze in to the goal, but since she is busy and the Jedi who are there cannot leave it, this situation arises.
Simulate the battle
You can play with the simulation right in the browser . Select the cell type and start drawing it around the screen until you get the desired location. Click on "Start" and enjoy the battle. If the battle is over or just bored you, you can start at "Stop", after which the graphs will be generated. The first will show the number of droids at certain points in time, the second - the same statistics for the Jedi.
"You can play with the simulation on here
To create charts used library Chart.js . What can graphics say?
- The number of droids until a certain point remained the same. At that step, when the number of droids began to decline, the first encounter between the Jedi and the droids occurred.
- The most frequent cases of death of the Jedi. Was the fighter hit by a projectile before penetrating the enemy, or fell in the midst of the battle, surrounded by a numerically superior enemy? All this can be found by comparing on two graphs the moment of his death.
- The overall picture of the battle. Did it go smoothly, or were there “respites” and “climaxes”? Let's see if there are sharp jumps in the graph and get an answer to the question!
Conclusion
Source code with comments is available on GitHub . To start, download the repository and open index.html in your browser.
It turned out, in my opinion, an amusing sight. Charts allow you to collect information about the course of battles with various initial configurations. I wonder how would the graphics of real historical battles look like? Of course, this post discusses the fictional universe, but the real historical battles took place according to the same rules: the soldiers were knocked down in groups, attacked each other and, of course, suffered casualties.
However, one simulation should not be limited - there is an even more interesting task, namely, finding the best algorithm of actions for each participant in the battle. And here the game theory will help the researcher. But that's another story ...
')
Source: https://habr.com/ru/post/311196/
All Articles