GoTo school projects: recommendation system for a news portal
Within the framework of each GoTo school , many activities take place, schoolchildren implement dozens of successful and not-so-successful projects. Unfortunately, we are not able to tell about each project or incident, but it’s worth trying to share individual successes. Therefore, we are starting a cycle of articles from students about our successes and projects within our schools.
This summer, one of the partners - the company E-Contenta - proposed the task of creating a recommendatory system for the news portal of one of the TV channels. The guys from the company taught on the direction Data analysis and machine learning, and the task seemed pretty interesting to everyone - besides the real need for this kind of development, the task was also quite unique - the news recommendation methods are mostly different from the recommendation methods, for example, films.
Two pupils of the June school took up her decision: the 16-year-old Andrey Tvorozhkov from Moscow and the 14-year-old Vsevolod Zhidkov from Votkinsk. They also prepared a brief description of the problem and its solutions, which we publish in this article under the cat.
Task Description
A recommendation system is a program that allows you to predict the most interesting objects (for example, books, films or articles), already having some information about the current state. The state may be objects or data already liked by the user that we know about the client (for example, his musical preferences). Such data can be easily obtained by logging user actions on the site, collecting external information about the user or about the object.
The main task that the recommender system solves is to increase the usability of the product to the end user. We have to predict that the user will like it most likely and then he will be spared from having to search for it himself, which will allow us to keep the user on our resource. Thanks to high-quality recommender systems, digital giants such as Netflix, Spotify, and many other startups have grown.
Among the recommender systems, there are three main types: collaborative filtering, contextual and hybrid.
Collaborative filtering is probably the most popular model for recommending objects. Its main idea is that if objects are viewed by almost identical users, then these objects should be recommended to these users.
For example, if a certain Alice likes the TV series "Friends" and "The Big Bang Theory", and no one Bob likes "Brooklyn 9-9" and "Friends", then we can recommend "Brooklyn 9-9" to Alice and "The Big Bang Theory" to Bob.
In collaborative filtering there are two main approaches:
- Correlation models - the main idea of such models is based on the storage of a matrix of users / objects.
- Latent models are models that allow you not to keep a matrix of users / objects, but are built on the basis of the 'profiles' of users and objects. Profile is a vector of hidden characteristics.
The next way to build a recommender model is to use the recommended recommendations. This means that our model will depend on the contents of the objects. For example, you can evaluate the similarity of the news texts (about how exactly this one should be done a little later) or recommend Cameron's other films for the film Titanic. The main idea of this method is that we try to get as much information as possible about the object that we want to recommend, and use this information to search for the same objects, after which we simply recommend similar objects.
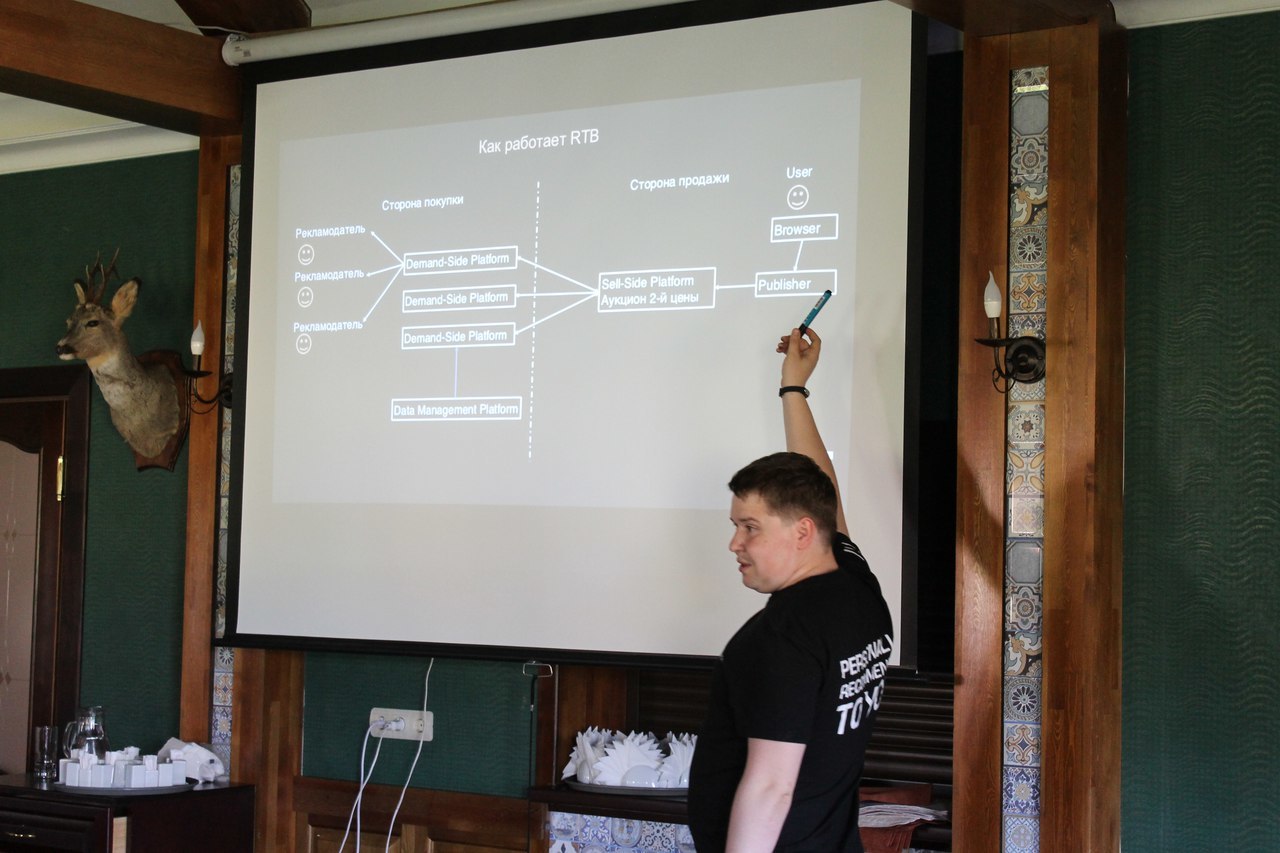
RTB for dinner from CTO E-Contenta

Collective creativity
Strength tests
Overcoming difficulties
Clash with reality on the example of the game Fingers
Survive the strongest

Burning bugs last
Decision
In our task on the recommendation of the news, we decided to use a hybrid model. It combines the results of the previous options and returns a weighted result.
Our hybrid model is based on the characteristics that we have dragged out for the object and returns to the user the probability that the user will read this article (click on it). After several tests, we decided to use Random Forest as an algorithm for machine learning, but this is not so important.
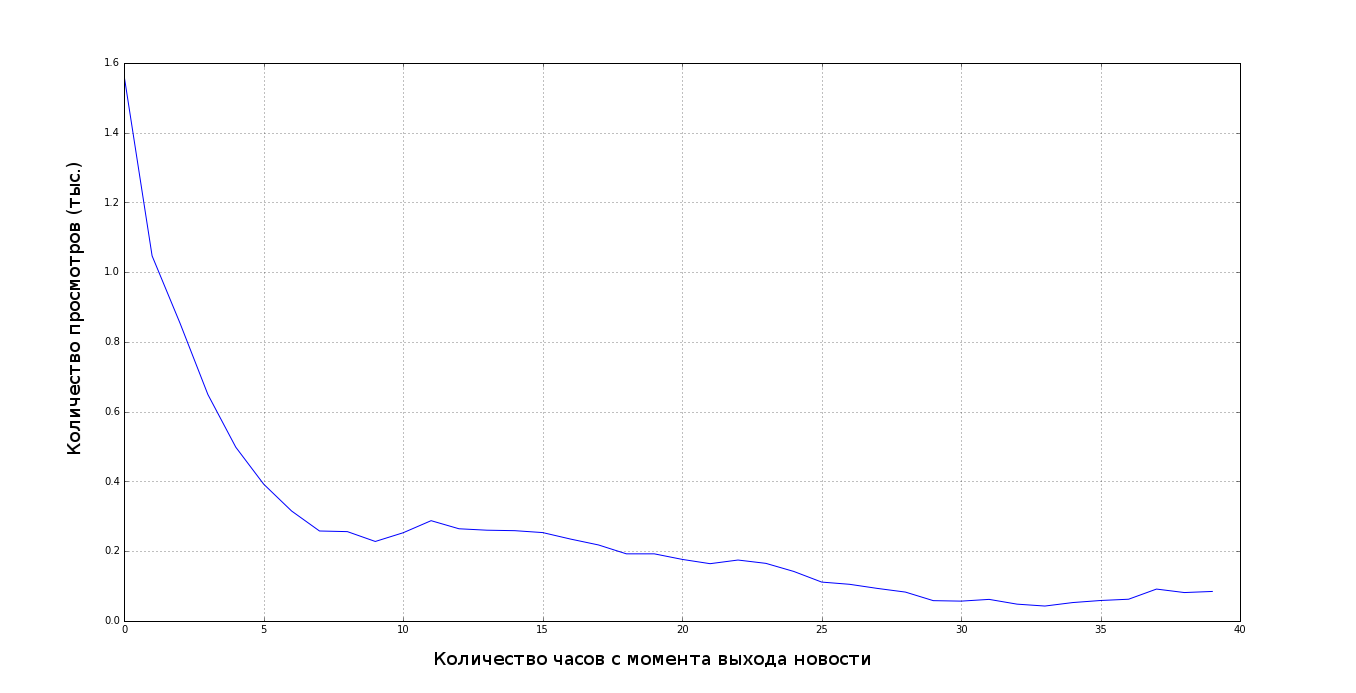
In all tasks of machine learning it is important to look at the distribution of data, build dependencies that will help you train the model, without this good result you cannot get. For example, in our task, before we write a model, we built a graph like this:
The essence of the hybrid model is that, as features, we provide it with some values obtained through the collaborative filtering and some values obtained using the content model.
Let's start with collaborative filtering. Let's calculate the similarity of news by users who have watched this article. For this, a cosine measure is often used - the cosine of the angle between two vectors, in this case, the users' views.

Since we want the recommendations to take into account not only one news, take the last three articles and one possible (the probability of transition to which we estimate), and then we calculate the cosine similarity from each of the read news to the possible. Thus we will have 3 features.
Now there is a more difficult task - to evaluate the similarity of news on their content. We swept off the simplest options like searching for keywords and counting their intersections due to little efficiency.
In the field of building content models, thematic modeling is a separate method - a method of dividing documents into topics without a teacher. There are several algorithms for this, in our system we used NMF - decomposition of non-negative matrices, it proved to be better than LDA - Dirichlet's latent placement. Before using NMF, we need to build a matrix, which we will expand, for this we used TF-IDF.
TF-IDF consists of two parts:
TF (term frequency) is the ratio of the number of a given word in a document to the number of words in a given document. With the help term frequency it is possible to estimate the importance of the word in the document. Note that the frequency of the so-called stop words - conjunctions and allied words, pronouns, prepositions, particles, etc.) will be more than others, so we have cleared all the news from them.

IDF (inverse document frequency) is the inverse of the frequency with which some word occurs in collection documents. With the help of IDF, we can throw out not only stop words, but also reduce the importance of frequently used nouns.

Since it is important for us to know both the importance of the word in the text and the uniqueness, we multiply TF-IDF and get:

With the help of TF-IDF we create a matrix of documents for words, at the intersection of the document and the word we put the value obtained from the TF-IDF:
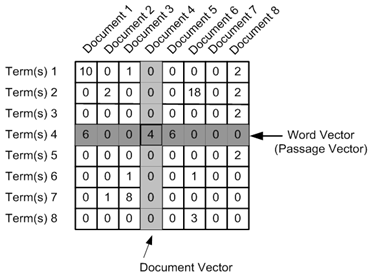
Having obtained the term-document matrix, we decompose it by singular values using NMF. After decomposition of the matrix, we can represent any document and term as a vector in space, the proximity between any combination of terms and / or documents is easily calculated using the dot product of vectors. After all this, we got quite sensible topics, for example, articles about Savchenko were in one cluster, in the other - about the laws that the State Duma proposes.
Using a gradient descent, we found the optimal value of the number of clusters for our data, it is 40. After the transformations, we can consider each news as a point in a 40-dimensional space, where each dimension is the degree of belonging to some cluster.
And as features we can use 40 values for each of the four news. In addition, you can do feature engineering and add the difference of each article read from the possible, but we did not.
As a result, we have a model, the predictions of which we were satisfied. For example, we read some news about the possible appointment of someone to the position of presidential adviser, immediately after this recommendation system gives us articles with specific names of candidates.
Quality metric
Nevertheless, even though we saw that the recommended articles are quite logical, it was necessary to calculate the quality metric of the recommendations. The most common metric is MAP @ K , where K is the number of recommendations. In our task, 10 articles are recommended to the user at a time, therefore K = 10. The metric allows us to find out how quickly we gave the user what he wants, in our case - how quickly we recommended the article that the user actually read.
As a result, MAP @ 10 was 0.75 for our final model, and 0.05 for the very first model. Our result turned out to be quite suitable, it showed and metric, and checking on the eye.
After we finished making a recommendation system, we built a web application with which you can evaluate its work. Its source is available on Github .
While working on the project, we noticed an important feature of such recommender systems: they very often drive users into the trap of articles on the same topic, so it’s worthwhile to include random articles to try to find other topics interesting to the user.
What is the result?
The results were highly appreciated by teachers and used by E-Contenta for further work on the customer’s project, and the guys were invited to an internship to solve new problems.
We, in turn, are very pleased that many companies are participating in the educational process and setting goals for the participants in our schools.
Nearest Activities
This fall, a school for high school and junior high school students will be held in Ingria business incubator with the participation of Jetbrains, CROC, Intel, Institute of Bioinformatics, BIOCAD, Parseq Lab, Classmates and other companies.
This is our first school in St. Petersburg. Participants will deal not only with data analysis and bioinformatics, but also with the Internet of things with the development of mobile applications, chat bots and web services. Everyone has the opportunity to win grants for free training in the areas of Bioinformatics and Data Analysis by taking part in GoTo Challenge competitions until October 22 by implementing a genomic assembly or thematic classifier of web pages .
We invite experts to participate in the role of mentors and teachers, especially happy startups who are willing to share tasks with the guys.
Also we will soon tell about the second hackathon GoToHack on data analysis, this time it is dedicated to the field of education and HR. Please note that the online stage has already been launched with assignments for Kaggle based on real data on students’s passing online courses on the Stepik.org platform.
')
Source: https://habr.com/ru/post/311118/
All Articles