Monitoring Postgresql: Requests
 In 2008, the pgsql-hackers mailing list began discussing an extension to collect statistics on requests. Starting from version 8.4, the pg_stat_statements extension is included in the postgres and allows you to receive various statistics about the requests that the server processes.
Typically, this extension is used by database administrators as a data source for reports (this data is actually the sum of indicators since the moment the counters were reset). But on the basis of this statistics, you can make monitoring requests - look at the statistics in time. This is extremely useful for finding the causes of various problems and, in general, for understanding what is happening on the database server.
I will tell you which metrics on requests are collected by our agent, how we group them, visualize them, and also tell you about some of the rakes we went through.
pg_stat_statements
So, what we have in view pg_stat_statements (my example is from 9.4):
postgres=# \d pg_stat_statements; View "public.pg_stat_statements" Column | Type | Modifiers ---------------------+------------------+----------- userid | oid | dbid | oid | queryid | bigint | query | text | calls | bigint | total_time | double precision | rows | bigint | shared_blks_hit | bigint | shared_blks_read | bigint | shared_blks_dirtied | bigint | shared_blks_written | bigint | local_blks_hit | bigint | local_blks_read | bigint | local_blks_dirtied | bigint | local_blks_written | bigint | temp_blks_read | bigint | temp_blks_written | bigint | blk_read_time | double precision | blk_write_time | double precision | Here, all requests are grouped, that is, we receive statistics not for each request, but for a group of requests that are identical from the point of view of pg (I’ll tell you more about it). All counters grow from the moment of start or from the moment of reset of counters (pg_stat_statements_reset).
- query - query text
- calls - the number of calls to the request
- total_time - the sum of the request execution times in milliseconds
- rows - the number of rows returned (select) or modified during the query (update)
- shared_blks_hit - the number of shared memory blocks received from the cache
shared_blks_read - the number of blocks of shared memory that is not read from the cache
The documentation is not obvious, this is the total number of blocks read, or only what was not found in the cache, check by code/* * lookup the buffer. IO_IN_PROGRESS is set if the requested block is * not currently in memory. */ bufHdr = BufferAlloc(smgr, relpersistence, forkNum, blockNum, strategy, &found); if (found) pgBufferUsage.shared_blks_hit++; else pgBufferUsage.shared_blks_read++;- shared_blks_dirtied - the number of shared memory blocks marked as dirty during the request (the request has changed at least one tuple in the block and this block must be written to disk, either checkpointer or bgwriter does)
- shared_blks_written - the number of shared memory blocks recorded on the disc synchronously during the processing of the request. Postgres tries to synchronously write a block if it has already returned dirty .
- local_blks - similar counters for local from the point of view of backend blocks, used for temporary tables
- temp_blks_read - the number of blocks of temporary files read from the disk.
Temporary files are used to process a request when there is not enough memory, limited by the work_mem setting . - temp_blks_written - the number of blocks of temporary files written to disk
- blk_read_time - the sum of the wait time for reading blocks of milliseconds
- blk_write_time - the amount of time to write blocks to disk in milliseconds (only synchronous writing is taken into account, the time spent by the checkpointer / bgwriter is not counted here)
blk_read_time and blk_write_time are collected only when the track_io_timing setting is enabled .
Separately, it is worth noting that only completed requests fall into pg_stat_statements. That is, if your request has already done something heavy for an hour and has not yet ended, it will be visible only in pg_stat_activity .
How requests are grouped
I have long believed that requests are grouped according to a real implementation plan. It was embarrassing only that requests with different number of arguments in IN are displayed separately, then they should have the same plan.
In the code, you can see that the hash is actually taken from the "significant" parts of the request after parsing. Starting from 9.4, it is displayed in the queryid column.
In practice, we have to additionally normalize and group requests already in the agent. For example, a different number of arguments in IN we collapse into one placeholder "(?)". Or the arguments that arrived in pg inlined in the query we ourselves replace with placeholders. The task is further complicated by the fact that the request text may not be complete.
Before 9.4, the query text is truncated to track_activity_query_size , c 9.4 the query text is stored out of shared memory and the restriction is removed, but we cut the query to 8Kb anyway, because if the query contains very heavy strings, the requests from the agent significantly post-load.
Because of this, we cannot parse the query with the SQL parser for additional normalization; instead, we had to write a set of regular expressions for additional stripping of queries. This is not a very good solution, as it is constantly necessary to add new scenarios, but nothing better has yet been thought up.
Another problem is that in the query field, the postgres records the first incoming query in the group before normalization while preserving the original formatting, and if the counters are reset, the request may be different for the same group. Very often, developers use comments in queries, for example, to specify the name of the function that pulls this query or the ID of the user query, they are also saved in the query .
In order not to produce new metrics for the same requests every time, we cut comments and extra whitespace characters.
Formulation of the problem
We did postgres monitoring with the help of our friends from postgresql consulting . They suggested that the most useful when searching for problems with the database, which metrics are not particularly useful, and advised on postgresql internals.
As a result, we want to receive from the monitoring answers to the following questions:
- how does the database now work as a whole in comparison with another period
- what requests load the server (cpu, disks)
- how many requests
- What are the different requests
We collect metrics
In fact, it is quite expensive to pour counters for all monitoring requests. We decided that we are only interested in TOP-50 requests, but we can’t just take top by total_time, since if we have a new request, its total_time will catch up with the old requests for a long time.
We decided to take the top of the derivative (rate) total_time per minute. To do this, once a minute, the agent reads pg_stat_statements entirely and stores the previous values of the counters. For each counter of each request, the rate is calculated, then we try to additionally combine the same requests, which pg considered different, their statistics are summarized. Then we take top, we make separate metrics for them, we summarize the rest of the queries into some query = "~ other".
As a result, we get 11 metrics for each query from the top. Each metric has a set of refinement parameters (tags):
{"database": "<db>", "user": "<user>", "query": "<query>"} - postgresql.query.time.cpu (we just subtracted the disk latency from total_time for convenience)
- postgresql.query.time.disk_read
- postgresql.query.time.disk_write
- postgresql.query.calls
- postgresql.query.rows
- postgresql.query.blocks.hit
- postgresql.query.blocks.read
- postgresql.query.blocks.written
- postgresql.query.blocks.dirtied
- postgresql.query.temp_blocks.read
- postgresql.query.temp_blocks.written
Interpret metrics
Very often, users have questions about the physical sense of the metrics "postgresql.query.time. *". Indeed, it is not very clear what the sum of response times shows, but such metrics usually show well the relationship of some processes with each other.
But if we agree not to take locks into account, we can very roughly assume that during the entire processing time of the request, the post-rescue utilizes a resource (processor or disk). Such metrics have a dimension: the number of resource seconds spent per second. You can also bring this to the percentage of utilization by request of the processor core, if multiplied by 100%.
We look what happened
Before relying on metrics, you need to check whether they show the truth. For example, let's try to figure out what causes an increase in the number of write operations on the database server:
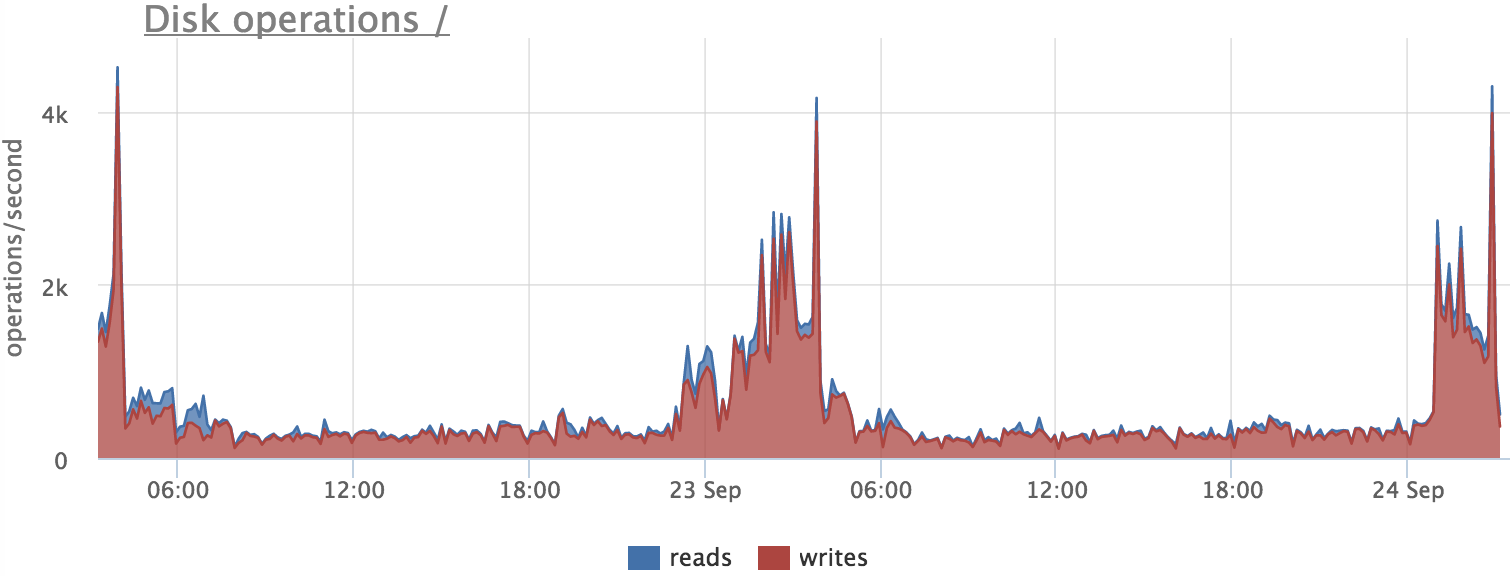
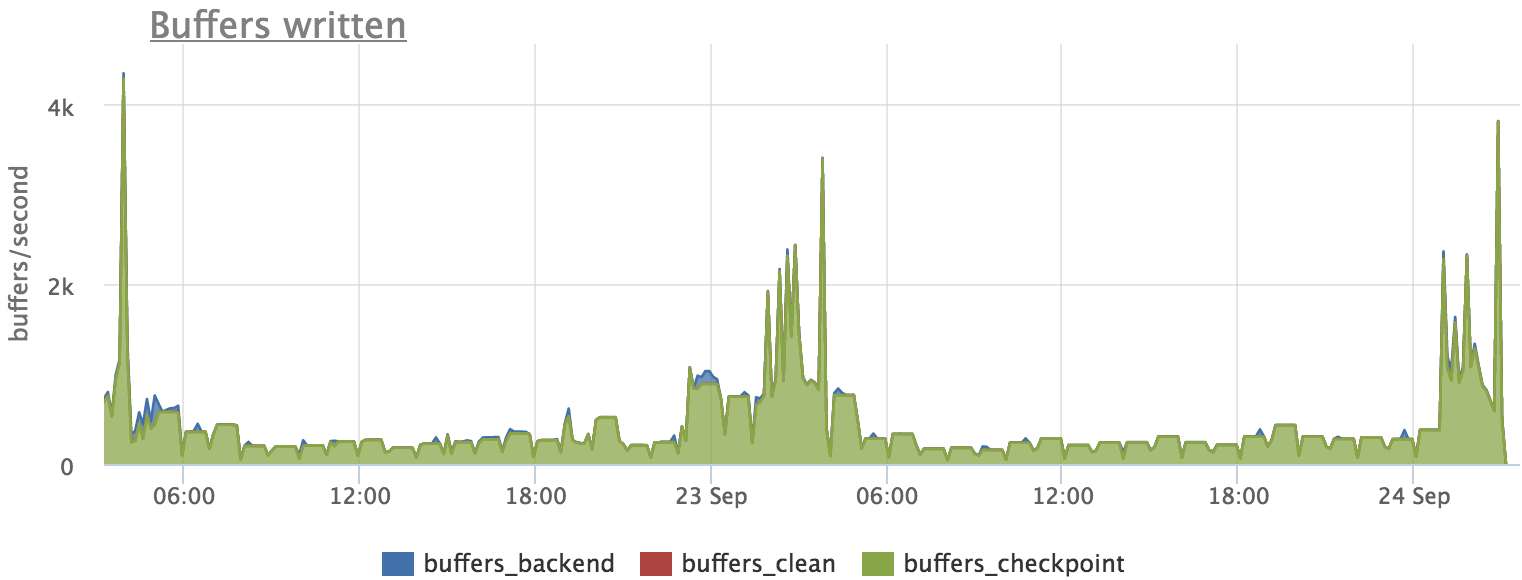
We look, whether wrote postgres on a disk at this time:
')
Further we find out, what requests "soiled" pages:
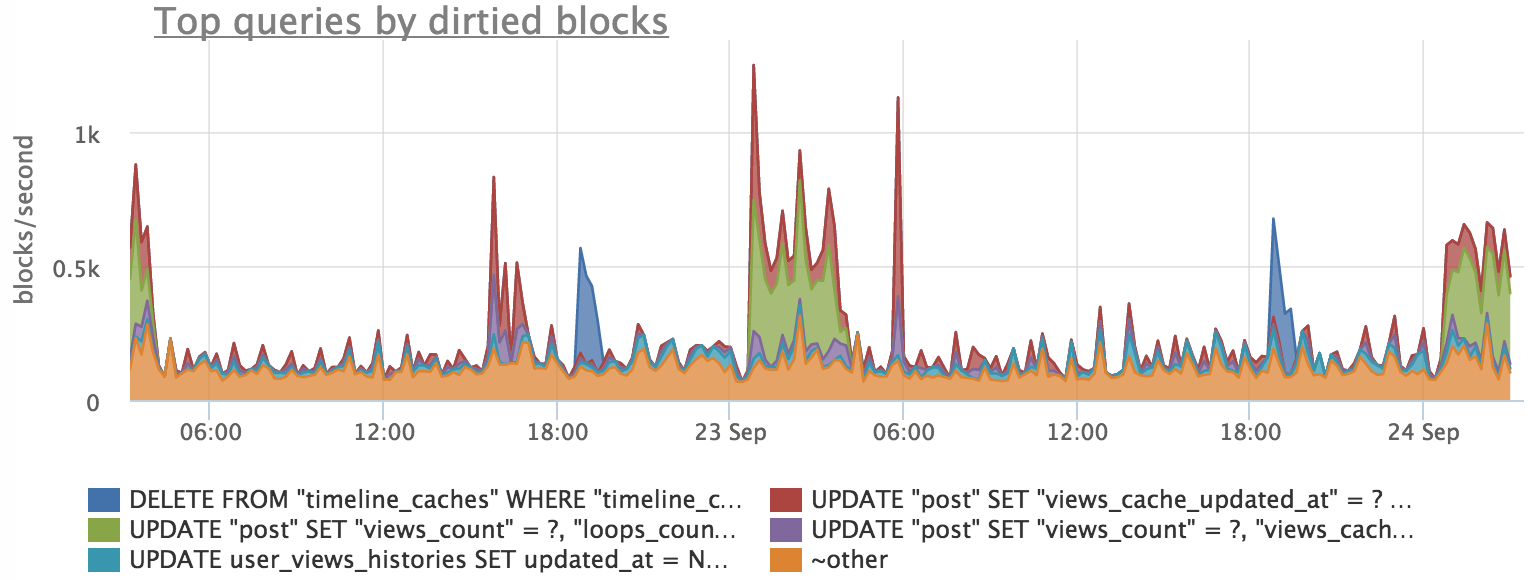
We see that there is an approximate coincidence, but the schedule for queries does not exactly repeat the buffer reset schedule. This is because the process of writing blocks occurs in the background and at the same time the profile of the load on the disk varies slightly.
Now let's see what kind of picture we have with reading:
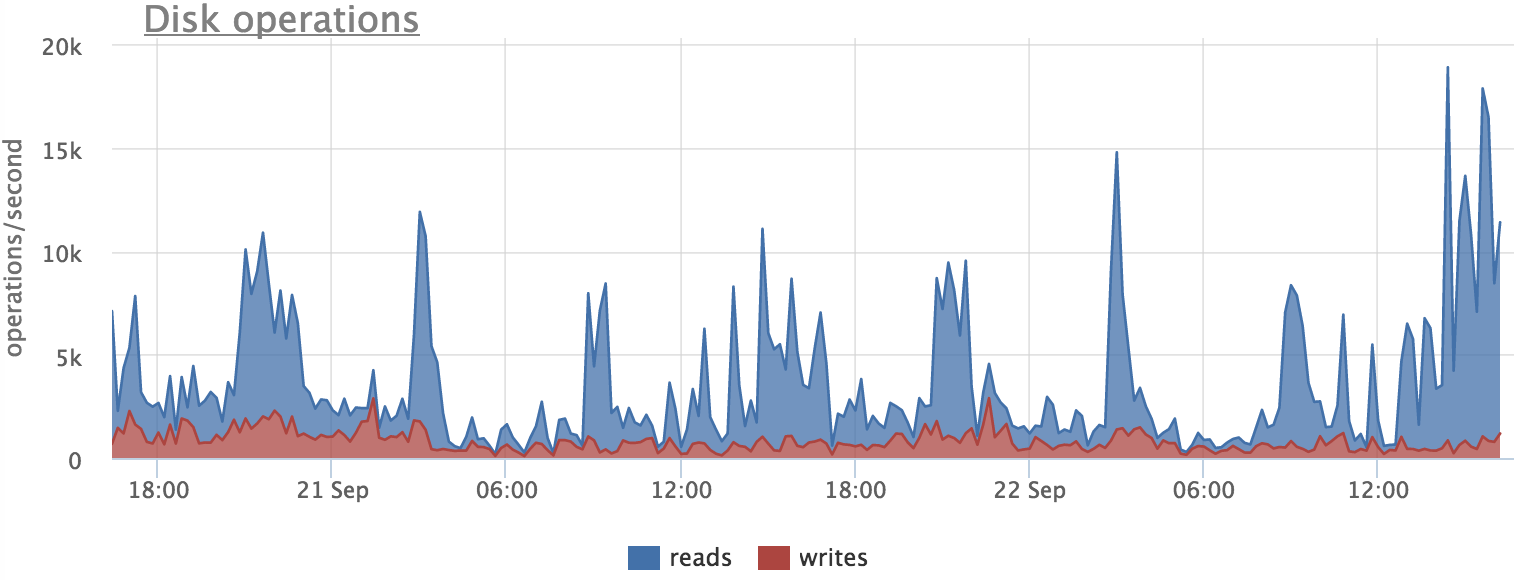
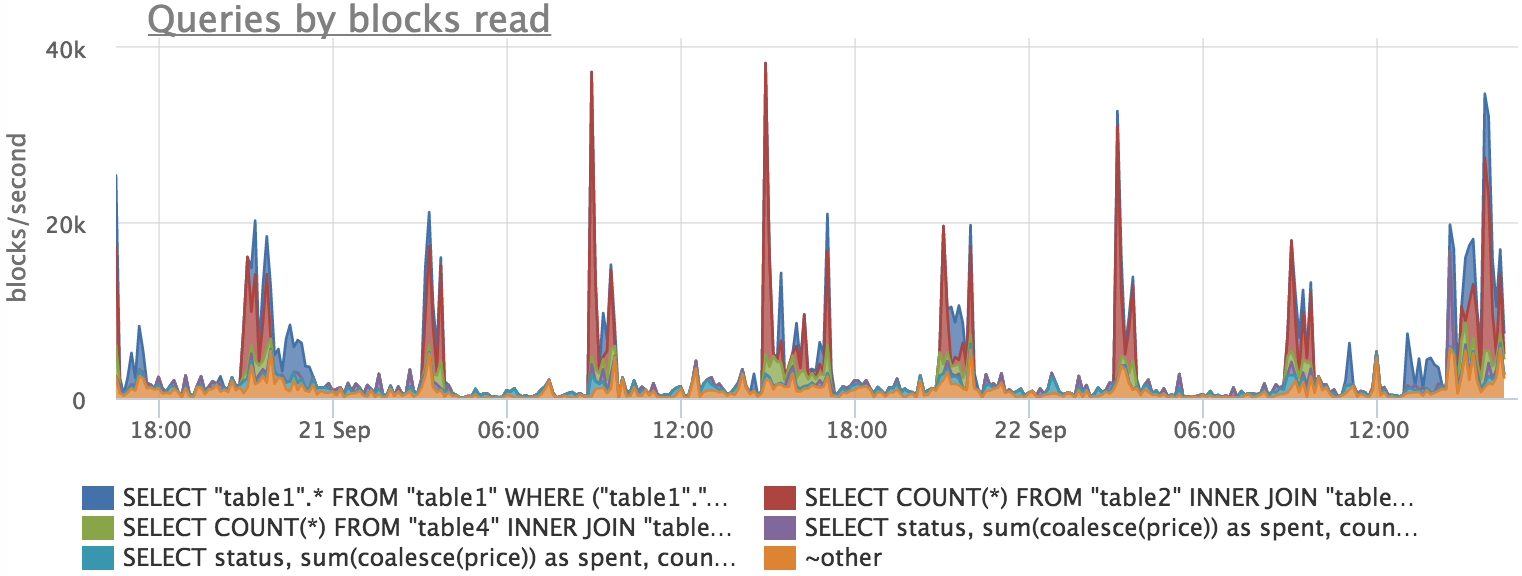
Here we also see that there is a correlation, but there is no exact match. This can be explained by the fact that postgres reads blocks from a disk not directly, but through the cache of the file system. Thus, we do not see part of the load on the disk, since part of the blocks is read from the cache.
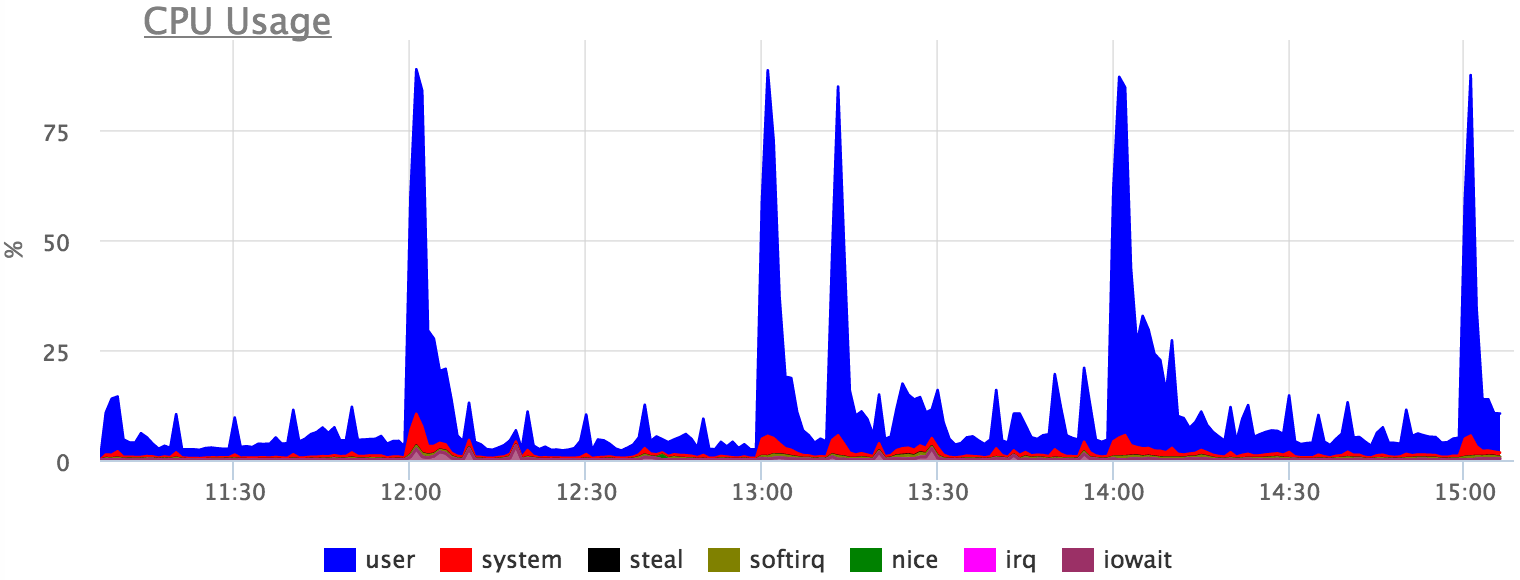
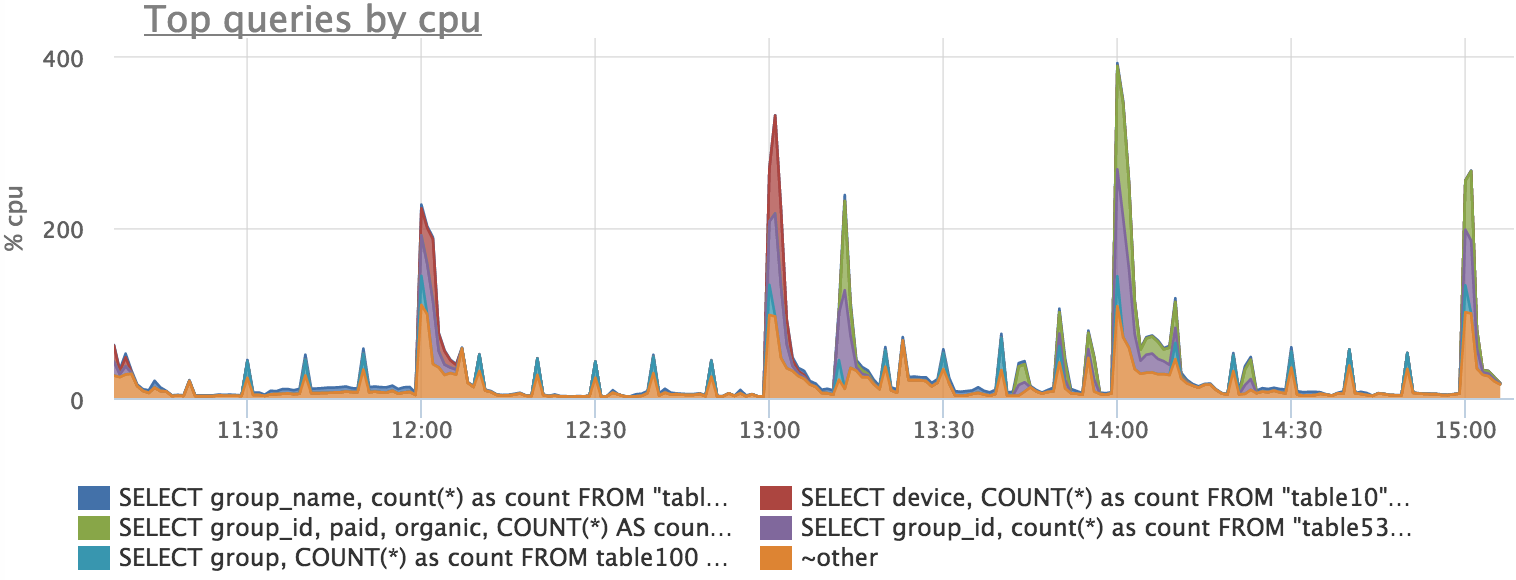
CPU utilization can also be explained by specific requests, but absolute accuracy cannot be expected, since there are expectations of various locks, etc.:
Total
- pg_stat_statements is a very cool thing that gives detailed statistics, but does not kill the server
- There are a number of assumptions and inaccuracies, they need to be understood for the correct interpretation of metrics
On our demo booth there is an example of metrics on demand, but the load there is not very interesting and it’s better to look at your metrics (we have a free, non-binding, two-week trial)
Source: https://habr.com/ru/post/311028/
All Articles