Data Science Week 2016. Review of the first and second day
Habr, hello! We publish a review of the first two days of Data Science Week 2016 , in which our speakers talked about customer relationships and internal optimization.

The first day of Data Science Week 2016 was devoted to using big data in customer relationships. Specific algorithms and technologies used were almost not mentioned, the emphasis was placed on the results and directions of their application in business.
Almost all the speakers touched upon the topics of recommendation systems: what media content, what rental options, what kind of advertising to offer the user? They also talked about using big data to attract and retain customers, create efficient and transparent forms of working with them, and improve the quality of customer service. We talked about the aggregation and verification of offers available on the market, about using big data to analyze the effectiveness of marketing channels.
')
Companies represented on this day collect a lot of data about users, analyze and extract business value from them.
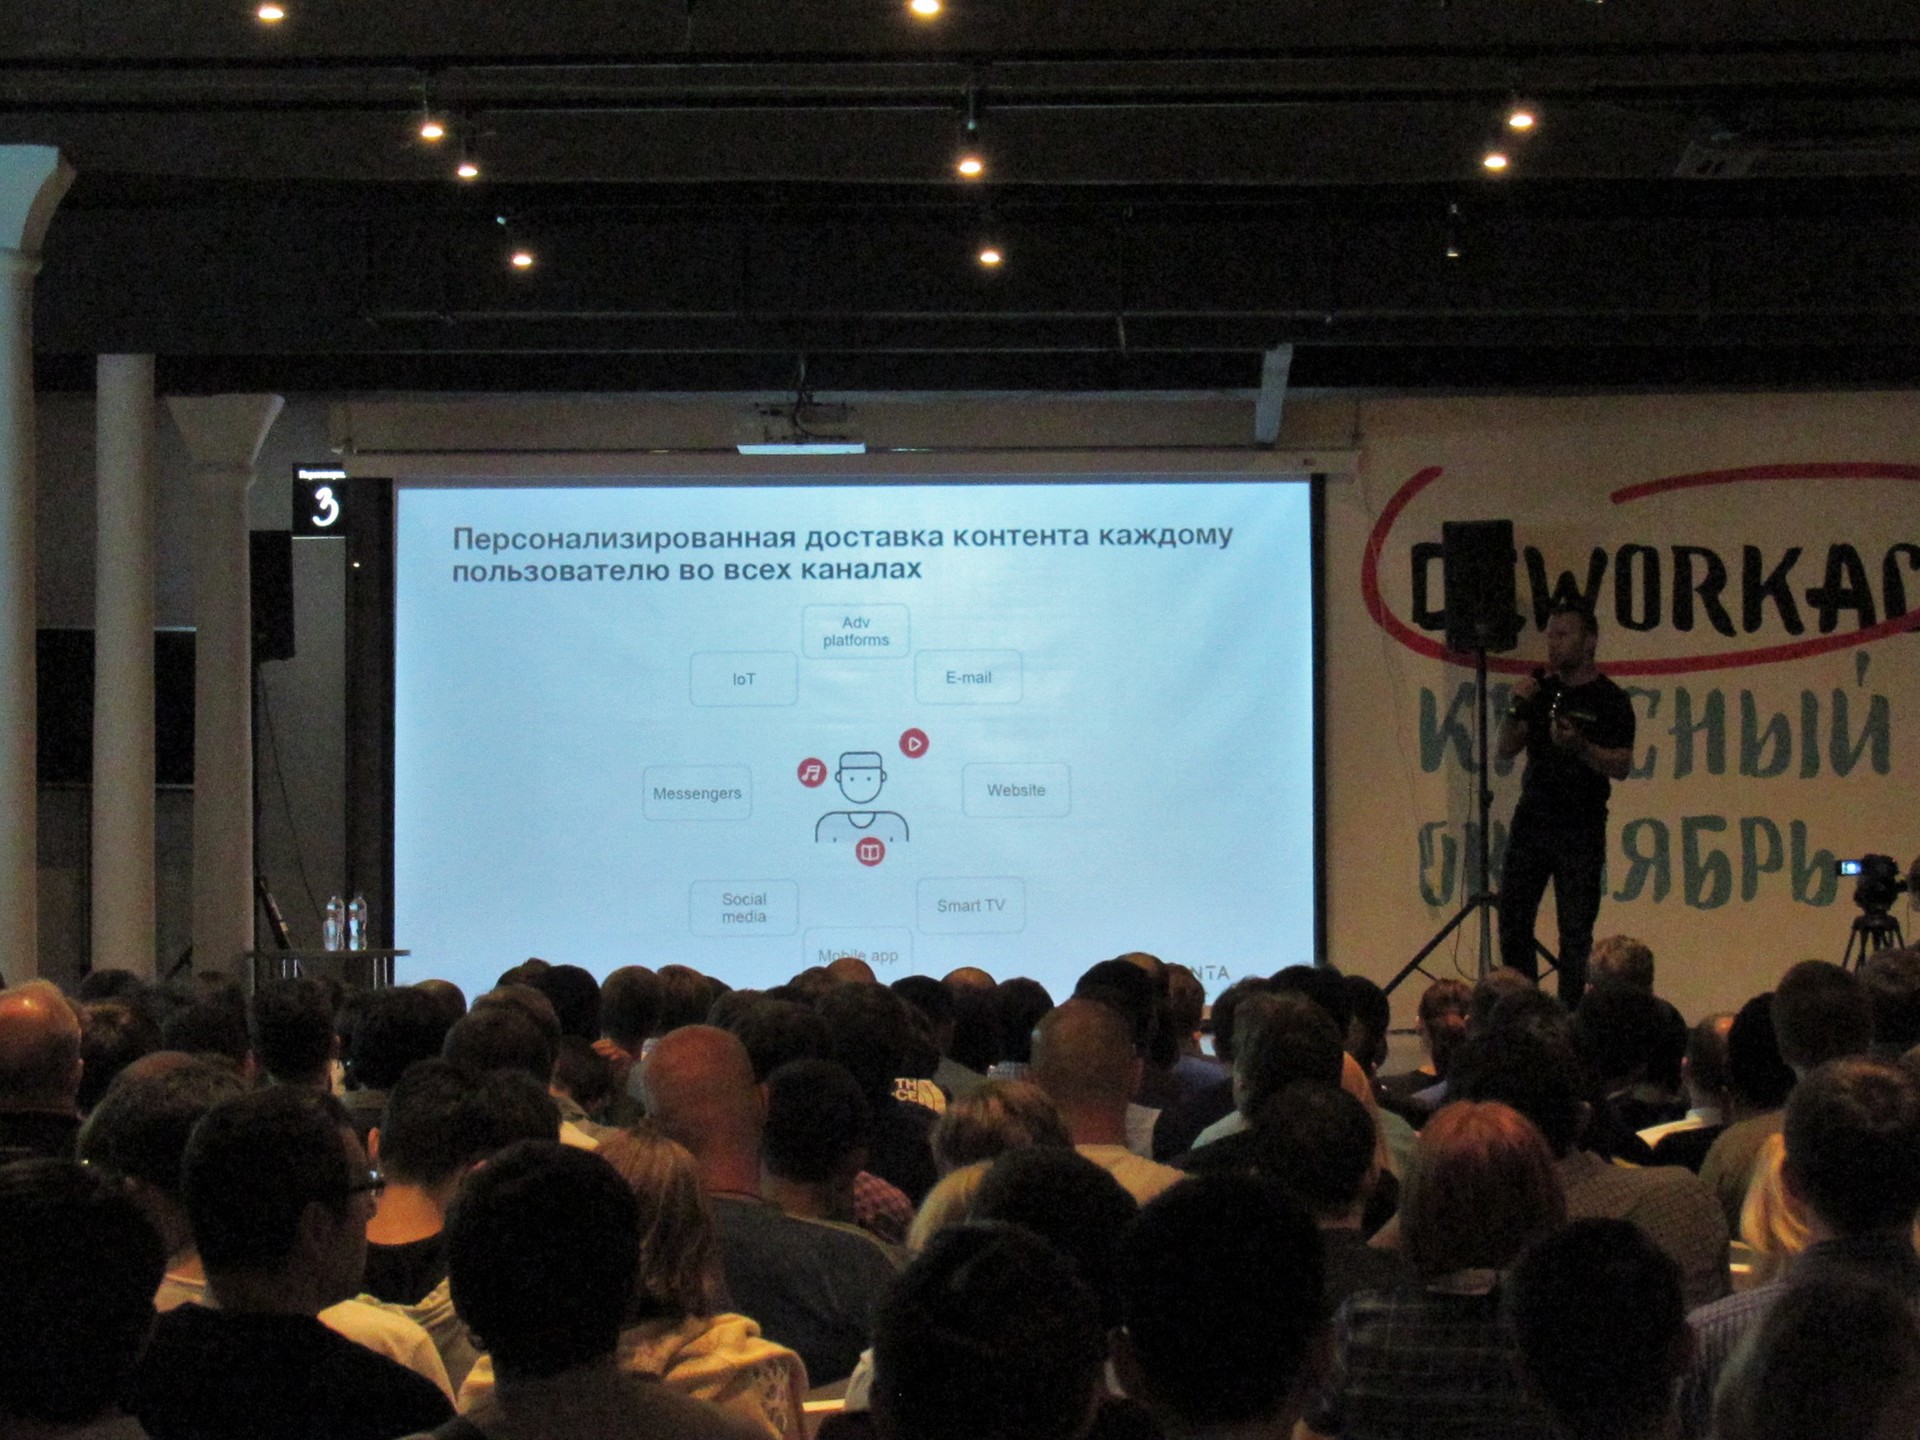
In the media industry, this is, first of all, the history of content consumption by users: there is a huge amount of such data, because people daily listen to music, read articles and books, watch movies and videos. The information specified by the user is also used during registration, if the user is authorized through social networks, information about him is taken and from there. Based on these data , E-Contenta manages to solve a wide range of tasks. These are personalized engagement (offering interesting content instead of advertising the resource as a whole), highlighting individual user profiles when using devices collectively (for example, when there is one TV in the family), recommending trend content, retaining the client and translating to new content (for example, from one series to another), remarketing (offering new interesting content to a “tired” or disinterested user), recommending future content that will only be created and about which little else estno.
In the real estate market, users make transactions quite rarely, so HomeApp collects only information about the user's viewing history of rental ads during this period. This information, as well as the collected database of ads and the results of price monitoring are visualized and used by company employees to recommend certain offers to customers. The company makes extensive use of expert methods; automatic recommendations are not yet built. The main focus is on preparing a database of proposals: data on apartments for rent are collected from social networks, from ad placement sites, from agencies' websites and various aggregators (for example, CIAN, Avito). Then, data analysis methods eliminate duplicates, exclude fraudulent ads that are used only to attract customers, and verify the information specified in the ads. As a result, the company has already managed to exceed the profitability indicators of other brokerage companies, the industry average number of transactions per broker is 2 times higher, and the share of clients who signed an agreement is 4 times higher.
The company RockStat is engaged in analyzing the effectiveness of digital marketing channels, determining what kind of visit to a resource had the desired effect, led to the conversion of viewing into a purchase, etc. For this, the following data is collected and analyzed: page views, events that occurred on pages, activity (mouse movements, scrolling, focus changes), data from third-party services via http-requests, data on calls from the site visitors and requests left on the site, as well as data CRM-systems (to understand exactly what kind of appeal led to the sale). Sessions are constructed from this data: it is determined from where the user came to the site, where he is located, from which device he came in, to collect them in chains by users, clear from "noise" and calculate the value of each session in the chain.
DCA offers quite unexpected data sources: information about the applications installed on the user's phone, including even the color of the icons. The fact is that advertising platforms do not provide enough information about the user, and this is one of the available open sources. According to the range of installed applications (those that show ads), you can predict the gender and user preferences. To assess the audience of applications, reviews written in the Play Market are used (for example, on literacy, blackmail and the expression of a common opinion, you can determine the children's age, by name - gender), Google Play recommendations on similar applications. The company also uses geolocation data to determine the time-zone and the formation of geo-targeted offers (for example, order food from a restaurant near the client).
Thus, the first day of Data Science Week showed a number of examples of how big data analysis allows us to understand what to offer to a specific user and through what channels, to form a reliable and transparent database of offers, to improve the quality of customer service, customer satisfaction and loyalty, and thereby increase efficiency business.
The second day of Data Science Week was dedicated to optimizing the internal processes of companies. Part of the presentations was devoted to optimizing work with data, the other part - optimizing internal processes with the help of big data, one presentation was devoted to improving the quality of work with clients and the services provided to them and was more relevant to the first day.
The first speaker, Andrei Kotov, representing GlowByte , spoke about the culture of working with data within companies. In many big data projects in which he had to participate, customers were not ready to provide quality data. In addition to typical data problems: duplicates, errors and contradictions, lack or redundancy of information, the report also highlighted the problem of the lack of a single standard for recording data, the inconsistency of the recorded data with objectively necessary categories. For example, in one of the fashion industry companies, color and type of clothing were recorded very subjectively and differently by fashion designers, storekeepers and other participants in the process, and in the food retail industry tulips were assigned to the same category as first freshness vegetables, which made it difficult to build recommendations. According to the speaker, companies need to inculcate a culture of working with data so that employees understand their value, accurately and unambiguously record them, trying to preserve relevant information. This will help the market as a whole, facilitate the work of ordinary analysts and big data companies.

Vadim Chelyshkov from Microsoft spoke about the use of data from various sensors that monitor the condition of the equipment to increase its reliability and also for personal purposes. Through the Internet of Things, sensors send huge amounts of real-time data to servers. Based on the analysis of such data, systems have been developed that predict the date and type of potential damage, in particular, elevators and pumps of oil production platforms. As an example of the use of this data for personal purposes, the speaker cited the product of the Russian company Raxel Telematics, which allows for several months to confirm the status of a neat driver based on vehicle sensor data and lower the price of insurance.
Dmitry Garmashev from QIWI spoke about the analysis of remittance graphs between clients of the Qiwi Wallet service: using an algorithm developed at the Belgian University Leuven, we managed to set up a quick breakdown of the service clients into communities and identify the roles of individuals within them. For example, it was possible to identify the community of users of one of the online games, within which sellers and buyers of cheat codes stood out. Combining them in one site allowed us to increase the number of transactions. It was also discussed about the analysis of the content of messages and the time of the existence of wallets in order to identify fraud. For work with graphs, the speaker recommended the NetworkX library of Python, as well as the visualization tools Gephi and D3.
Speech by Pavel Klemenkov from Rambler & Co was dedicated to optimizing the processing and analysis of big data within the company based on Apache Spark. He talked about the collection and visualization of data, the work of running procedures, in particular, about the success and time of their execution, the causes of errors. The speaker shared his experience in separating experiments with data and producing code, writing tests for all operations before running them on large amounts of data, developing feature windows — means of quickly selecting data in a training set, creating a system of timely notifications of emerging problems with the ability to call responsible persons . As a result of the introduction of the described system in the company, the number and speed of experiments performed increased, simple and convenient testing, debugging and code injection became possible, the reliability of operations increased, it became easier to understand and eliminate the causes of errors. The company uses the Kafka system as a single data bus, Graphite is used for monitoring at all stages, and AirFlow for visualization.
Finally, Alexander Laryanovsky from SkyEng , a company specializing in private English lessons, spoke about using data in building customer relationships and optimizing the content of lessons. For example, it turned out that, according to a number of behavioral characteristics, it is possible to predict whether a client will give up lessons and how much he will be willing to pay. The “larks”, who prefer early classes, turned out to be more motivated, as well as those who, when searching for a teacher, formulated any requirements for him. The content of the lessons was adjusted to the interests of the client based on the data of his profiles on social networks, which made it possible to increase the conversion after the trial lesson by 20%. Based on the statistics collected from students, it was possible to optimize teaching methods: to remove unnecessary exercises that most students do, to leave the most interesting and productive topics and forms of work.
»All presentations are posted here.
»Access to video speeches can be obtained here.
Day 1
The first day of Data Science Week 2016 was devoted to using big data in customer relationships. Specific algorithms and technologies used were almost not mentioned, the emphasis was placed on the results and directions of their application in business.
Almost all the speakers touched upon the topics of recommendation systems: what media content, what rental options, what kind of advertising to offer the user? They also talked about using big data to attract and retain customers, create efficient and transparent forms of working with them, and improve the quality of customer service. We talked about the aggregation and verification of offers available on the market, about using big data to analyze the effectiveness of marketing channels.
')
Companies represented on this day collect a lot of data about users, analyze and extract business value from them.
In the media industry, this is, first of all, the history of content consumption by users: there is a huge amount of such data, because people daily listen to music, read articles and books, watch movies and videos. The information specified by the user is also used during registration, if the user is authorized through social networks, information about him is taken and from there. Based on these data , E-Contenta manages to solve a wide range of tasks. These are personalized engagement (offering interesting content instead of advertising the resource as a whole), highlighting individual user profiles when using devices collectively (for example, when there is one TV in the family), recommending trend content, retaining the client and translating to new content (for example, from one series to another), remarketing (offering new interesting content to a “tired” or disinterested user), recommending future content that will only be created and about which little else estno.
In the real estate market, users make transactions quite rarely, so HomeApp collects only information about the user's viewing history of rental ads during this period. This information, as well as the collected database of ads and the results of price monitoring are visualized and used by company employees to recommend certain offers to customers. The company makes extensive use of expert methods; automatic recommendations are not yet built. The main focus is on preparing a database of proposals: data on apartments for rent are collected from social networks, from ad placement sites, from agencies' websites and various aggregators (for example, CIAN, Avito). Then, data analysis methods eliminate duplicates, exclude fraudulent ads that are used only to attract customers, and verify the information specified in the ads. As a result, the company has already managed to exceed the profitability indicators of other brokerage companies, the industry average number of transactions per broker is 2 times higher, and the share of clients who signed an agreement is 4 times higher.
The company RockStat is engaged in analyzing the effectiveness of digital marketing channels, determining what kind of visit to a resource had the desired effect, led to the conversion of viewing into a purchase, etc. For this, the following data is collected and analyzed: page views, events that occurred on pages, activity (mouse movements, scrolling, focus changes), data from third-party services via http-requests, data on calls from the site visitors and requests left on the site, as well as data CRM-systems (to understand exactly what kind of appeal led to the sale). Sessions are constructed from this data: it is determined from where the user came to the site, where he is located, from which device he came in, to collect them in chains by users, clear from "noise" and calculate the value of each session in the chain.
DCA offers quite unexpected data sources: information about the applications installed on the user's phone, including even the color of the icons. The fact is that advertising platforms do not provide enough information about the user, and this is one of the available open sources. According to the range of installed applications (those that show ads), you can predict the gender and user preferences. To assess the audience of applications, reviews written in the Play Market are used (for example, on literacy, blackmail and the expression of a common opinion, you can determine the children's age, by name - gender), Google Play recommendations on similar applications. The company also uses geolocation data to determine the time-zone and the formation of geo-targeted offers (for example, order food from a restaurant near the client).
Thus, the first day of Data Science Week showed a number of examples of how big data analysis allows us to understand what to offer to a specific user and through what channels, to form a reliable and transparent database of offers, to improve the quality of customer service, customer satisfaction and loyalty, and thereby increase efficiency business.
Day 2
The second day of Data Science Week was dedicated to optimizing the internal processes of companies. Part of the presentations was devoted to optimizing work with data, the other part - optimizing internal processes with the help of big data, one presentation was devoted to improving the quality of work with clients and the services provided to them and was more relevant to the first day.
The first speaker, Andrei Kotov, representing GlowByte , spoke about the culture of working with data within companies. In many big data projects in which he had to participate, customers were not ready to provide quality data. In addition to typical data problems: duplicates, errors and contradictions, lack or redundancy of information, the report also highlighted the problem of the lack of a single standard for recording data, the inconsistency of the recorded data with objectively necessary categories. For example, in one of the fashion industry companies, color and type of clothing were recorded very subjectively and differently by fashion designers, storekeepers and other participants in the process, and in the food retail industry tulips were assigned to the same category as first freshness vegetables, which made it difficult to build recommendations. According to the speaker, companies need to inculcate a culture of working with data so that employees understand their value, accurately and unambiguously record them, trying to preserve relevant information. This will help the market as a whole, facilitate the work of ordinary analysts and big data companies.
Vadim Chelyshkov from Microsoft spoke about the use of data from various sensors that monitor the condition of the equipment to increase its reliability and also for personal purposes. Through the Internet of Things, sensors send huge amounts of real-time data to servers. Based on the analysis of such data, systems have been developed that predict the date and type of potential damage, in particular, elevators and pumps of oil production platforms. As an example of the use of this data for personal purposes, the speaker cited the product of the Russian company Raxel Telematics, which allows for several months to confirm the status of a neat driver based on vehicle sensor data and lower the price of insurance.
Dmitry Garmashev from QIWI spoke about the analysis of remittance graphs between clients of the Qiwi Wallet service: using an algorithm developed at the Belgian University Leuven, we managed to set up a quick breakdown of the service clients into communities and identify the roles of individuals within them. For example, it was possible to identify the community of users of one of the online games, within which sellers and buyers of cheat codes stood out. Combining them in one site allowed us to increase the number of transactions. It was also discussed about the analysis of the content of messages and the time of the existence of wallets in order to identify fraud. For work with graphs, the speaker recommended the NetworkX library of Python, as well as the visualization tools Gephi and D3.
Speech by Pavel Klemenkov from Rambler & Co was dedicated to optimizing the processing and analysis of big data within the company based on Apache Spark. He talked about the collection and visualization of data, the work of running procedures, in particular, about the success and time of their execution, the causes of errors. The speaker shared his experience in separating experiments with data and producing code, writing tests for all operations before running them on large amounts of data, developing feature windows — means of quickly selecting data in a training set, creating a system of timely notifications of emerging problems with the ability to call responsible persons . As a result of the introduction of the described system in the company, the number and speed of experiments performed increased, simple and convenient testing, debugging and code injection became possible, the reliability of operations increased, it became easier to understand and eliminate the causes of errors. The company uses the Kafka system as a single data bus, Graphite is used for monitoring at all stages, and AirFlow for visualization.
Finally, Alexander Laryanovsky from SkyEng , a company specializing in private English lessons, spoke about using data in building customer relationships and optimizing the content of lessons. For example, it turned out that, according to a number of behavioral characteristics, it is possible to predict whether a client will give up lessons and how much he will be willing to pay. The “larks”, who prefer early classes, turned out to be more motivated, as well as those who, when searching for a teacher, formulated any requirements for him. The content of the lessons was adjusted to the interests of the client based on the data of his profiles on social networks, which made it possible to increase the conversion after the trial lesson by 20%. Based on the statistics collected from students, it was possible to optimize teaching methods: to remove unnecessary exercises that most students do, to leave the most interesting and productive topics and forms of work.
»All presentations are posted here.
»Access to video speeches can be obtained here.
Source: https://habr.com/ru/post/311024/
All Articles