How to answer a maximum of questions with one report?
Most recently, we, in the mobile and web application analytics service devtodev, have released a new Performance report. The report has already been tested by our customers, and has collected a flurry of praiseworthy reviews. We decided to explain in more detail what makes it so good.
Our goal in developing this report was to set maximum clarity and transparency. We wanted our client - application developer (as well as a marketer, analyst, game designer, application owner), to look at this report, to understand everything about the current state of the project.
And due to what we have achieved this:
')
A set of metrics . There are only 6 metrics in the report. It:
Thus, the set of metrics includes application scale metrics, analyzing which one can understand how big it is, whether it grows or not (talking about Active Users, New Users, Gross metrics), and qualitative metrics that speak about internal changes in the project. : Has the project become better at retaining users? Have users begun to pay more on average (ARPU, 1-day retention, 7-days retention)? Such a set of metrics is optimal and allows you to immediately look at the audience, and at the money, and at the quality indicator of retention.
The analysis period is 30 days. We chose between 7, 14 and 30 days and stayed at 30 days, because this is how you can best see both the current dynamics of the project and the seasonal behavior of users. For example, if your project is experiencing a rise in revenue every Friday and Saturday (which is quite typical for mobile games), then for a period of 30 days you will find it completely, and 7 or 14 days is not enough for that. That is, for each metric you can see how it behaved over the past 30 days, track its dynamics, trend and seasonality.
Cuts by country and device . We saw that our clients as a rule build reports exactly in these cuts and have benefited from this knowledge. Indeed, most often I want to know the structure of revenues or the audience by countries and by platforms. There is also a useful section on traffic sources, but not everyone has such a section.
The report opens by default. Previously, by default, we opened another report, which was updated every 5 minutes and showed cumulative values of the number of users and money in real time as compared with yesterday. We have nothing against this report, it remained in devtodev, however we decided that the new Performance report answers more questions. Thus, we want to minimize the barriers between the application developer and the application itself, between the data and the decisions made on their basis.
So, what questions can be answered using the Performance report:
In particular, the following hypothetical (and quite probable) cases can be solved with the help of the Performance report only:
1. The project falls revenue. We look at the audience and at the average income per user (ARPU).

Based on this, we understand where to run, to a marketer or to a game designer, and what to do, buy new traffic or search for reasons within the product itself, evaluate its changes over the past 30 days (in the example we cited, this is exactly the case!).
2. The project has dropped the audience. There are two hypotheses: either fewer newcomers began to arrive, or the project has become worse to retain existing users (we are looking at retention). If there are fewer newbies, go to the marketer and ask what happened (maybe just the money for the traffic ran out), if retention fell - we look at what we have been doing in the project over the past few days. Moreover, comparing the behavior of 1-day retention and 7-days retention, we can assess whether the drop is associated with a change in the first user session or with the main loop of using the application (core loop).
3. What are we all about falling something. Suppose we noticed a 1-day high-quality retention growth (for example, in the last 30 days we redid the first session, and users became better kept from the very beginning). Here we can see how this qualitative change affected the growth of the audience and income.

We draw your attention, all this is done in one place, in one report, without a single click on it. It opens by default: you run devtodev and immediately see the basic information about the project.
Of course, with the help of just such a report it is impossible to obtain absolute knowledge about the project. If you want more detailed information - please, we have dozens of other useful reports. But we continue to insist: with the role of the first report, which the user sees about the project, Performance copes perfectly.
Our goal in developing this report was to set maximum clarity and transparency. We wanted our client - application developer (as well as a marketer, analyst, game designer, application owner), to look at this report, to understand everything about the current state of the project.
And due to what we have achieved this:
')
A set of metrics . There are only 6 metrics in the report. It:
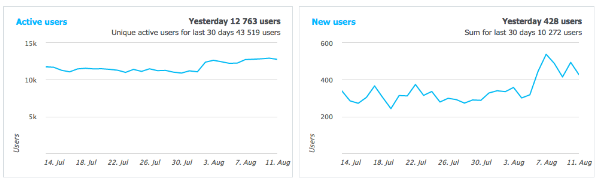
- Active Users (DAU) - the number of unique users who entered the project during the day;
- New Users - the number of unique users who first visited the application on this day;
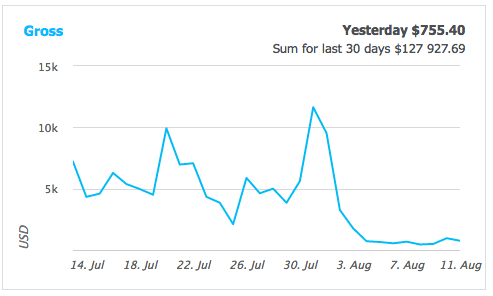
- Gross - the total amount of money that users paid for this day;
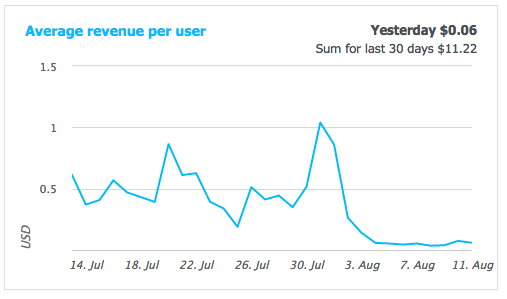
- ARPU (Average Revenue Per User) - the average income per user per day; calculated as Gross / Active Users;
- 1-day retention - the percentage of users who returned to the application 1 day after their first visit. As a rule, it is this metric that is used when speaking about short-term retention of users: did they like the appearance of the application, did they understand how it could be useful for them;
- 7-days retention - the percentage of users who returned to the application 7 days after the first visit. Users remaining in the application for 7 days have already figured out in more detail and are less likely to leave it in the coming days.
Thus, the set of metrics includes application scale metrics, analyzing which one can understand how big it is, whether it grows or not (talking about Active Users, New Users, Gross metrics), and qualitative metrics that speak about internal changes in the project. : Has the project become better at retaining users? Have users begun to pay more on average (ARPU, 1-day retention, 7-days retention)? Such a set of metrics is optimal and allows you to immediately look at the audience, and at the money, and at the quality indicator of retention.
The analysis period is 30 days. We chose between 7, 14 and 30 days and stayed at 30 days, because this is how you can best see both the current dynamics of the project and the seasonal behavior of users. For example, if your project is experiencing a rise in revenue every Friday and Saturday (which is quite typical for mobile games), then for a period of 30 days you will find it completely, and 7 or 14 days is not enough for that. That is, for each metric you can see how it behaved over the past 30 days, track its dynamics, trend and seasonality.
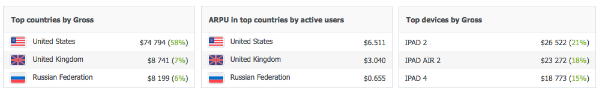
Cuts by country and device . We saw that our clients as a rule build reports exactly in these cuts and have benefited from this knowledge. Indeed, most often I want to know the structure of revenues or the audience by countries and by platforms. There is also a useful section on traffic sources, but not everyone has such a section.
The report opens by default. Previously, by default, we opened another report, which was updated every 5 minutes and showed cumulative values of the number of users and money in real time as compared with yesterday. We have nothing against this report, it remained in devtodev, however we decided that the new Performance report answers more questions. Thus, we want to minimize the barriers between the application developer and the application itself, between the data and the decisions made on their basis.
So, what questions can be answered using the Performance report:
- What is the size of the project audience?
- how many users come in a day?
- how much money do they pay?
- How does the project keep users?
- How have all these indicators changed in the last 30 days?
- Were there any qualitative changes in the project, how did they affect its scale?
- What are the most popular in terms of audience and money for countries and platforms?
In particular, the following hypothetical (and quite probable) cases can be solved with the help of the Performance report only:
1. The project falls revenue. We look at the audience and at the average income per user (ARPU).
Based on this, we understand where to run, to a marketer or to a game designer, and what to do, buy new traffic or search for reasons within the product itself, evaluate its changes over the past 30 days (in the example we cited, this is exactly the case!).
2. The project has dropped the audience. There are two hypotheses: either fewer newcomers began to arrive, or the project has become worse to retain existing users (we are looking at retention). If there are fewer newbies, go to the marketer and ask what happened (maybe just the money for the traffic ran out), if retention fell - we look at what we have been doing in the project over the past few days. Moreover, comparing the behavior of 1-day retention and 7-days retention, we can assess whether the drop is associated with a change in the first user session or with the main loop of using the application (core loop).
3. What are we all about falling something. Suppose we noticed a 1-day high-quality retention growth (for example, in the last 30 days we redid the first session, and users became better kept from the very beginning). Here we can see how this qualitative change affected the growth of the audience and income.
We draw your attention, all this is done in one place, in one report, without a single click on it. It opens by default: you run devtodev and immediately see the basic information about the project.
Of course, with the help of just such a report it is impossible to obtain absolute knowledge about the project. If you want more detailed information - please, we have dozens of other useful reports. But we continue to insist: with the role of the first report, which the user sees about the project, Performance copes perfectly.
Source: https://habr.com/ru/post/310958/
All Articles