Intel tools for optimizing applications and the problem of flows in porous media
Modern computer systems, from a typical laptop to a computing cluster, are designed for parallel data processing. Therefore, the more fully programs use this feature, the more chances they have to unleash the potential of existing hardware solutions. However, before proceeding to a parallel code execution scheme, this code should work as efficiently as possible in single-threaded mode. Otherwise, an increase in the number of threads will not yield the expected productivity growth.
Optimizations that affect the speed of calculations when using any number of threads are reduced to taking into account in the code the features of processor architectures, instruction sets, to finding the most rational ways of working with different types of memory. Assistance in such optimization can be provided, for example, by a top-down approach to performance research using low-level data on system events, which are converted to high-level indicators that are available for analysis and practical application.

')
Here we will consider a technique for optimizing computations related to modeling flows of multiphase liquids in porous media according to the method proposed in this paper. This is a numerical method for solving partial differential hyperbolic equations.
Simulation of flows of multiphase fluids in porous media
This task is used in many areas. For example, in the field of oil and gas, industry, ecology.
We will consider the methods of vectorization of the code, tell you about the transition from serial to parallel execution, we will conduct a series of experiments. The experiments were conducted on Intel platforms, various software tools were used to analyze and optimize the application, in particular, Intel VTune Amplifier.
The material consists of three main sections:
Here, as a hardware platform for experiments, the system is used on Ubuntu 14.04 with an installed Intel Core i5-4350U processor (1.4 GHz, 2 cores, 4 threads) with 3 MB of cache and 4 GB of RAM. Our experimental environment is built on a processor belonging to the Intel Haswell family, which is fully supported by the Intel AVX2 instruction set. Using the capabilities of this set of instructions, in particular, improved support for vectorization, improves the performance of applications designed for a wide range of platforms, including server solutions based on Intel Xeon and Intel Xeon Phi.
When developing for the Intel AVX2, the same programming model was used that was used in the previous version, Intel AVX, however, the new instructions extend what it was by offering most 128-bit integer SIMD instructions with the ability to handle 256-bit numbers. The vectorization of the code allows to reveal the potential of a single-threaded version of the program, which is extremely important before proceeding to the next step - parallel execution.
Intel Parallel Studio XE 2015 is used here to analyze performance and evaluate optimization quality.
In order to understand how to optimize the code, you need to analyze it and find the program blocks, the execution of which can be accelerated through vectorization and parallelization. In order to achieve this, you can use the tools of Intel, such as Intel VTune Amplifier and Intel Parallel Advisor. In this regard, the reports generated by the compiler are very useful.
Such tools allow you to analyze the source code of the application and executable files, giving hints about the directions of optimization. The main bottlenecks in the processor pipeline are mostly explored.
Modern microprocessors implement pipelining of instructions, and, along with this approach, they use other techniques, such as hardware flows, execution of commands with a change in their order, and parallelism at the instruction level. All this is done in order to make the most of the resources of the system.
The programmer who is engaged in code optimization is not an easy task. The main difficulty here is that he needs to use the hardware capabilities of the computer as efficiently as possible, and they are at the level of the microarchitecture of the computing system, which is located quite far from the level of abstraction provided by modern programming languages such as C, C ++ and Fortran.
Intel tools can help optimize code by analyzing the compilation and composition of the application, giving information about the timing of program execution to determine exactly how the hardware resources are used. Among these tools are compiler reports, Intel VTune, Intel Parallel Advisor. Here's how to organize work with them.
A programmer, by combining the data obtained using the above tools, can change the source code of the program and the compilation parameters in order to achieve optimization targets.
Modern compilers are able to vectorize executable code. In particular, for this, the optimization parameter is set to -
In a nutshell, vectorization is the transformation of a program, after which one instruction is able to perform some operations with several data sets. Consider as an example the processing of the cycle below.
If this cycle has not been subjected to vectorization, the use of registers in its execution looks something like the one shown in the figure below.
Using registers when executing a loop that has not been subjected to vectorization
If the same cycle is vectorized, additional registers will be involved, as a result, it will be possible to perform four addition operations using one instruction. This is called “one command stream — many data streams” (Single Instruction Multiple Data, SIMD).
Execution of a vectorized cycle
Such an approach usually improves performance, since one instruction processes multiple data sets instead of one.
In the flow simulation application in porous media, the optimization of which we are engaged in, automatic vectorization allowed us to double the performance of the Haswell processor, which supports the Intel AVX2 instruction set.
The -
The figure below shows the summary report of the Intel VTune Amplifier program compiled without using the parameter -
VTune Amplifier report, the -xHost parameter is not used
The main goal of optimization in this case is to reduce the code execution time and increase the CPI, which, ideally, should be 0.75, which means taking full advantage of the capabilities of the pipeline.
The figure below shows a list of application modules, sorted by effective computer time.

List of application modules
Note that the
Note that the CPI is very bad for the function
Here is the source code snippet for the

Fragment of the assembly code linear reconstruction
The following instructions can be seen in this code snippet: MULSD, MOVSDQ, SUB, IMUL, MOVSXD, MOVL, MOVQ, ADDQ. They are all from the Intel Streaming SIMD Extensions 2 (Intel SSE2) instruction set. These “old” instructions appeared with the release of the Intel Pentium 4 processor in November 2000.
Having compiled the same code with the
VTune Amplifier report, the -xHost parameter is used
Namely, the code execution time is now 65.6 seconds, CPI is 0.62, which is much better than it was before and closer to the ideal value of 0.75.
In order to understand the reason for this increase in performance, you can look at the assembler code. There you will find instructions from the Intel AVX2 command set. In addition, comparing VTune Amplifier reports, you can see that when using Intel AVX2, the number of executed instructions is much less than in the case of using SSE2 in a non-vectorized version of the code.
This is due to the fact that the final data does not take into account the instructions whose execution was canceled, as they were in the branch where the code should not have been executed due to incorrect branch prediction. A smaller number of such errors also explains the improvement in the CPI parameter.
Here is the same fragment of the source code, which we considered above, but now its assembly representation is obtained after turning on the parameter -
Fragment of vectorized assembler linear reconstruction code
Please note that most of the instructions here are vector, from the Intel AVX2 kit, and not from SSE2. Vector instruction names begin with the prefix
For example, using a VMOV instruction instead of MOV indicates that we are dealing with vectorized code.
In the figure below you can see the register comparison for the Intel SSE2, AVX and AVX2 instruction sets.

Registers and instruction sets
An easy-to-use approach with the inclusion of automatic vectorization allows you to achieve a threefold increase in productivity.
In the system with which we experiment, 4 threads can run on two physical cores. Now the only improvement in the code that has been made is the automatic vectorization performed by the compiler. We are still far from a program that is able to work at the limit of the system capabilities, the code can still be optimized. In order to continue improving the code, you need to identify its bottlenecks. For example, in the original version of our application there are many lines where division is used.
The
Here is a fragment of the source code where the division operation is often used. This code is located inside the
Many division operations in an important section of code
However, the
Here is another important issue that can be solved with Intel tools. In our case, it lies in the fact that many application modules are written in Fortran, which complicates their optimization. In order for interprocedural optimization to be performed when preparing the code for execution, the
Using the

The result of using the options –ipo, -xHost and –no-prec-div
In order to better understand the contribution to the performance of the program, which makes use of the
Another test, this time with the
Intel VTune Amplifier can not only report on the time spent on program execution, on the CPI, and on how many instructions have been executed. Using his General Exploration profile, you can get information about the behavior of the program inside the processor pipeline and find out whether it is possible to improve performance, given the limitations of the processor and memory.
Restrictions of the computational core (Core Bounds) relate to problems that are not related to the transfer of data in memory and affect performance when executing instructions with a change in their order or when the operating units are overloaded. Memory bounds can cause inefficient pipeline operation due to the need to wait for the load / save instructions to complete. Together, these two parameters define what is called Back-End Bounds, this indicator can be interpreted as constraints arising inside the pipeline.
If pipeline downtime is caused by empty slots, that is, by the fact that microcommands do not have time to enter it for any reason, and part of the pipeline does not perform useful work only because it has nothing to process, we already have the so-called Front-End Bounds - external to the pipeline restrictions.
Here is a diagram of a typical modern pipeline that supports code execution with a change in the sequence of commands.
Intel processor pipeline that supports the execution of instructions with a change in their order
Internal structures, back-end pipelines, are ports for delivering instructions to the ALU, to the load and store blocks. Unbalanced use of these ports usually has a bad effect on performance, since some units can either be idle or not be used as evenly as others that are overloaded.
For the application that we are reviewing here, the analysis has shown that even when using automatic vectorization performed by the compiler, there are problems with the execution of the code. Namely - the high value of Core Bound due to the unbalanced distribution of instructions on the ports.
Limitations of the compute core
The analysis results shown in the figure above indicate a high level of clock cycles (0.203, or 20.3%), in which no ports are involved. This indicates inefficient use of processor resources. In addition, a high level of cycles (0.311, or 31.1%) is noticeable when three or more ports are involved. This situation leads to overload. Obviously, we have an unbalanced use of resources.
The results of the situation analysis, performed in the Intel VTune Amplifier and shown in the figure below, reveal the causes of the problems described above. In this case, there are four functions (
Back-End Bound and Bad Speculation Analysis
The next step in our research is to use the Intel VTune Amplifier as a tool for analyzing the problems identified. We are going to thoroughly examine each function noted above in order to find code points that are wasting CPU time.
Analyzing each function that has a high rate in the column Back-End Bound, you can find out exactly where problems arise. In the several figures below, you can see that the Intel VTune Amplifier shows the source code and the corresponding metrics for each row. Among them are successfully completed instructions (Retiring), prediction errors (Bad Speculation), measures (Clockticks), CPI, restrictions within the pipeline (Back-End Bound). In general, the high value of the Clockticks index indicates the responsible lines of code, and VTune highlights the corresponding values.
Here is an analysis of the
Analysis of the reasons for the high value of the Back-End Bound in the transport function
The function
Fkt function analysis
Here is the code for the functions
Here it is important to pay attention to the fact that here we are talking about the two-dimensional components of the vector

The

Xlo function
Here is an analysis of the
Xmax_speed function
Intel VTune Amplifier uses the data on the functions we analyzed above to find the final Back-End Bound score.
As already mentioned, the reason for such restrictions may be inefficient use of the processor or memory. Since automatic vectorization has already been applied to our code, it is very likely that the cause of the situation is in memory. Further analysis, namely, consideration of the Memory Bound metric, the data on which is given below, suggests that the program uses the first-level cache inefficiently (L1 Bound metric).

Memory Bound
Since the application has a large number of data structures, such as vectors, required in a variety of different functions, they need to be carefully examined in order to find approaches to improving performance by reducing memory latency. In addition, you should pay attention to the alignment of the data in order to help vectorize the code.
In order to discover more possibilities of code optimization by means of vectorization, you should use the compiler reports, as you can find information about cycles that can be vectorized. The
Some external loops are not vectorized due to the fact that the corresponding inner loops are already vectorized due to the automatic vectorization technique described above. In this situation, the compiler gives the following message:
In some cases, the compiler instructs the developer to use the SIMD directive to cycle the vector, but when this is done, the cycle still does not vectorize due to the fact that the assignment to a scalar variable is performed in it:
Here is the corresponding compiler message:
Most of the cycles were automatically vectorized by the compiler, and in some cases the potential performance increase estimated by the compiler ranged from 1.4 (most cycles) to 6.5 (this figure was obtained only for one cycle).
When the compiler detects that after vectorization, performance drops (that is, the performance increase is less than 1.0), it does not conduct vectorization. Here is one example of a compiler message in a similar situation.
In reality, the performance after automatic vectorization has increased about three times, in accordance with the average value estimated by the compiler.
Analysis of the reasons why the compiler does not vectorize certain cycles should be carried out before using other optimization methods.
All tests that were carried out up to the present moment were carried out as applied to solving a problem, the space of which is a grid of 100x20x100 in size, and 641 computation steps are carried out using a single computational flow.
Here we take a look at working with grids of other sizes in order to compare the overall performance gains obtained through automatic vectorization. Here is a comparison.
These tests showed that the larger the mesh, the greater the productivity growth achieved due to automatic vectorization. , , , .
, .
, , , , , , , . . Intel VTune Amplifier.
, , , , . Ubuntu 14.04.3 LTS, Intel Core i7-5500U (2.4 , 4 -) HT ( ). Intel Broadwell, Intel AVX2. 7.7 .
Broadwell 14- , Haswell. «-» («tick-tock»), Intel, «», , , , .
Intel VTune XE 2016. ,
641 100x20x100, 39.259 , Haswell 1.4 . Intel VTune Amplifier.
Intel VTune Amplifier
, , , 1.7 , , . , 1.4, .
, Back-End Bound 0.375. , , .
Back-End Bound.

Intel VTune Amplifier
, Back-End Bound ( Core Bound), – (Divider). , , Port Utilization. , ALU. Core Bound – . , , . , , , , , . , , , .
, , . , .
Back-End Bound, , , , . .
Intel VTune Amplifier
, , - - .
OpenMP.
, Hyper-Threading, , , .
Intel VTune .
Intel VTune
, , , OMP_NUM_THREADS 2. 1.8 , Back-End Bound , .
. , , , , Bad Speculation
Intel VTune Amplifier
Bad Speculation , - . . -, , . -, - .
, , . , . CPI Rate
, , .

«O» , , , : , , . , - – , , . - , . xl, xln, xlc, xr, xrn, xrc, yun, yu, yuc, ydc, yd ydn – , , , , OpenMP.
, , , , . .
. , , 10x2x10, . , , , . , , OpenMP, , .
Intel VTune Amplifier, .

Intel VTune, 1
– , .

Intel VTune, 2
, Front-End Bound , Back-End Bound – . , – .
Intel Parallel Advisor – , . , .
Intel Parallel Advisor :
, . , ,

Intel Parallel Advisor
Intel Parallel Advisor , , , ( ), (Intel AVX, AVX2, SSE ). , , . , , , .
, , , . , Intel Advisor , . API, .
, , , , . – , , , , . , , , .
, . Parallel Advisor . .
.
, . (

principal Intel Parallel Advisor

loop2 Intel Parallel Advisor
, OpenMP ( CPU Count 4) Intel Parallel Advisor 2.47 «principal» 2.5 «loop2». , , , , .
, , , , Intel Xeon E5-2698 V3 (2.3 , 40 -).
100x20x100 200x40x200 , , . Intel Parallel Advisor, , 32- . .
, 47 . , . .
(100x20x100) , 25. . , , 32- , 25. 32- – , .

, 100x20x100
: 1 25 , 26 32, 33 47. , , . – Intel Hyper-Threading. – NUMA- .
NUMA (Non Uniform Memory Access) SMP, , - , .
NUMA . NUMA- , , SMP. , .
, , , , , , , , , . , NUMA-, , , .

NUMA
, , , . , NUMA-.
, Intel Hyper-Threading.

Intel Hyper-Threading
, . , , , . , .

Intel Hyper-Threading
, , , , , .
, , , . « – , Intel HT. 64- Intel Xeon . Intel HT , №1 №2. , . HT, . HT 10 7».
10 7 1.5 .
(200x40x200). 1281 , 1000 ( 100x20x100), .
, 200x40x200
, , 16. , . 1 16 19 32- . .
, , , , , Intel Parallel Advisor, , : NUMA- Hyper-Threading.
, .

100x20x100
200x40x200
, . , , , , . , , , , .
, , , (Cr) c 0.125 0.0125. , 19 . 100x20x100 641 6410, 200x40x200 – 1281 12810. , , 10 , Cr 10 .
.

100x20x100, Cr = 0.0125
, , 34-. . , 4 HT, 9 . , : Hyper-Threading , , .
, , , . , , . 200x40x200, , , , 16. , ?
, , . – , , , , . – , Cr. , 100x20x100, . , , 403,16 , 36 – 14,22 , 28- .
, , , , . 6577,53 . 36 , 216,16 , , 30 .
, , . , , , , .

200x40x200, Cr = 0.0125
, , .
, , ( Cr) , , -, , – NUMA-. , , , Intel Xeon Phi.
. , , .
. , , , , . , , , , . , , , . , , , . , .
Intel, , . , 2.5 , 3 – .
, , , , . , , . , .
, , (OpenMP) , , 1.8 , , .
Intel Parallel Advisor , , , 32- , , , , 25 16 . Parallel Advisor , , NUMA- Hyper-Threading.
, . , . , , -, . NUMA- , , .
, , , . , . , .
Optimizations that affect the speed of calculations when using any number of threads are reduced to taking into account in the code the features of processor architectures, instruction sets, to finding the most rational ways of working with different types of memory. Assistance in such optimization can be provided, for example, by a top-down approach to performance research using low-level data on system events, which are converted to high-level indicators that are available for analysis and practical application.
')
Here we will consider a technique for optimizing computations related to modeling flows of multiphase liquids in porous media according to the method proposed in this paper. This is a numerical method for solving partial differential hyperbolic equations.
Simulation of flows of multiphase fluids in porous media
This task is used in many areas. For example, in the field of oil and gas, industry, ecology.
We will consider the methods of vectorization of the code, tell you about the transition from serial to parallel execution, we will conduct a series of experiments. The experiments were conducted on Intel platforms, various software tools were used to analyze and optimize the application, in particular, Intel VTune Amplifier.
The material consists of three main sections:
- In the first we will talk about the automatic vectorization of the code and conduct experiments on a system with an Intel Core i5-4350U processor in single-threaded mode.
- The second section is devoted to comparing single-threaded and two-threaded execution of the application. Here we will compare the speed of the different versions of the program on the processor Intel Core i7-5500U.
- The third section is devoted to the preparation of applications for execution in a multi-threaded environment. It includes a story about analyzing and optimizing the application using the Intel Parallel Advisor. We will test the code on the compute cluster node with 4 Intel Xeon E5-2698 v3.
Analysis and automatic code vectorization
▍ Test platform and Intel AVX2 instruction set
Here, as a hardware platform for experiments, the system is used on Ubuntu 14.04 with an installed Intel Core i5-4350U processor (1.4 GHz, 2 cores, 4 threads) with 3 MB of cache and 4 GB of RAM. Our experimental environment is built on a processor belonging to the Intel Haswell family, which is fully supported by the Intel AVX2 instruction set. Using the capabilities of this set of instructions, in particular, improved support for vectorization, improves the performance of applications designed for a wide range of platforms, including server solutions based on Intel Xeon and Intel Xeon Phi.
When developing for the Intel AVX2, the same programming model was used that was used in the previous version, Intel AVX, however, the new instructions extend what it was by offering most 128-bit integer SIMD instructions with the ability to handle 256-bit numbers. The vectorization of the code allows to reveal the potential of a single-threaded version of the program, which is extremely important before proceeding to the next step - parallel execution.
Intel Parallel Studio XE 2015 is used here to analyze performance and evaluate optimization quality.
▍About identifying optimization potential
In order to understand how to optimize the code, you need to analyze it and find the program blocks, the execution of which can be accelerated through vectorization and parallelization. In order to achieve this, you can use the tools of Intel, such as Intel VTune Amplifier and Intel Parallel Advisor. In this regard, the reports generated by the compiler are very useful.
Such tools allow you to analyze the source code of the application and executable files, giving hints about the directions of optimization. The main bottlenecks in the processor pipeline are mostly explored.
Modern microprocessors implement pipelining of instructions, and, along with this approach, they use other techniques, such as hardware flows, execution of commands with a change in their order, and parallelism at the instruction level. All this is done in order to make the most of the resources of the system.
The programmer who is engaged in code optimization is not an easy task. The main difficulty here is that he needs to use the hardware capabilities of the computer as efficiently as possible, and they are at the level of the microarchitecture of the computing system, which is located quite far from the level of abstraction provided by modern programming languages such as C, C ++ and Fortran.
Intel tools can help optimize code by analyzing the compilation and composition of the application, giving information about the timing of program execution to determine exactly how the hardware resources are used. Among these tools are compiler reports, Intel VTune, Intel Parallel Advisor. Here's how to organize work with them.
- Analysis of the compiler report . The compiler is able to generate a report from which you can find out which automatic optimizations were applied to the code, and which ones were not. Sometimes, for example, a certain cycle can be automatically vectorized, and sometimes this does not happen. At the same time, the compiler reports this in both cases, and this information is useful for the programmer, since they allow him to decide whether his intervention in the code is necessary or not.
- Analysis using Intel VTune Amplifier. This tool allows you to monitor how the application is executed on the pipeline, how it uses memory. In addition, using VTune Amplifier, you can find out how long each module takes to execute, and how effectively system resources are used. Intel VTune Amplifier creates a high-level scorecard with which you can analyze all this. Among such indicators, for example, the number of clock cycles required per instruction.
- Analysis using Intel Parallel Advisor. This tool can predict expected performance gains when switching to parallelism at the thread level. In addition, Parallel Advisor can help in preparing the code for parallel execution.
A programmer, by combining the data obtained using the above tools, can change the source code of the program and the compilation parameters in order to achieve optimization targets.
▍Automatic code vectorization
Modern compilers are able to vectorize executable code. In particular, for this, the optimization parameter is set to -
O2 or higher. You can disable automatic vectorization using the –no-vec compiler option. This can be useful for comparing the performance of different executable code variants.In a nutshell, vectorization is the transformation of a program, after which one instruction is able to perform some operations with several data sets. Consider as an example the processing of the cycle below.
for (i=0; i<=MAX; i++) { c[i] = b[i] + a[i]; } If this cycle has not been subjected to vectorization, the use of registers in its execution looks something like the one shown in the figure below.
Using registers when executing a loop that has not been subjected to vectorization
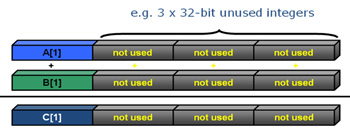
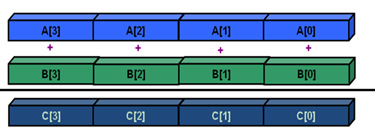
If the same cycle is vectorized, additional registers will be involved, as a result, it will be possible to perform four addition operations using one instruction. This is called “one command stream — many data streams” (Single Instruction Multiple Data, SIMD).
Execution of a vectorized cycle
Such an approach usually improves performance, since one instruction processes multiple data sets instead of one.
In the flow simulation application in porous media, the optimization of which we are engaged in, automatic vectorization allowed us to double the performance of the Haswell processor, which supports the Intel AVX2 instruction set.
The -
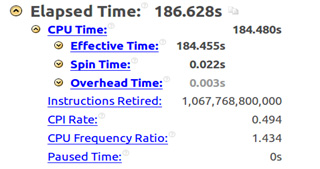
xHost instructs the compiler to generate executable code that is appropriate for the architecture of the system on which the compilation is being performed. In the case when such a system is a computer with a processor of the Haswell family, the use of this parameter guarantees the use of Intel AVX2 instructions.The figure below shows the summary report of the Intel VTune Amplifier program compiled without using the parameter -
xHost . Here, the execution time was 186.6 seconds, the number of clock cycles per instruction (Clocks per Instruction, CPI) is approximately 0.5, the number of instructions executed is 1.067.768.800.000.VTune Amplifier report, the -xHost parameter is not used
The main goal of optimization in this case is to reduce the code execution time and increase the CPI, which, ideally, should be 0.75, which means taking full advantage of the capabilities of the pipeline.
The figure below shows a list of application modules, sorted by effective computer time.
List of application modules
Note that the
vizinhanca function creates the maximum load on the system, using about 20% of the processor time. This function is occupied by step-by-step calculation of the parameters of porosity, permeability, velocity, flow in each element and in all its neighboring elements in the simulated medium.Note that the CPI is very bad for the function
fkt , which is busy calculating the flow parameters at a given time step. This function calls the vizinhanca function.Here is the source code snippet for the
visinhanca. function visinhanca. Here there is information about the time required for each line to be executed and an assembler code for the selected line, which is occupied by a linear reconstruction, is output. Note that the code does not include Intel AVX2 instructions.Fragment of the assembly code linear reconstruction
The following instructions can be seen in this code snippet: MULSD, MOVSDQ, SUB, IMUL, MOVSXD, MOVL, MOVQ, ADDQ. They are all from the Intel Streaming SIMD Extensions 2 (Intel SSE2) instruction set. These “old” instructions appeared with the release of the Intel Pentium 4 processor in November 2000.
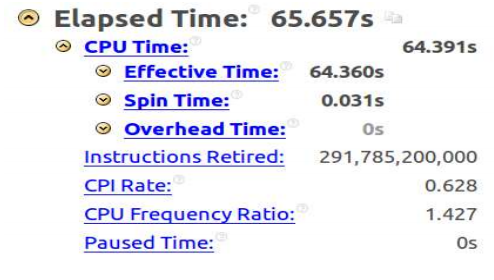
Having compiled the same code with the
–xHost parameter, which indicates to the compiler that it is necessary to generate executable code for the architecture of the system being used, and having analyzed its execution using the Intel VTune Amplifier, we obtained the following.VTune Amplifier report, the -xHost parameter is used
Namely, the code execution time is now 65.6 seconds, CPI is 0.62, which is much better than it was before and closer to the ideal value of 0.75.
In order to understand the reason for this increase in performance, you can look at the assembler code. There you will find instructions from the Intel AVX2 command set. In addition, comparing VTune Amplifier reports, you can see that when using Intel AVX2, the number of executed instructions is much less than in the case of using SSE2 in a non-vectorized version of the code.
This is due to the fact that the final data does not take into account the instructions whose execution was canceled, as they were in the branch where the code should not have been executed due to incorrect branch prediction. A smaller number of such errors also explains the improvement in the CPI parameter.
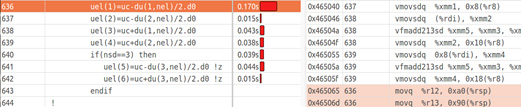
Here is the same fragment of the source code, which we considered above, but now its assembly representation is obtained after turning on the parameter -
xHost .Fragment of vectorized assembler linear reconstruction code
Please note that most of the instructions here are vector, from the Intel AVX2 kit, and not from SSE2. Vector instruction names begin with the prefix
VFor example, using a VMOV instruction instead of MOV indicates that we are dealing with vectorized code.
In the figure below you can see the register comparison for the Intel SSE2, AVX and AVX2 instruction sets.
Registers and instruction sets
An easy-to-use approach with the inclusion of automatic vectorization allows you to achieve a threefold increase in productivity.
▍ Find problem areas of the code
In the system with which we experiment, 4 threads can run on two physical cores. Now the only improvement in the code that has been made is the automatic vectorization performed by the compiler. We are still far from a program that is able to work at the limit of the system capabilities, the code can still be optimized. In order to continue improving the code, you need to identify its bottlenecks. For example, in the original version of our application there are many lines where division is used.
The
–no-prec-div option indicates to the compiler that the division operations should be replaced with multiplication operations with inverse values. We will use this opportunity during the optimization of our application.Here is a fragment of the source code where the division operation is often used. This code is located inside the
udd_rt function, which, according to the previous analysis, is one of the bottlenecks.Many division operations in an important section of code
However, the
–no-prec-div option has one problem. Sometimes, after this optimization, the values obtained are not as accurate as when using the usual IEEE division. If accuracy is important for an application, use this option to disable optimization, which will lead to more accurate results with some performance drop.Here is another important issue that can be solved with Intel tools. In our case, it lies in the fact that many application modules are written in Fortran, which complicates their optimization. In order for interprocedural optimization to be performed when preparing the code for execution, the
–ipo option is –ipo , which indicates to the compiler and linker that such optimization should be carried out. In this case, some of the actions to optimize the code are made at the layout stage.Using the
–ipo , –xHost and –no-prec-div options, the total program execution time decreased even more, to 53.5 seconds.The result of using the options –ipo, -xHost and –no-prec-div
In order to better understand the contribution to the performance of the program, which makes use of the
–no-prec-div option, a test was conducted with this option disabled. As a result, the execution time increased to 84.324 seconds. This means that this option gives about a 1.5-fold increase in performance.Another test, this time with the
–ipo option –ipo , showed that the execution time increased to 69.003 seconds. This suggests that this option gives about a 1.3-fold increase in performance.▍Use Intel VTune Amplifier General Exploration to identify processor and memory limitations
Intel VTune Amplifier can not only report on the time spent on program execution, on the CPI, and on how many instructions have been executed. Using his General Exploration profile, you can get information about the behavior of the program inside the processor pipeline and find out whether it is possible to improve performance, given the limitations of the processor and memory.
Restrictions of the computational core (Core Bounds) relate to problems that are not related to the transfer of data in memory and affect performance when executing instructions with a change in their order or when the operating units are overloaded. Memory bounds can cause inefficient pipeline operation due to the need to wait for the load / save instructions to complete. Together, these two parameters define what is called Back-End Bounds, this indicator can be interpreted as constraints arising inside the pipeline.
If pipeline downtime is caused by empty slots, that is, by the fact that microcommands do not have time to enter it for any reason, and part of the pipeline does not perform useful work only because it has nothing to process, we already have the so-called Front-End Bounds - external to the pipeline restrictions.
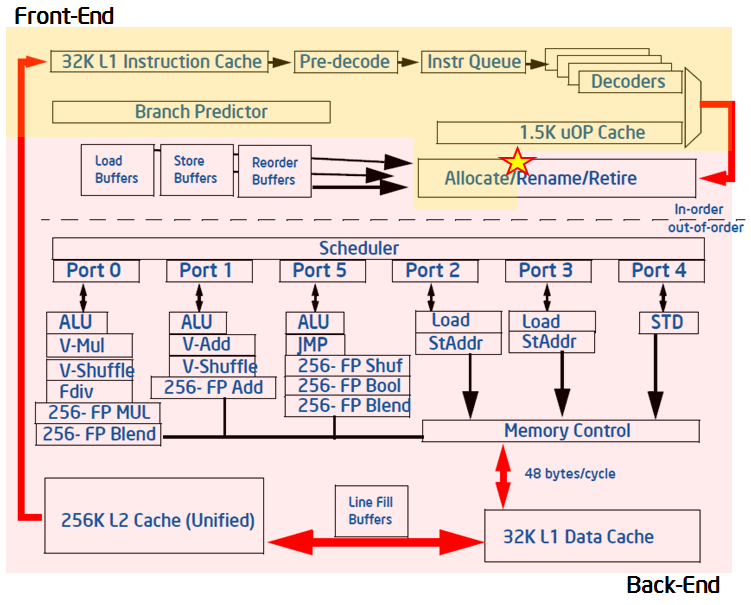
Here is a diagram of a typical modern pipeline that supports code execution with a change in the sequence of commands.
Intel processor pipeline that supports the execution of instructions with a change in their order
Internal structures, back-end pipelines, are ports for delivering instructions to the ALU, to the load and store blocks. Unbalanced use of these ports usually has a bad effect on performance, since some units can either be idle or not be used as evenly as others that are overloaded.
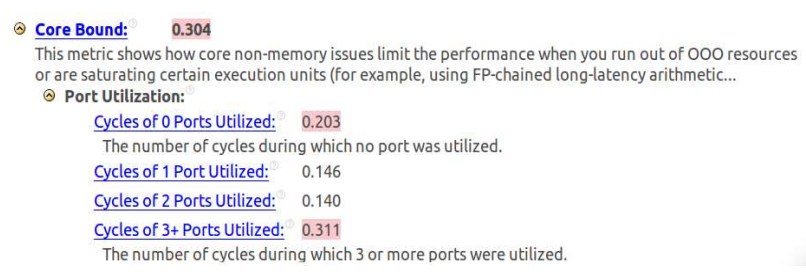
For the application that we are reviewing here, the analysis has shown that even when using automatic vectorization performed by the compiler, there are problems with the execution of the code. Namely - the high value of Core Bound due to the unbalanced distribution of instructions on the ports.
Limitations of the compute core
The analysis results shown in the figure above indicate a high level of clock cycles (0.203, or 20.3%), in which no ports are involved. This indicates inefficient use of processor resources. In addition, a high level of cycles (0.311, or 31.1%) is noticeable when three or more ports are involved. This situation leads to overload. Obviously, we have an unbalanced use of resources.
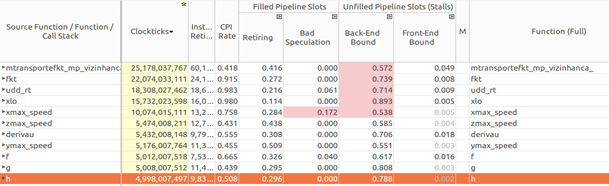
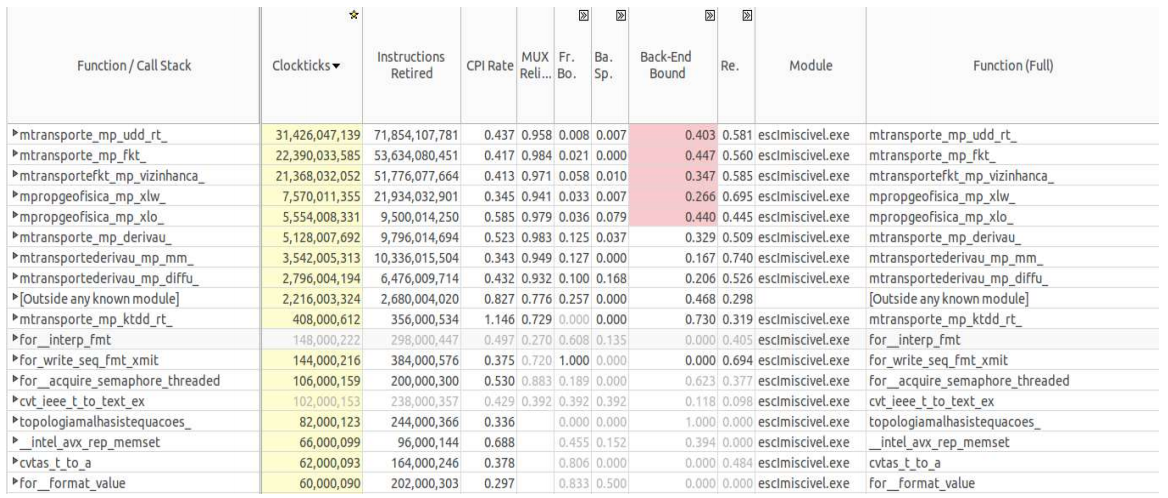
The results of the situation analysis, performed in the Intel VTune Amplifier and shown in the figure below, reveal the causes of the problems described above. In this case, there are four functions (
fkt , udd_rt , xlo , and xmax_speed ), which have a high Back-End Bound. In addition, the xmax_speed function xmax_speed characterized by a too high level of incorrect predictions (Bad Speculation). All is not well in the transport module.Back-End Bound and Bad Speculation Analysis
The next step in our research is to use the Intel VTune Amplifier as a tool for analyzing the problems identified. We are going to thoroughly examine each function noted above in order to find code points that are wasting CPU time.
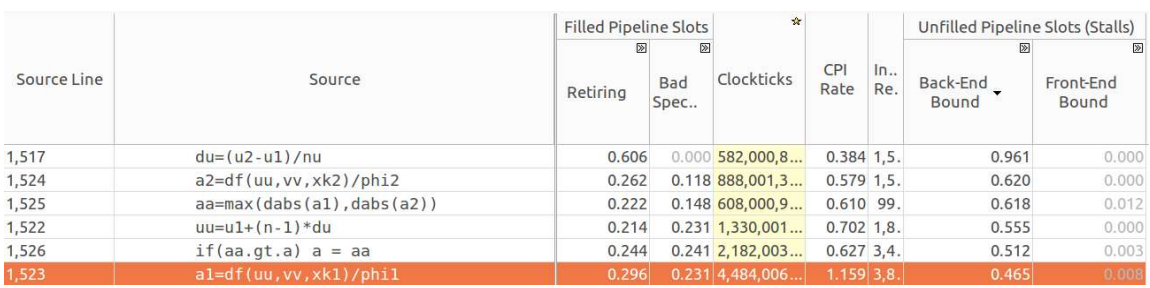
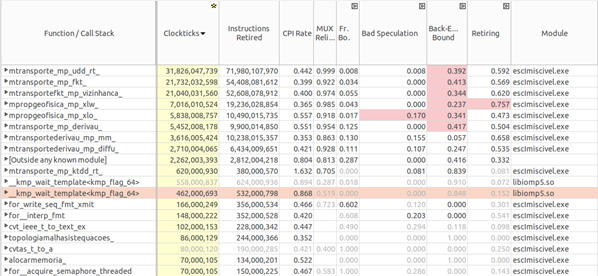
Analyzing each function that has a high rate in the column Back-End Bound, you can find out exactly where problems arise. In the several figures below, you can see that the Intel VTune Amplifier shows the source code and the corresponding metrics for each row. Among them are successfully completed instructions (Retiring), prediction errors (Bad Speculation), measures (Clockticks), CPI, restrictions within the pipeline (Back-End Bound). In general, the high value of the Clockticks index indicates the responsible lines of code, and VTune highlights the corresponding values.
Here is an analysis of the
transport function, featuring a high Back End Bound.Analysis of the reasons for the high value of the Back-End Bound in the transport function
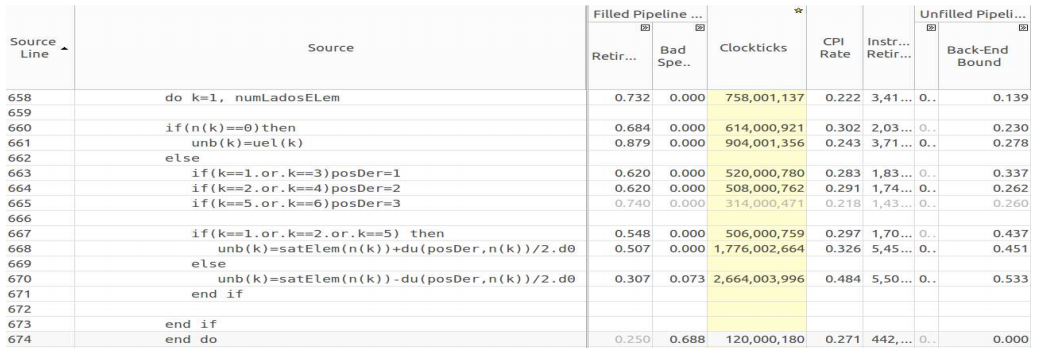
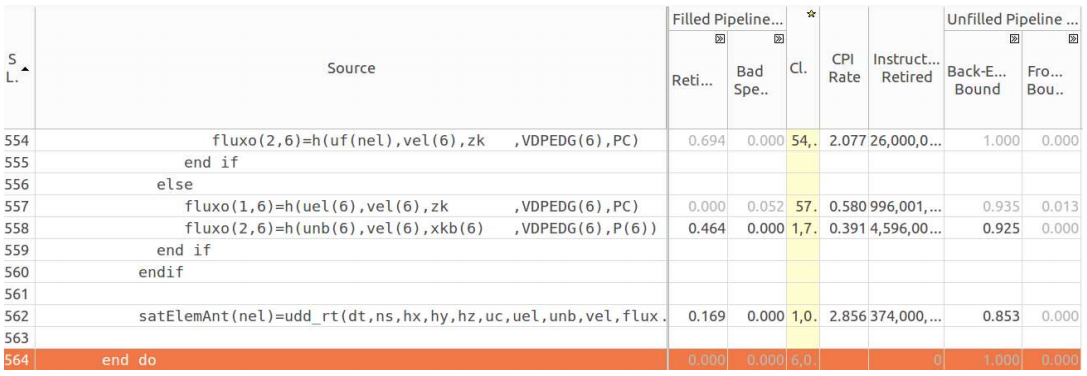
The function
fkt can also be classified as responsible. It calls the functions g and h to compute the flow and the function udd_rt to calculate the saturation of the initial grid element. Analytical data on this function is shown in the figure below.Fkt function analysis
Here is the code for the functions
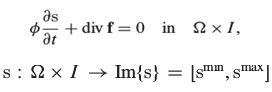
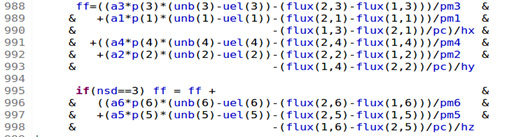
g and h that fkt . function g(uu,vv,xk,VDISPY,POROSITY) ! ! f ! use mPropGeoFisica, only: xlw,xlo,xlt,gf2,rhoo,rhow implicit none real(8) :: g,uu,vv,xk REAL(8) :: VDISPY,POROSITY real(8) :: fw real(8) :: xlwu,xlou real(8) :: xemp,xg xlwu=xlw(uu) xlou=xlo(uu) fw=xlwu/(xlwu+xlou) xg = gf2 xemp=fw*xg*xlou*xk*(rhoo-rhow) g=fw*vv-xemp end function function h(uu,vv,xk,VDISPZ,POROSITY) ! ! f ! use mPropGeoFisica, only: xlw,xlo,xlt,gf3,rhoo,rhow implicit none real(8) :: h,uu,vv,xk REAL(8) :: VDISPZ,POROSITY real(8) :: fw real(8) :: xlwu,xlou real(8) :: xemp,xg xlwu=xlw(uu) xlou=xlo(uu) fw=xlwu/(xlwu+xlou) xg = gf3 xemp=fw*xg*xlou*xk*(rhoo-rhow) h=fw*vv-xemp end function Here it is important to pay attention to the fact that here we are talking about the two-dimensional components of the vector
F , which represents the flow of the conserved value s in accordance with the following expression.The
xlo function, which finds overall mobility in accordance with the mobility of water and oil, also has a high Back-End Bound. Here is her analysis.Xlo function
Here is an analysis of the
xmax_speed function, which calculates the maximum speed in the x direction. This feature also makes a significant contribution to the overall level of the Back-End Bound.Xmax_speed function
Intel VTune Amplifier uses the data on the functions we analyzed above to find the final Back-End Bound score.
As already mentioned, the reason for such restrictions may be inefficient use of the processor or memory. Since automatic vectorization has already been applied to our code, it is very likely that the cause of the situation is in memory. Further analysis, namely, consideration of the Memory Bound metric, the data on which is given below, suggests that the program uses the first-level cache inefficiently (L1 Bound metric).
Memory Bound
Since the application has a large number of data structures, such as vectors, required in a variety of different functions, they need to be carefully examined in order to find approaches to improving performance by reducing memory latency. In addition, you should pay attention to the alignment of the data in order to help vectorize the code.
▍Application of compiler reports to find additional ways to optimize
In order to discover more possibilities of code optimization by means of vectorization, you should use the compiler reports, as you can find information about cycles that can be vectorized. The
MTRANSPORT module became the central object of analysis, since it concentrates a significant amount of computation.Some external loops are not vectorized due to the fact that the corresponding inner loops are already vectorized due to the automatic vectorization technique described above. In this situation, the compiler gives the following message:
remark #####: loop was not vectorized: inner loop was already vectorized In some cases, the compiler instructs the developer to use the SIMD directive to cycle the vector, but when this is done, the cycle still does not vectorize due to the fact that the assignment to a scalar variable is performed in it:
!DIR$ SIMD do n=1,nstep+1 ss=smin+(n-1)*ds Here is the corresponding compiler message:
LOOP BEGIN at ./fontes/transporte.F90(143,7) remark #15336: simd loop was not vectorized: conditional assignment to a scalar [ ./fontes/transporte.F90(166,23) ] remark #13379: loop was not vectorized with "simd" Most of the cycles were automatically vectorized by the compiler, and in some cases the potential performance increase estimated by the compiler ranged from 1.4 (most cycles) to 6.5 (this figure was obtained only for one cycle).
When the compiler detects that after vectorization, performance drops (that is, the performance increase is less than 1.0), it does not conduct vectorization. Here is one example of a compiler message in a similar situation.
LOOP BEGIN at ./fontes/transporte.F90(476,7) remark #15335: loop was not vectorized: vectorization possible but seems inefficient. Use vector always directive or -vec-threshold0 to override remark #15451: unmasked unaligned unit stride stores: 1 remark #15475: --- begin vector loop cost summary --- remark #15476: scalar loop cost: 3 remark #15477: vector loop cost: 3.000 remark #15478: estimated potential speedup: 0.660 remark #15479: lightweight vector operations: 2 remark #15481: heavy-overhead vector operations: 1 remark #15488: --- end vector loop cost summary --- LOOP END In reality, the performance after automatic vectorization has increased about three times, in accordance with the average value estimated by the compiler.
Analysis of the reasons why the compiler does not vectorize certain cycles should be carried out before using other optimization methods.
▍Experiments with different mesh sizes
All tests that were carried out up to the present moment were carried out as applied to solving a problem, the space of which is a grid of 100x20x100 in size, and 641 computation steps are carried out using a single computational flow.
Here we take a look at working with grids of other sizes in order to compare the overall performance gains obtained through automatic vectorization. Here is a comparison.
| Grid | Execution time without vectorization | Execution time with vectorization | Productivity growth | Number of steps |
| 100 × 20 × 100 | 186,628 | 53,590 | 3.4 | 641 |
| 50 × 10 × 50 | 17,789 | 5.277 | 3.4 | 321 |
| 25 × 5 × 25 | 0.773 | 0,308 | 2.5 | 161 |
| 10 × 2 × 10 | 0.039 | 0,0156 | 2.5 | 65 |
These tests showed that the larger the mesh, the greater the productivity growth achieved due to automatic vectorization. , , , .
, .
▍
, , , , , , , . . Intel VTune Amplifier.
, , , , . Ubuntu 14.04.3 LTS, Intel Core i7-5500U (2.4 , 4 -) HT ( ). Intel Broadwell, Intel AVX2. 7.7 .
Broadwell 14- , Haswell. «-» («tick-tock»), Intel, «», , , , .
▍
Intel VTune XE 2016. ,
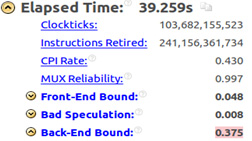
–ipo , –xHost –no-prec-div . , .641 100x20x100, 39.259 , Haswell 1.4 . Intel VTune Amplifier.
Intel VTune Amplifier
, , , 1.7 , , . , 1.4, .
, Back-End Bound 0.375. , , .
Back-End Bound.
Intel VTune Amplifier
, Back-End Bound ( Core Bound), – (Divider). , , Port Utilization. , ALU. Core Bound – . , , . , , , , , . , , , .
, , . , .
Back-End Bound, , , , . .
Intel VTune Amplifier
, , - - .
▍
OpenMP.
, Hyper-Threading, , , .
Intel VTune .
Intel VTune
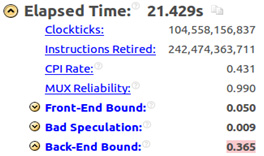
, , , OMP_NUM_THREADS 2. 1.8 , Back-End Bound , .
. , , , , Bad Speculation
xlo Retiring xlw .Intel VTune Amplifier
Bad Speculation , - . . -, , . -, - .
, , . , . CPI Rate
xlw , ., , .
«O» , , , : , , . , - – , , . - , . xl, xln, xlc, xr, xrn, xrc, yun, yu, yuc, ydc, yd ydn – , , , , OpenMP.
, , , , . .
| Grid | , | , | ||
| 100×20×100 | 39.259 | 21.429 | 1.83 | 641 |
| 50×10×50 | 2.493 | 1.426 | 1.74 | 321 |
| 25×5×25 | 0.185 | 0.112 | 1.65 | 161 |
| 10×2×10 | 0.014 | 0.015 | 0.94 | 65 |
. , , 10x2x10, . , , , . , , OpenMP, , .
Intel VTune Amplifier, .
Intel VTune, 1
– , .
Intel VTune, 2
, Front-End Bound , Back-End Bound – . , – .
▍ Intel Parallel Advisor
Intel Parallel Advisor – , . , .
Intel Parallel Advisor :
- .
- .
- .
- .
, . , ,
transport , . , , , .Intel Parallel Advisor
Intel Parallel Advisor , , , ( ), (Intel AVX, AVX2, SSE ). , , . , , , .
ktdd_rt , transport , 98% , ., , , . , Intel Advisor , . API, .
, , , , . – , , , , . , , , .
, . Parallel Advisor . .
- (parallel site) , . .
- (parallel task) . , , , . . , .
- (locking synchronization) , .
.
call annotate_site_begin("principal") call annotate_iteration_task("maxder") call maxder(numLadosELem,ndofV,numelReserv,vxmax,vymax,vzmax,vmax,phi,permkx,v) call annotate_site_end call annotate_site_begin("loop2") do nel=1,numel call annotate_iteration_task("loop_nelem") […] end do call annotate_site_end maxder . – , ., . (
principal ) . , ( 32-) . , .principal Intel Parallel Advisor
loop2 , 64- .loop2 Intel Parallel Advisor
, OpenMP ( CPU Count 4) Intel Parallel Advisor 2.47 «principal» 2.5 «loop2». , , , , .
▍
, , , , Intel Xeon E5-2698 V3 (2.3 , 40 -).
▍
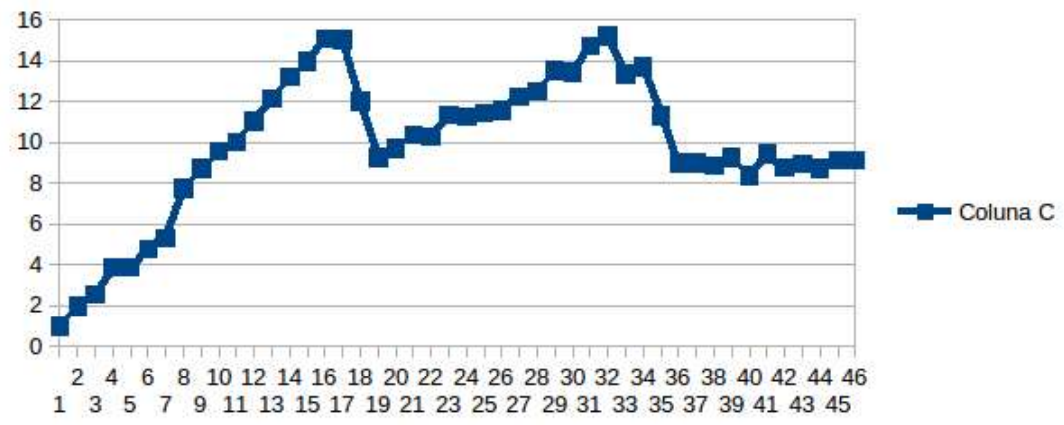
100x20x100 200x40x200 , , . Intel Parallel Advisor, , 32- . .
, 47 . , . .
(100x20x100) , 25. . , , 32- , 25. 32- – , .
, 100x20x100
: 1 25 , 26 32, 33 47. , , . – Intel Hyper-Threading. – NUMA- .
NUMA (Non Uniform Memory Access) SMP, , - , .
NUMA . NUMA- , , SMP. , .
, , , , , , , , , . , NUMA-, , , .
NUMA
, , , . , NUMA-.
, Intel Hyper-Threading.
Intel Hyper-Threading
, . , , , . , .
Intel Hyper-Threading
, , , , , .
, , , . « – , Intel HT. 64- Intel Xeon . Intel HT , №1 №2. , . HT, . HT 10 7».
10 7 1.5 .
(200x40x200). 1281 , 1000 ( 100x20x100), .
, 200x40x200
, , 16. , . 1 16 19 32- . .
, , , , , Intel Parallel Advisor, , : NUMA- Hyper-Threading.
, .
100x20x100
200x40x200
, . , , , , . , , , , .
, , , (Cr) c 0.125 0.0125. , 19 . 100x20x100 641 6410, 200x40x200 – 1281 12810. , , 10 , Cr 10 .
.
100x20x100, Cr = 0.0125
, , 34-. . , 4 HT, 9 . , : Hyper-Threading , , .
, , , . , , . 200x40x200, , , , 16. , ?
, , . – , , , , . – , Cr. , 100x20x100, . , , 403,16 , 36 – 14,22 , 28- .
, , , , . 6577,53 . 36 , 216,16 , , 30 .
, , . , , , , .
200x40x200, Cr = 0.0125
, , .
| 100×20×100 | 200×40×200 | |
| Cr = 0.125 | ||
| Cr = 0.0125 |
, , ( Cr) , , -, , – NUMA-. , , , Intel Xeon Phi.
Results
. , , .
. , , , , . , , , , . , , , . , , , . , .
Intel, , . , 2.5 , 3 – .
, , , , . , , . , .
, , (OpenMP) , , 1.8 , , .
Intel Parallel Advisor , , , 32- , , , , 25 16 . Parallel Advisor , , NUMA- Hyper-Threading.
, . , . , , -, . NUMA- , , .
, , , . , . , .
Source: https://habr.com/ru/post/310842/
All Articles