Code Evolution Visualization
From the translator:
I came across this interesting author, Adam Thornhill, while searching for a video from the GOTO conference. To whom this article seems interesting, I advise you to watch his presentation . I got a little confused with the translation (thanks to Tanya for the help!), Because the topic seemed very peculiar, I haven’t seen any similar works before (I will be glad to see links in the comments!). The article is fresh, August 2016, in the original called Software ®Evolution - Part 1 . The text is narrative from the first person, but it means the author of the original article.
How code evolution makes it possible to understand large code bases
Usually bad code is for long. It does not just remain in a specific file, but still remains there for a year, reliving its creators (within the organization) and displeasing the next generation of programmers responsible for support. Changes in this code are risky. Given the scale of the current code bases, we need more efficient tools to identify such parts of the system, so that we can make a correction, make additional efforts in testing, or perform a code review. In this article, we use data on previous behavior in the field of development in order to get guidance on these solutions.
Scale challenges
Current software systems consist of hundreds of thousands or even millions of lines of code. The scale of such systems makes them almost impossible to comprehend. There are few people in the world who can hold millions of lines of code in their heads.
A typical system consists of several technological stacks and complex subsystems.
Also, today's systems are built on several different technologies. As an example, consider the classic three-layer architecture, which uses JS on the frontend, Java or Net services, and SQL query language to access the database. Even if this technical diversity is not in itself difficult enough, we must remember that large systems are implemented by developers from different teams. Each programmer individually sees a small piece of code base. This means that each programmer in his own way represents the system, and no one has a complete picture in his head.
If we want to understand and improve a large code base, our main task is to solve these technical and organizational challenges. As a result, the solution must meet the requirements:
- Contain collective knowledge of all participating programmers for an inventory of all parts of the code base to access them later.
- Represent a language-independent approach to operating polyglot code bases.
- To prioritize among the millions of lines of code those parts of the code that are particularly important in terms of productivity and risks.
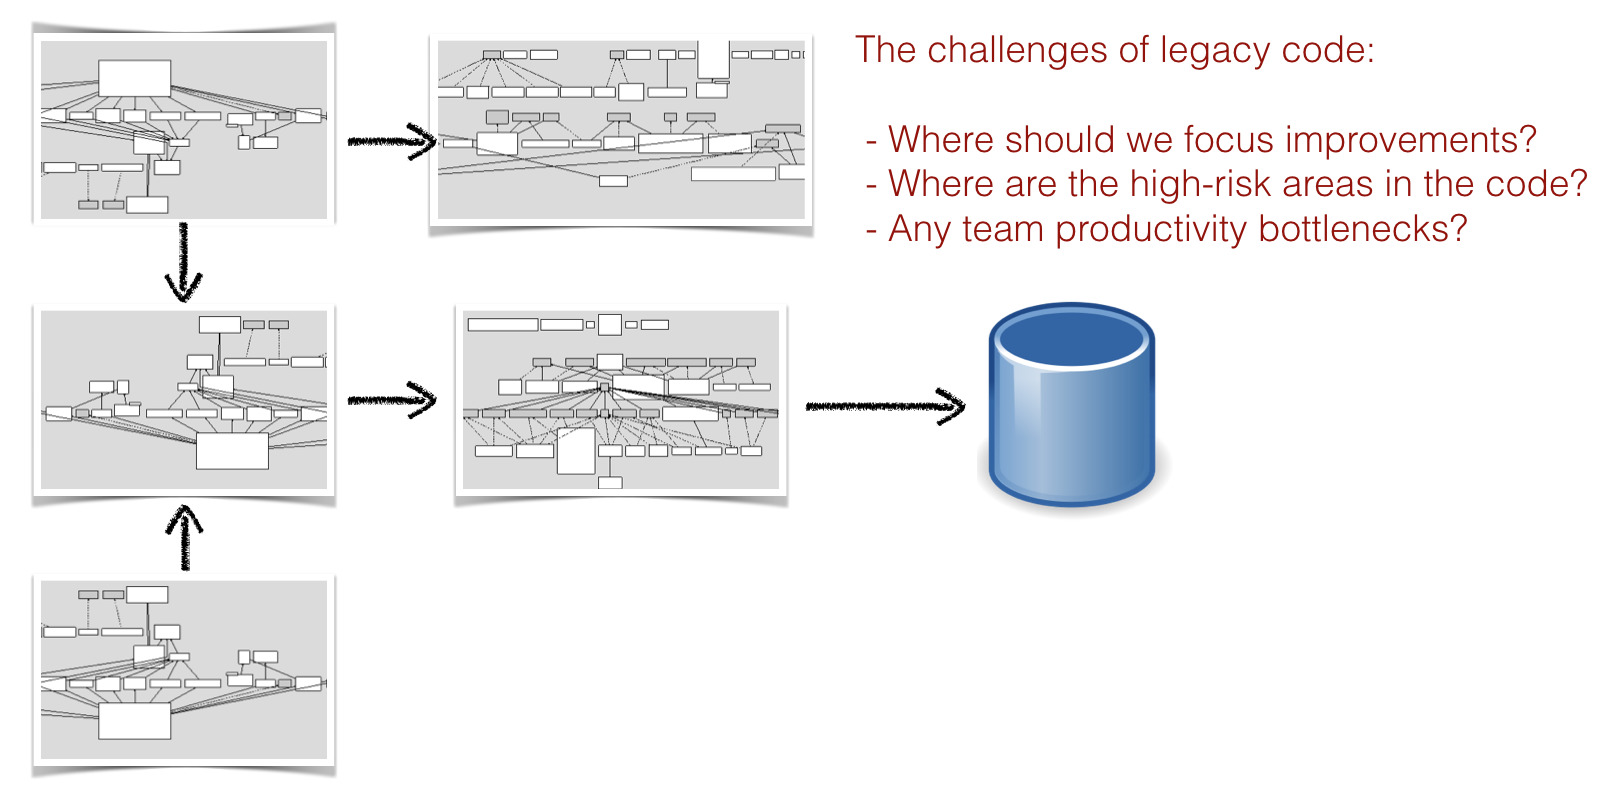
Unfortunately, reports such as those issued by CHAOS make it obvious that most of the projects fail to meet the deadlines or budgets, and this is a weak point of the organizations. I think there is a simple explanation for the continuous failures in our industry. It is so difficult to prioritize improvements, because most of the time we rely in our decisions on evaluating the system to its current state, i.e. on her code. However, I believe that this is incomplete information. Namely, there are two key aspects that we are missing:
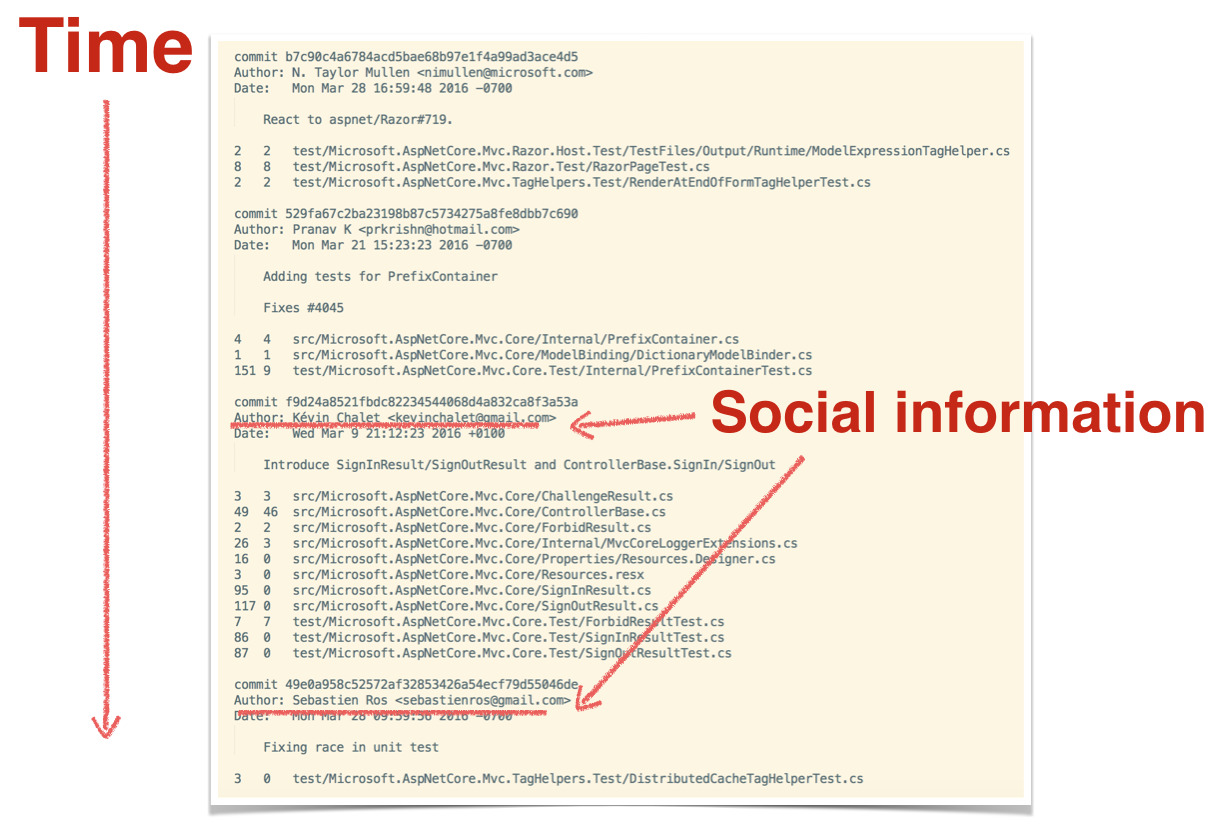
Time. Based only on the code itself, we cannot see how the system is developing, and we cannot predict long-term trends. As part of the development, there is no way to separate the stable code from the code that we have to keep changing. As we will see, the temporal dimension is key to our ability to prioritize improvements in code.
- Social information. The code alone alone cannot indicate whether a particular module is a performance bottleneck, requiring the coordinated efforts of several programmers. Since communication and the need for coordination are driving forces in the costs of the software industry; we need a social component to make informed decisions about the system. And it may be surprising, but this social component is beyond management and is also important for our ability to make sensible technical decisions.
Let's see how you can use the evolution of the software itself to help.
Use version control systems as behavior data.
Data analysis is popular, and ubiquitous machine learning has taught us how to look for patterns in complex phenomena. It seems to me extremely exciting that we only recently began to apply these techniques to ourselves. It is necessary to close this gap, so the whole series of articles will be devoted to this. Let's discover what happens when we begin to study the patterns of our own behavior (ie, programmers) in order to better understand how our systems grow.
The best thing about this approach is that almost all software organizations already have all the data in their version control systems. We just are not accustomed to thinking about them in this way. Version control systems are simply a behavior log describing how the developer interacts with the code. Version control data not only contains information about when and where changes were made, but also contains social information in the form of a record about the author of the changes. Let's turn to the data from version control.
Towards an evolutionary understanding of software
As a daily work at Empear, I analyzed hundreds of different code bases. There are some patterns that I meet again and again, regardless of programming language and technology. Uncovering these patterns will help us understand the large code bases.
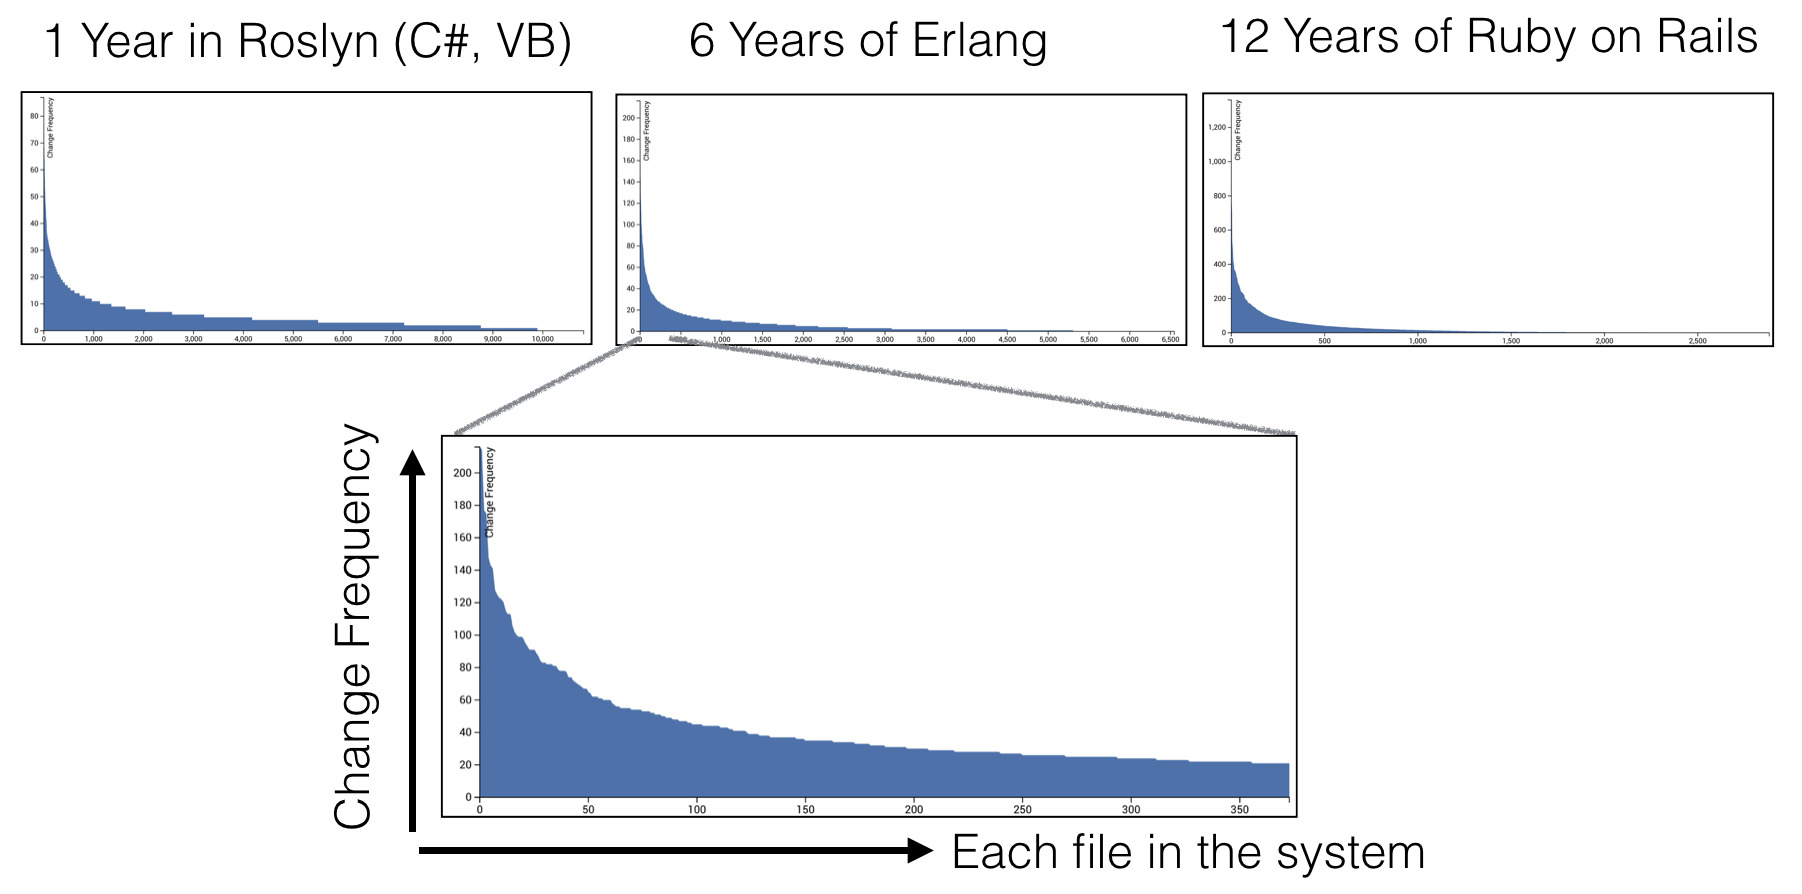
Take a look at three graphics: they all show the same thing. The X axis shows the files in the system, sorted by the frequency of changes (the number of commits taken from version control data). The y-axis shows the number of commits for each file.
The graphs show data from three completely different systems with different subject areas, the code bases themselves of different sizes, developed in different companies and with different lifespans. But all the graphs show the same geometric distribution.
These distributions say that most of our development activities are concentrated in relatively small parts of the common code base. The vast majority of all files remain in the “tail” of the distribution, which means that they make up code that rarely or never changes.
The presence of such a distribution of code changes has several interesting implications. First of all, it gives us a tool to prioritize improvements and refactoring. Complex code refactoring is both risky and expensive. With the help of our understanding of how code develops, we can focus on those parts that are likely to pay back our work. These are the parts where we spend most of our development efforts, as illustrated below.
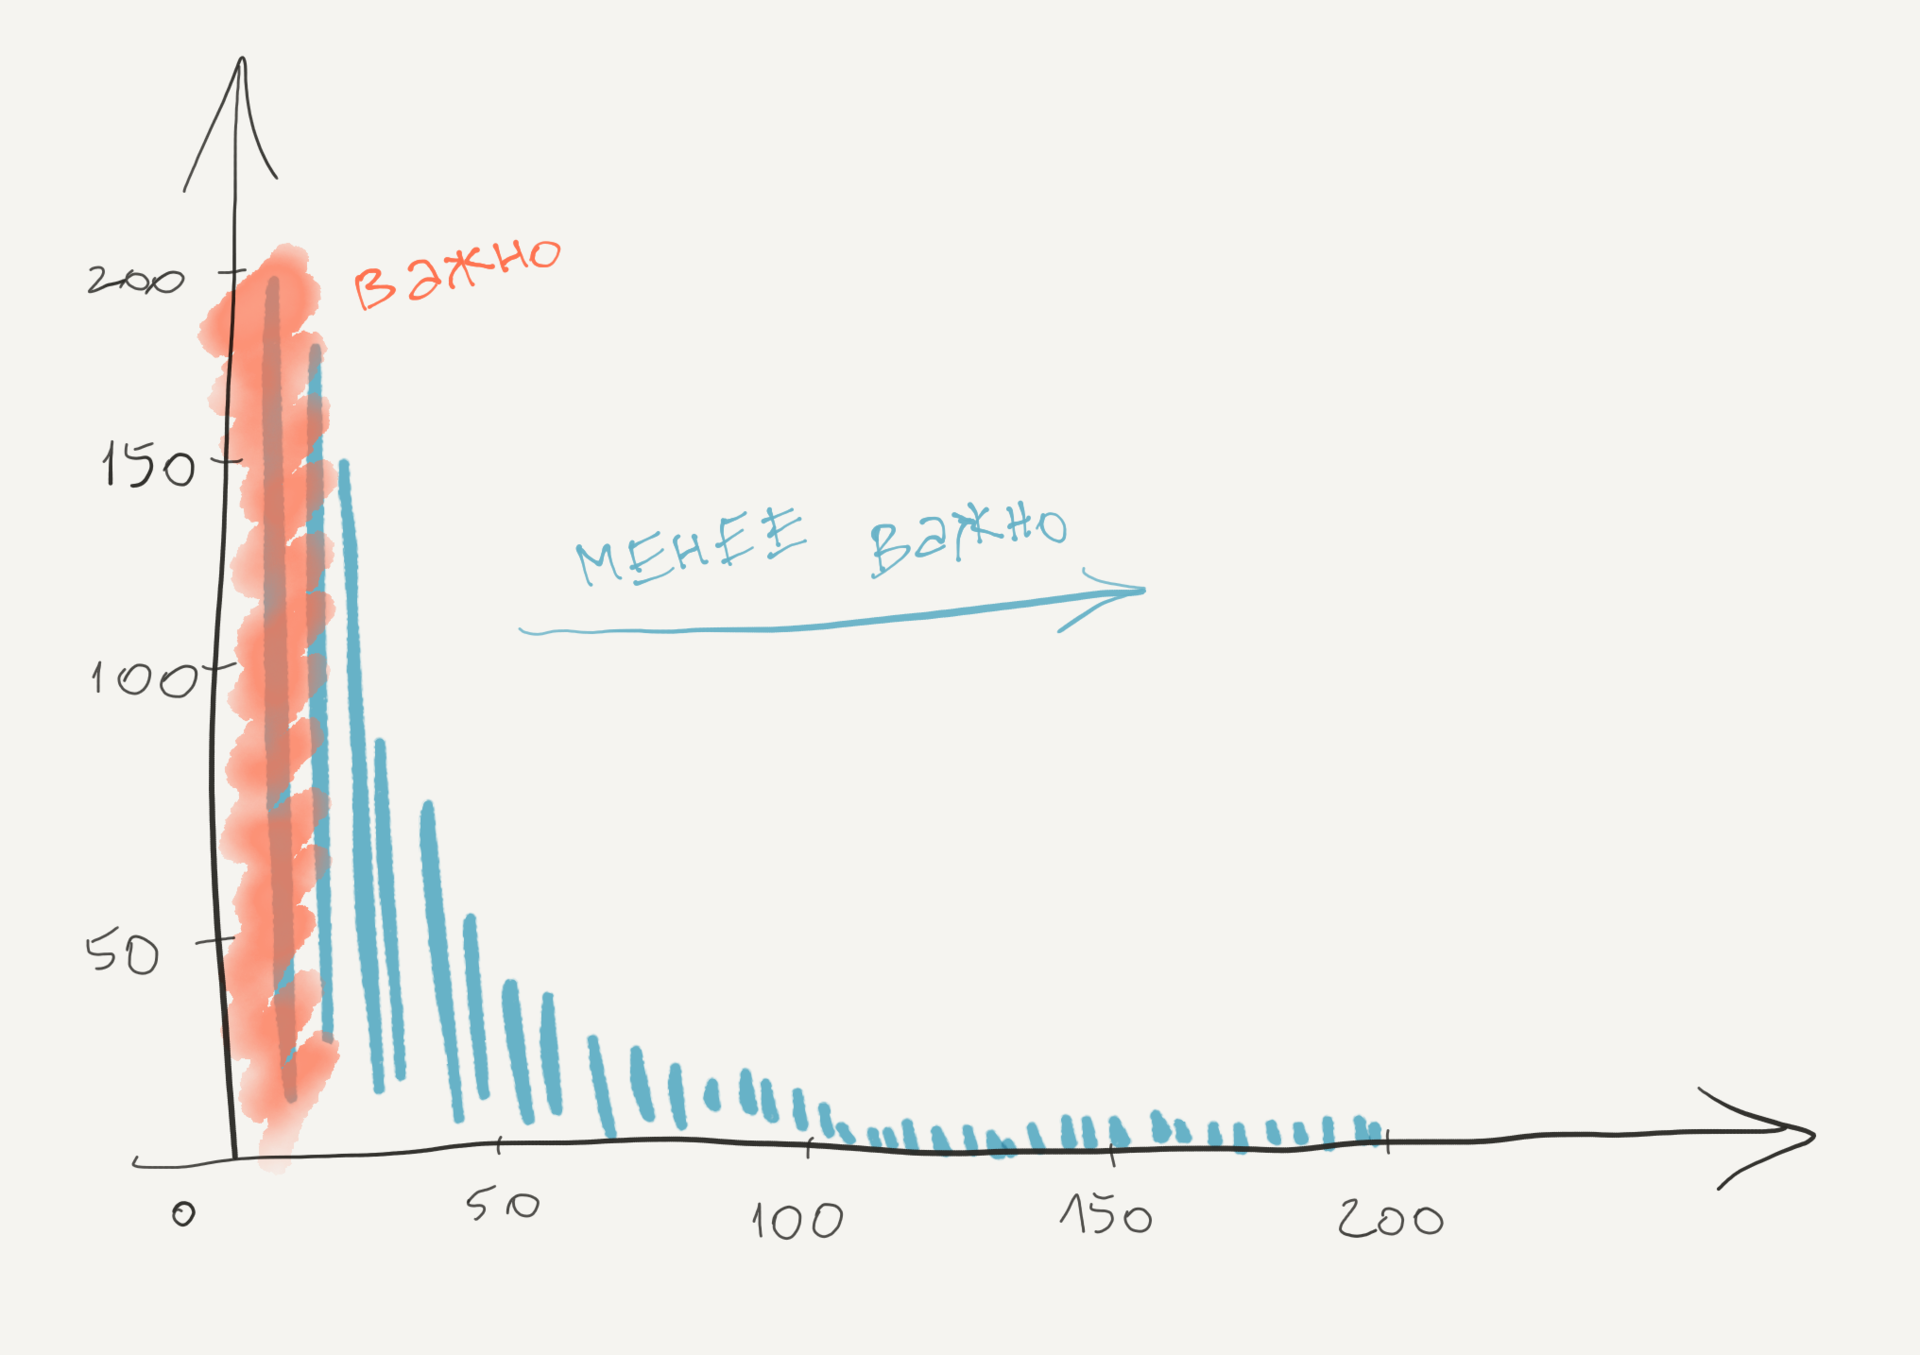
Any improvements we make to the files in the red zone are likely to lead to performance gains, since these are the files we work with all the time. It is also important to find files with a high frequency of change in terms of quality. The fact is that a high frequency of change correlates with recurring support problems. In fact, the importance of a change metric to a module is so high that, in a situation of predicting an error, more elaborate metrics rarely provide higher value.
However, despite these discoveries, our model still has a weak point. The bottom line is that the code is not the same. For example, there is a big difference between increasing the version number in a single-line file and correcting a bug in a file with 5000 lines in C ++ with sly nested condition logic. The first of the changes is low risk and for practical reasons can be ignored, while the second type of change needs special attention as part of the testing and verification of the code. Thus, we need to add a second dimension to our model — the complexity dimension, in order to improve its predictive power. Let's see how this is done.
Language Independent Metrics for Complexity
There have been several attempts to measure software complexity. The most famous approaches are McCabe cyclomatic complexity and Halstead complexity. The main disadvantage of these metrics is that they are tied to the language. Those. we need one metric for each programming language used in the system. This is contrary to our goal of providing a language-independent metric for obtaining a holistic vision of modern polyglot code bases.
Fortunately, there is a simpler metric that will fit perfectly: the number of lines of code. And yes, of course, the number of lines of code is a very rough metric, but nevertheless it has a good predictive power, along with thoughtful metrics of the type of cyclomatic complexity. The advantage of using lines of code is the simplicity of the metric: it does not depend on the language and, in addition, is intuitive. We will use the number of rows as a substitution for the complexity metric and will combine it with the measurement of the frequency of changes to indicate the Hot Points in our code base.
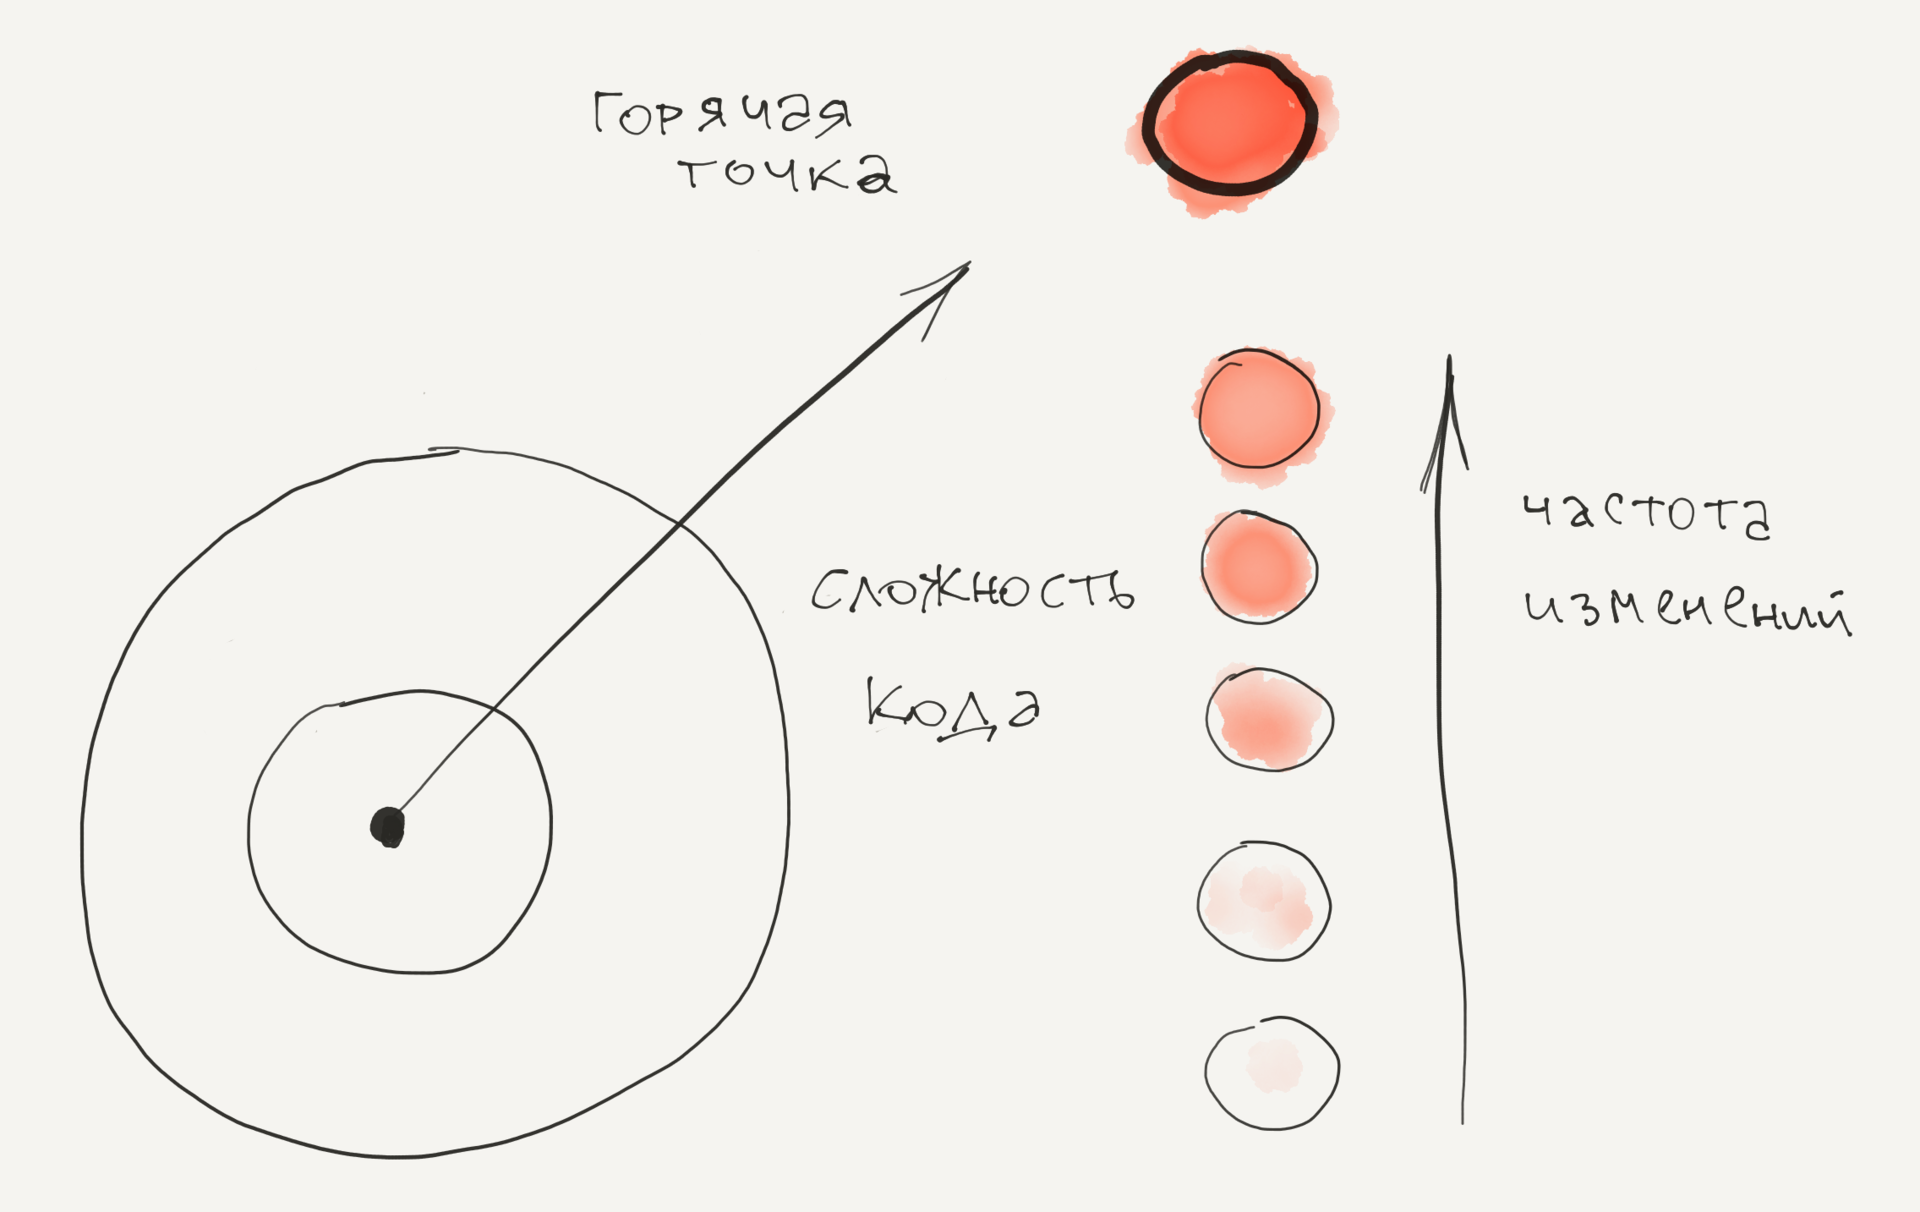
Determination of high risks of modifications using hot spots
Hotspot is a tricky code that you often work with. GTs are calculated from two different sources: 1) the number of lines of code as a simplified metric for complexity 2) the frequency of changes for each file, obtained from the version control history.
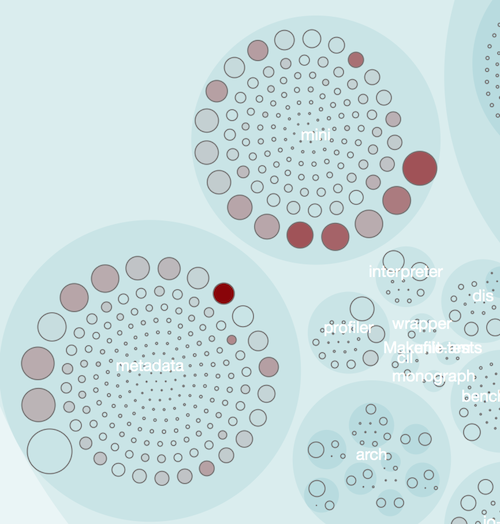
Empear's tool suite, Empear tool suite, for software analysis, provides GT analysis as an interactive map that allows you to examine the entire code base. In the visualization below, each file is represented as a circle.
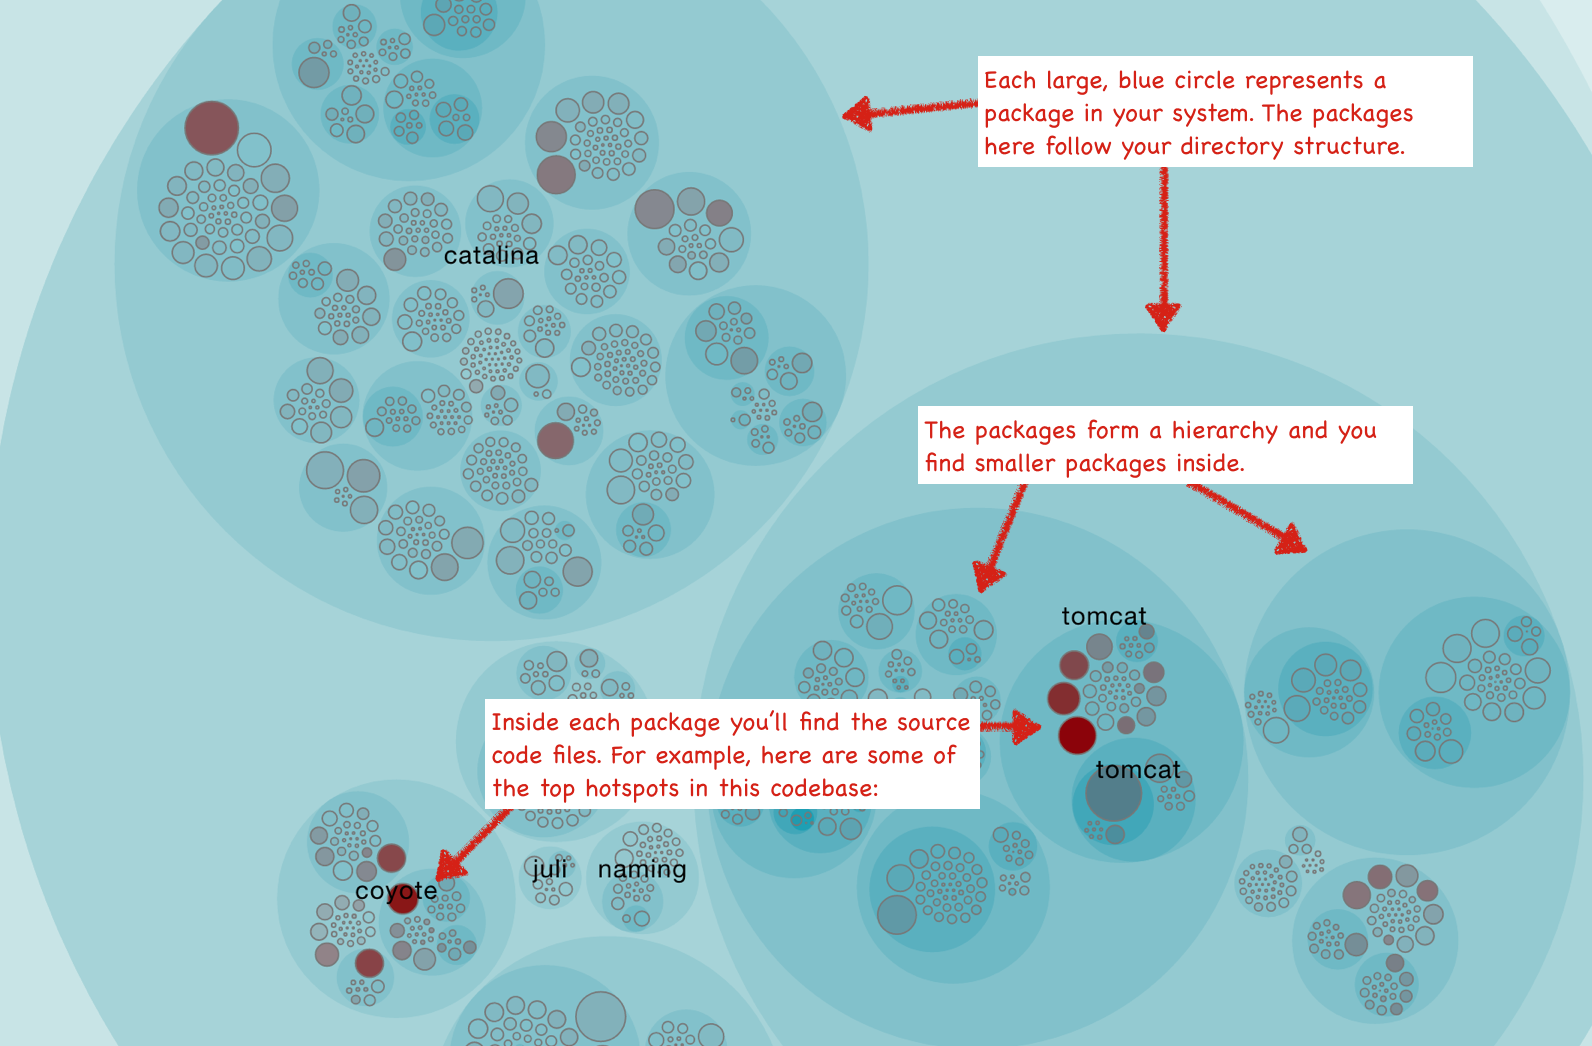
The GT card gives you the ability to view each GT in the context of the system. Visualization also makes it possible to identify GT clusters that indicate problem subsystems. Of course, the high frequency of changes is not limited to real GT. We explore these aspects later, first go through some use cases.
How to use hot spots
GT analysis has several use cases and serves many specialists.
Developers use them to identify support problems. Complicated code, which you often need to work with, does not bring happiness. The GTs provide information on where these pieces are located. Use this information to prioritize rework.
Those leads use GT to manage risk. Changes in GT or expansion of its functionality with new features carries a high risk. The GT analysis allows you to identify these sites in advance, so you can plan additional time or allocate additional resources for testing.
GTs indicate places in the code as candidates for review. The code review is great for getting rid of defects, but at the same time it is expensive and manual work, so we would like to be sure that the effort invested is well invested (apathy after the review code is the real thing). In this case, use the GT card to determine the candidates for the review.
- GT input point for research tests. The map is a great way for an experienced tester to identify parts of the code base that seem unstable with a lot of developer activity. Use this information to select an entry point and focus areas for research tests.
Dive deeper into complexity and machine learning trends
Once we have identified our priority GTs, we need to understand how they develop. Do we already know enough about GT in the sense of starting to improve the code and reduce future risks? Are they hot because they become more and more tangled over time, or is it more a situation of micro changes in stable code?
To answer these questions, we need to look at the trend over time, see below.
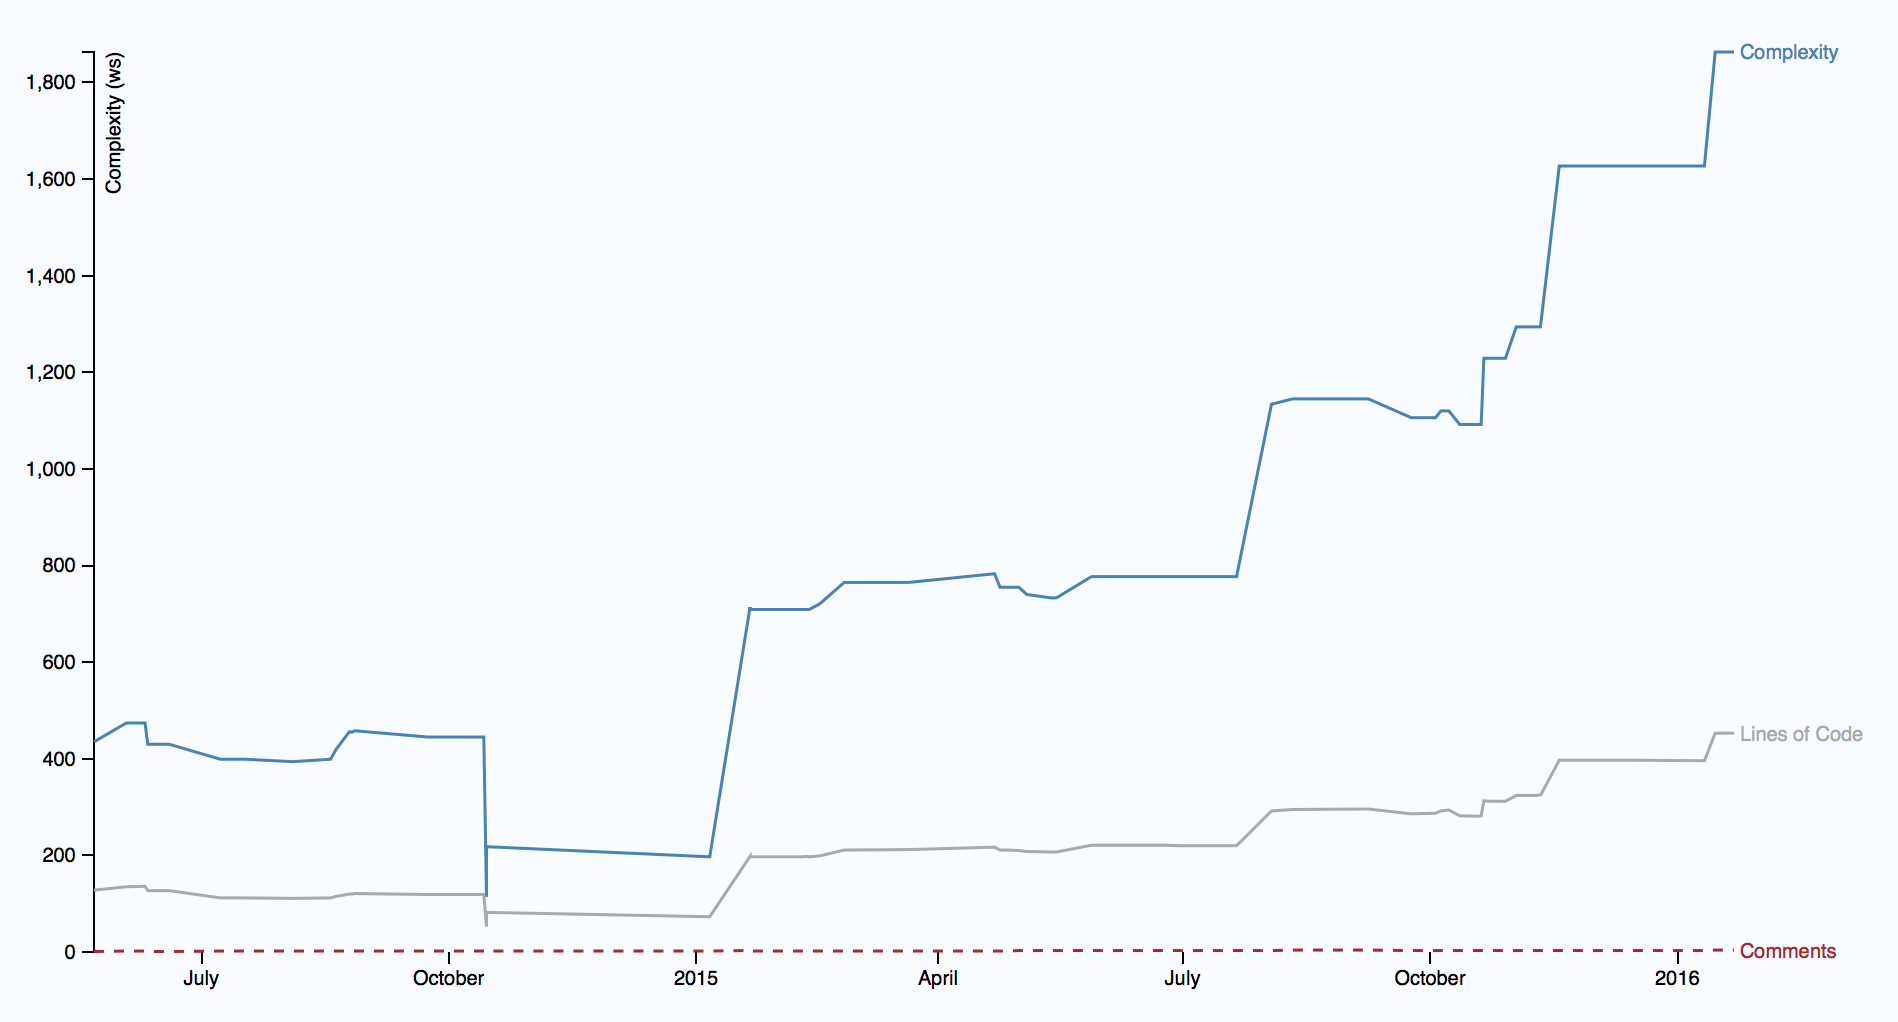
The illustration shows the trend of the complexity of one GT, starting in mid-2014, and its development over the past year and a half can be seen. It turns out an alarming picture, because complexity began to grow rapidly. Worse, complexity grows non-linearly with respect to the amount of new code, which suggests that the code in GT becomes more difficult to understand. As a bonus, you also see that the increase in complexity is not accompanied by an increase in the description in the comments. It looks more and more like a real problem of support.
If you pay close attention, you will probably notice: the metric of the trend of complexity differs from the lines of code and complexity. While the lines of code serve as heuristics in the GT map, the metric becomes too coarse when we evaluate a particular long-term trend. For example, we want to distinguish a file that simply grew in a pure size from the case where each line of code becomes harder to understand (often due to excessive use of logical conditions). Both cases have their own problems, but the second case contains a higher risk. This means we need to be more focused on the language when calculating the trend.
Multidimensional hot spots
So, I noted earlier that real GTs are more than just a high degree of change. For example, we would like to consider the trend of complexity as part of the criteria for GT. A tool from Empear does this. Additionally, the company uses a machine learning algorithm that detects deeper change patterns when analyzing data, such as development fragmentation; it identifies problems of coordination at the organization level and internal communications. Total, tangled code that changes frequently is a problem (real GT) if:
- GT must be changed simultaneously with several other modules.
- GT affects different developers from different teams.
Since Empeat collects information about the company, incl. command structures, we are able to detect code that is really expensive in support. Every time a pattern of changes in the code base intersects with organizational constraints, you pay bills in the form of coordination and communication costs.
The following illustration shows how this algorithm, after running on a large number of open source projects, reduces the number of GTs to a small number of the total code size.

As you can see from the graphs, the allocated GTs make up only 2-3 percent of the total code. And at the same time, a disproportionately large amount of commits (11-16% of the total) is concentrated in these GTs. This means that any code improvements in priority GTs are well spent time.
Hotspots indicate areas of high defect density.
Since we founded the company, we spend a lot of time checking and testing real codebase analyzes. One of the things I did was research how well-marked GT predicts defects. This was done by identifying the places where corrective actions were taken in the code. Then we rewind back the version control history, measured the GT and tried to find a correlation.
Our results show a strong correlation between priority GTs and most defective parts in the code. In general, priority GTs make up only a small part of the code, but it is in them that 25–70 percent of all detected and resolved defects are located.
My book, Your Code as a Crime Scene, takes a deeper look at some of the research discoveries that we used as an entry point in the development of the Empear tool, as well as why and how GTs work. However, let me make a conclusion in one line.
There is a strong correlation between hot spots, support costs, and software defects. Hotspots are a great entry point if you want to find performance bottlenecks in your code, and with the Empear tool suite this knowledge is available like never before!
')
Source: https://habr.com/ru/post/310782/
All Articles