How to detect slow SQL queries?
It happened to each of us when developing websites or applications using MySQL as a database. Performance suddenly dropped dramatically, and you had no idea why this happened. This can be caused by many factors (high CPU utilization, low disk space, or low channel bandwidth), but it can also be a non-optimized query that runs much longer than it should.
How to find out which of the queries run the longest?
MySQL has built-in functionality for logging slow queries .
To enable this functionality, you must perform one of the following actions:
Other related options:
')
Log slow administrative statements such as
If you use this option together with
If the slow query logging was successfully enabled, you will see “
Note: cached requests will not be logged. Also, the requests in which the index does not benefit because the table contains zero or one record will not be recorded.
You may encounter a situation where the query is executed slowly only under certain conditions (when you write it to the log), but when you manually start the query, it performs normally:
Log Analysis
MySQL includes the
————————————————————————————————
In fairness, I want to add a few words from myself.
Since this is still a translation, and not its own article, I tried to translate as precisely as possible what the author wrote.
But for those who are interested in this small article, I want to recommend reading about this functionality in the official MySQL manual.
References:
dev.mysql.com/doc/refman/5.0/en/slow-query-log.html - English version
www.mysql.ru/docs/man/Slow_query_log.html - Russian version
PS: this does not mean that the article describes some false actions. Just as a nice bonus (:
How to find out which of the queries run the longest?
MySQL has built-in functionality for logging slow queries .
To enable this functionality, you must perform one of the following actions:
- add the following lines to
/etc/my.cnf:log-slow-queries=/tmp/slow_queries.log
long_query_time=10 - call
mysqldwith the following parameters:–log-slow-queries[=/tmp/slow_queries.log]
long_query_time is the maximum number of seconds a query can execute before it is written to the slow query log.Other related options:
')
–log-slow-admin-statementsLog slow administrative statements such as
OPTIMIZE TABLE , ANALYZE TABLE , and ALTER TABLE .–log-queries-not-using-indexesIf you use this option together with
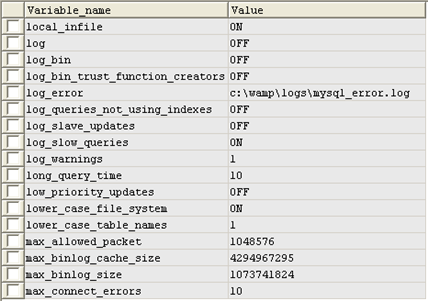
–log-slow-queries , queries that do not use indexes will be recorded in the slow query log.If the slow query logging was successfully enabled, you will see “
ON ” in the “ Value ” column for the “ log_slow_queries ” log_slow_queries (as shown in the figure above).Note: cached requests will not be logged. Also, the requests in which the index does not benefit because the table contains zero or one record will not be recorded.
You may encounter a situation where the query is executed slowly only under certain conditions (when you write it to the log), but when you manually start the query, it performs normally:
- The table can be locked (locked), thus placing the request in a waiting queue. In this case,
lock_timedetermines when the table will be unlocked and how long the query will be processed. - Data and indexes were not cached. This usually happens when MySQL starts for the first time, or when the tables have not been optimized.
- A third-party process was started, slowing down the disk.
- The server is overloaded with other requests at this time, and there are not enough CPU resources to work effectively.
Log Analysis
MySQL includes the
mysqldumpslow utility, a Perl script that summarizes the log data and visually displays how often each of the slow queries is executed.————————————————————————————————
In fairness, I want to add a few words from myself.
Since this is still a translation, and not its own article, I tried to translate as precisely as possible what the author wrote.
But for those who are interested in this small article, I want to recommend reading about this functionality in the official MySQL manual.
References:
dev.mysql.com/doc/refman/5.0/en/slow-query-log.html - English version
www.mysql.ru/docs/man/Slow_query_log.html - Russian version
PS: this does not mean that the article describes some false actions. Just as a nice bonus (:
Source: https://habr.com/ru/post/31072/
All Articles