Debugging php in Visual Studio Code (Xdebug, Windows)
In some cases, it may be necessary to debug applications on php. Visual Studio code provides such an opportunity, provided you install the additional extension PHP Debug ( marketplace , github ).
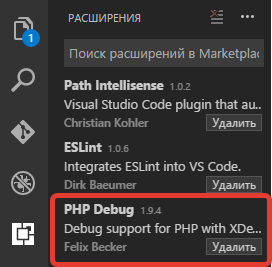
Installing PHP Debug
To install, press Ctrl+p and enter the ext install php-debug command. Click on the "enable" button, in the end you should see something like the following:
Install and configure Xdebug
PHP Debug uses Xdebug for debugging. Follow the link to set up Xdebug. It is assumed that the apache server is already installed and configured on the local machine. Hereinafter, actions are indicated for Windows. You can create a file, for example, test.php containing:
<?php phpinfo(); Open it in a browser and copy the contents of the page into a dialog box. Another way:
win+R;cmd+Enter;php -i > phpinfo.text;- open with any convenient
phpinfo.txteditor and insert all its contents into the dialog box.

Then follow the installation instructions: download the .dll and without changing its name, copy it to the specified folder, add the php.ini file with the line specified in the manual.
In addition, add the following lines. The final addition will be something like this:
[XDebug] zend_extension = C:\xampp\php\ext\php_xdebug-2.4.1-5.6-vc11.dll xdebug.remote_enable=1 xdebug.remote_host=127.0.0.2 xdebug.remote_port=9000 xdebug.remote_autostart=on xdebug.remote_handler=dbgp xdebug.profiler_enable=1 xdebug.profiler_output_dir="C:\xampp\tmp" xdebug.remote_log ="C:\xampp\tmp\xdebug.log" As you may have already guessed, in this example, XAMPP is installed on the local machine.
Pay attention to the line xdebug.remote_host=127.0.0.2 . By default, Xdebug listens on port 127.0.0.1. Enter here the address of the site being debugged.
Note: Visual Studio code does not work with Xdebug version 2.5 or higher. Therefore, choose the appropriate * .dll file for your php version.
Setup Visual Studio code
Call the debug panel (1) and click on the icon with the small gear (2).
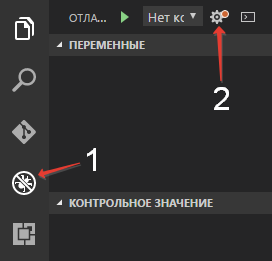
In the list that appears, select PHP . The launch.json file will be generated launch.json .
{ "version": "0.2.0", "configurations": [ { "name": "Listen for XDebug", "type": "php", "request": "launch", "port": 9000 }, { "name": "Launch currently open script", "type": "php", "request": "launch", "program": "${file}", "cwd": "${fileDirname}", "port": 9000 } ] } Setting up the PHP Debug is over.
Debugging php in Visual Studio code
Open your application \ website in your browser. Open the application folder in the Visual Studio code. Set in the desired files and lines a breakpoint. Open the debug panel and select Listen for Xdebug (1) to start debugging. Click the start button (2).

Refresh your browser and enjoy.
')
Source: https://habr.com/ru/post/310708/
All Articles