Step to the left, step to the right - scale. Or from absolute to simple order
It so happened in our universe that all (or almost all) signals of natural origin are analog. For most tasks of their processing, analysis, recognition, etc. it is necessary, first of all, to convert the signal into digital data (after all, we still have the age of digital technology, yeah). To do this, use analog-to-digital conversion. The topic is so well known to everyone that there is nothing, it seems, to talk about (with the exception of a specific transformation technique, but the article is not about that). However, let's, nevertheless, dive into this topic and consider it from an unusual angle.

To apply the classic signal processing procedures, the operations of addition and multiplication are required, therefore, the representation of samples in the absolute scale is required. Can other scales be used for signal processing, in which cases and what does it give? This is described in this article.
The authors apologize in advance for a decent amount, but this serves to clarify the issue as clearly as possible. And we have already talked a little about the use of scale coding for entropy estimation here
')
Classical analog-to-digital conversion to each sample of the input signal corresponds to the number of the interval on the amplitude scale in which this sample falls (Fig. 1).
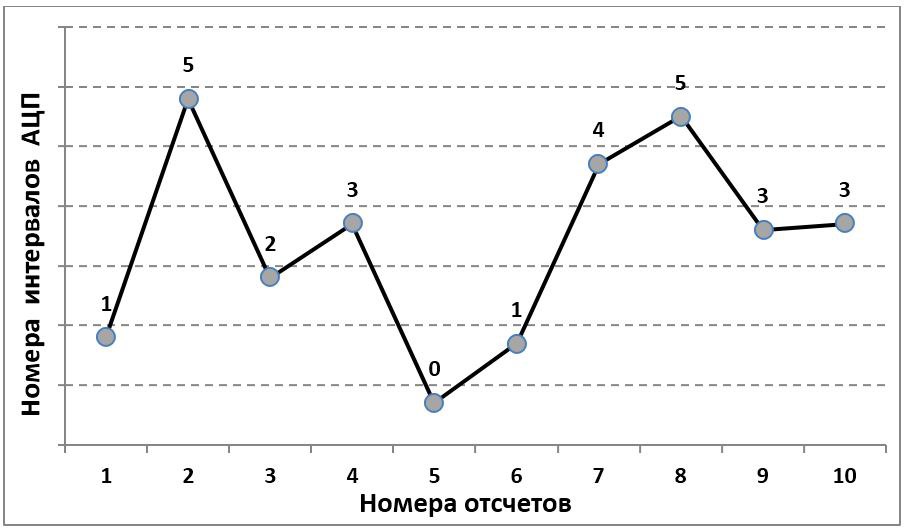
Fig. 1. The principle of analog-digital conversion
For each sample, this procedure can be considered as a single measurement. The width of the ADC interval determines the maximum error of such a measurement. In the theory of measurement (see, for example, [1]), the concept of measuring scales (comparison scales) is introduced. Mention some of them.
2.
Relative scales are naturally used for digitizing qualitative data. For example, when the measured characteristics take values from the set {bad, good, very good}. But if the source data are numbers, then what's the point of presenting them on a relative scale? And how then to work with them? Consider answering these two questions.
First, we will determine the motivation for presenting numerical data in relative scales. In the usual analog-digital conversion, the principle of which is shown in Fig. 1, the ratio of input levels and output values is fixed and does not depend on time. From here it follows that any two readings in the sample are comparable with each other, that is, we can determine which one is greater and how much . Are these statements always justified in terms of the nature of the input data? Suppose we estimate the wind speed by the angle of deflection of the tops of the trees (for example, processing records from surveillance cameras). Is it possible to say that twice as much the angle of deviation corresponds to twice the wind speed? Obviously, no, the relationship here is non-linear and its parameters are not exactly known to us.
However, we can compare the wind speeds at two arbitrary points in time at the angles of inclination of the trees and determine which one is greater. Thus, the absolute scale here is redundant , its use not only leads to inefficient coding, but also creates grounds for unfounded judgments (which is fraught with in science). At the same time, to present these data, an ordinal (rank) scale is sufficient, which generates a code of shorter length than the absolute one and encodes only reliable information.
Consider the following example. Let us ask ourselves the question: “How much is a simple pencil worth more today than in 1970?” . Formally, the answer to the question is simple, as prices are known. But this answer will not make any sense, since 1 ruble of 1970 and 1 ruble of 2016 are incomparable (in the sense of real content). Consequently, we cannot determine at all whether it is worth more or less today compared to 1970. However, in 1970 and in 2016 we can compare its cost with the cost of other goods, or compare its cost by the months of the same years. Thus, for some numerical series, the values are comparable only within a certain time interval . For such series, rank coding is not suitable, since it assumes the comparability of all samples of the time series. In this case, a different type of ordinal scale described below (local-rank coding) should be applied.
Before proceeding to consider directly the procedures of rank and local-rank coding, a few words about the practical significance of all these arguments. As is already clear from the above, the use of an absolute scale where it does not correspond to the nature of the data leads to two negative consequences:
With the volume of data, everything is clear, as for the second problem, we note that these judgments include, for example, estimates of the waveform parameters. So, as a result of monotonous transformations, a sinusoidal signal can be turned into a sawtooth, and vice versa. This will lead to incorrect application, for example, of spectral analysis procedures.
How common is this data? In the economy - almost everything related to prices and different rates. In sociology and statistics, for example, data on the incidence of the population for different periods. They cannot be compared, as the quality of medical diagnostics has changed. In the analysis of statistical series - when we deal with indices that reflect the indicator we are interested in, but, possibly, in a nonlinear way. In electronics and radio engineering, such situations arise where non-compensable non-linear transformations take place and uncontrollable (parasitic, etc.) signal modulations take place. An example is the measurement of potential in electroencephalography, the result, as a rule, is modulated by a variable electrode resistance, so that only time readings can be compared.
How significant are the problems we identified? After all, the cost of data storage with the development of technology falls, and you can simply refrain from incorrect judgments. The fact is that today humanity generates much more data than it can process, and this gap is growing. To overcome it, so-called Big Data Systems and Technologies. The use of scale data coding according to their nature can significantly increase the efficiency of technologies for their automatic processing. First , on this basis, the input flow rate will significantly decrease. Secondly , machine learning procedures, automatic detection of patterns, etc. will work more correctly, relying only on the significant properties of the source data. In general, the procedure for preparing data for automated analysis is of paramount importance, and scale coding can play a role here.
Now consider the specific methods of encoding data.
Rank coding has been known for a long time and is used, in particular, in statistics for non-parametric testing of hypotheses. For the signal shown in fig. 1, the corresponding rank code is shown in Fig. 2. It is obtained by replacing the reference with its rank, that is, the sequence number in the sample sorted in ascending order.
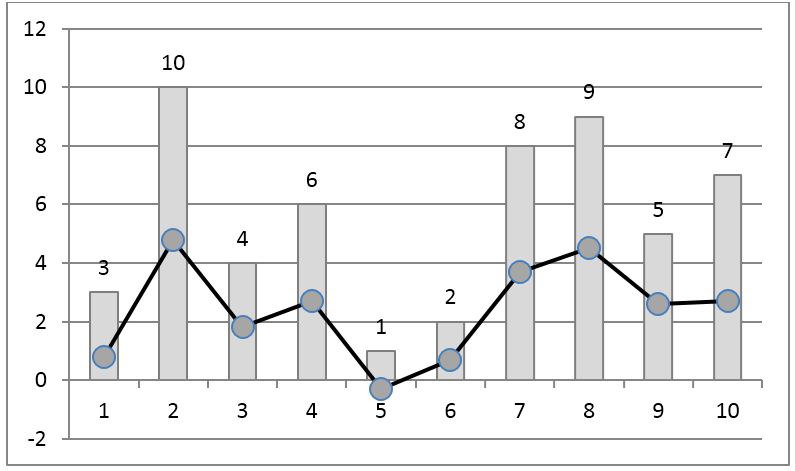
Fig. 2. Rank coding of the time series. Line with markers - the original signal, the columns - the ranks of samples.
The disadvantage of such coding is its nonlocality in the sense that adding new elements to the sample changes the ranks of all samples. In particular, the rank of the maximum by the value of the reference is always equal to the number of samples in the sample. Pompe et al. [2] proposed to divide the rank values by the number of elements in the sample. As a result, the resulting code is always in the interval [0,1] and the effect of new samples on the ranks of the rest is significantly reduced (Fig. 3).
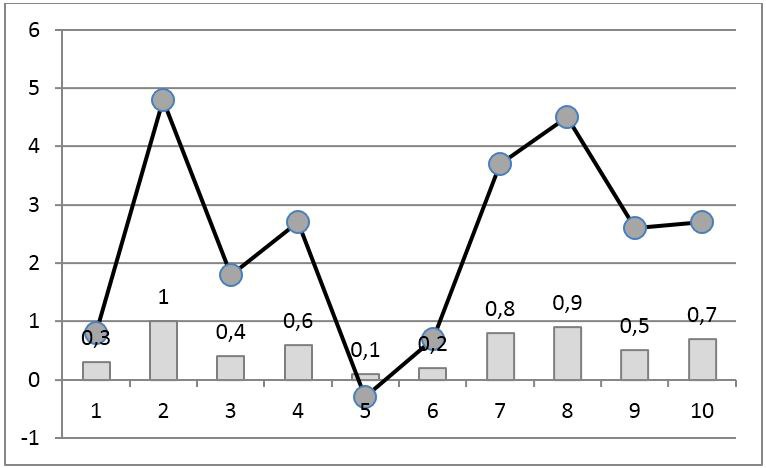
Fig. 3. Rank coding of the time series using the Pompe et al. Algorithm. [2]. Line with markers - the original signal, the columns - the ranks of samples.
The problem of non-locality of the rank code is also solved by another method - using local-rank coding. To do this, we need to set a comparability interval , within which the sample ratios are considered significant and should be preserved. The ratios of samples that are separated from each other by more than a comparability interval are not taken into account in coding.
In the process of local-rank coding, such a code is selected, the elements of which repeat the relationship between the readings of the original series, separated from each other by no more than a comparability interval. For an example in fig. 3 shows such a code with a comparability interval of 2 samples. This means that for each sample, the ratios with the next two samples, left and right, are preserved.
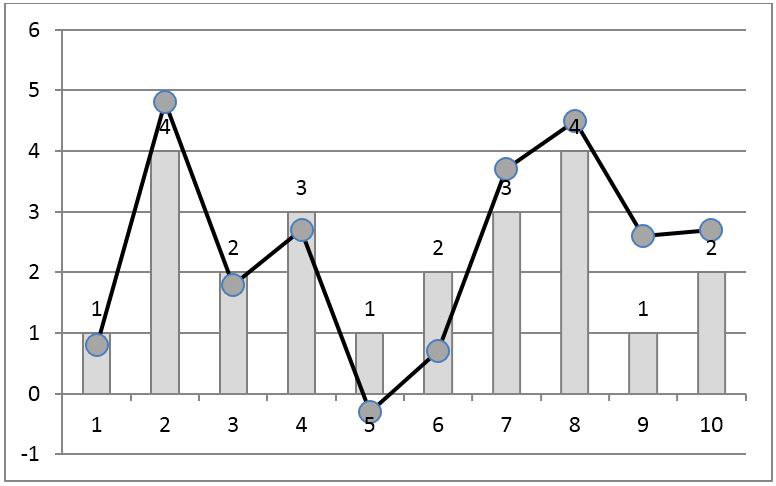
Fig. 4. Local rank coding of the time series. Line with markers - the original signal, the bars - the local ranks of samples.
The ranks of counts (global, normalized, local) are represented by numbers. In fact, they are not numbers, since the operations of addition and subtraction of ranks have no meaning. The ranks reflect only the sign of the difference between two counts, but not its value. Thus, ranks are a set whose elements are ordered by the relation ≤. Such a set can always be mapped to an alphabet, since the symbols of the alphabet are ordered by the sequence of the sequence, and the sum and difference for them are not determined.
In fig. 5. An example of a character locally ranked code for a time series is presented. It is easy to verify that within the two positions to the left and right for each sample sample, the symbol sequence has the same ratios as the original. For samples that are more than 2 positions apart, the ratios are not maintained (for example, samples with numbers 1 and 5), since such samples are considered incomparable.
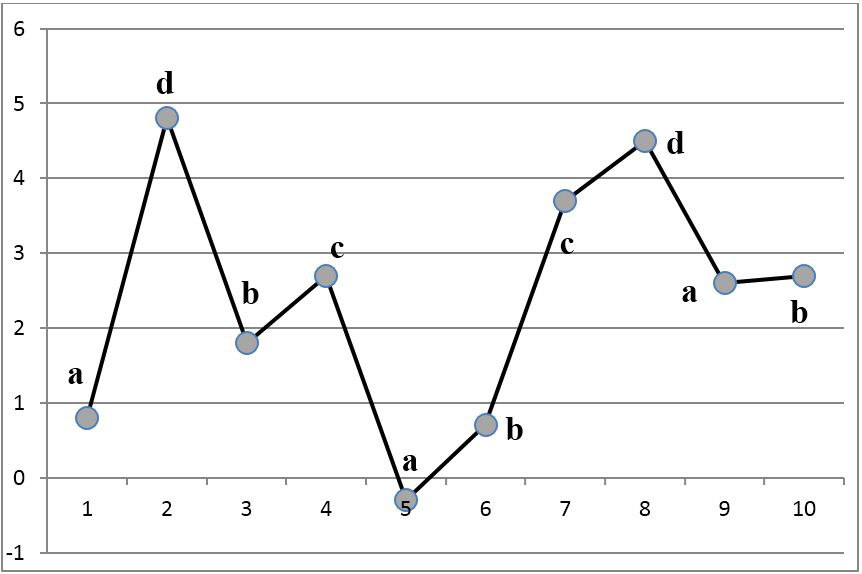
Fig. 5. Symbolic local rank coding.
The method of symbolic local-rank coding was proposed in [3], and an algorithm for calculating it is given in [4]. The questions of locally rank coding and its application for estimating the entropy of signals are discussed in detail in the monograph [5].
As already mentioned, the arithmetic operations are not defined over the data presented in the ranking scale. This, however, does not mean that such operations are completely prohibited on such data, in certain cases they can be applied. For example, perform spectral analysis to find hidden periodicities. However, since information about the waveform is lost during coding, only the identified first harmonic can be trusted, the second and subsequent harmonics may appear due to non-linear coding. It is also possible to apply correlation analysis to the ranking data.
However, since the ranking data is essentially symbolic to them it is possible to absolutely correctly apply the following types of analysis:
These types of data analysis can also give new results when applied to classical problems of signal analysis and recognition, model identification, etc. For this reason, the representation of signals in rank scales is also of interest in cases where the data are quite representable in an absolute scale. In particular, when estimating the entropy of time series, it is advisable to move to the rank scale (see [2,3,5]).
7. A bit of theory
Rank codes have a number of interesting properties, for example, invariance to continuous one-to-one transformations. Thus, the series: x (n) and e ^ (x (n)) will have matching rank codes. This makes them attractive, in particular, for solving problems of entropy estimation of time series, since the entropy estimates of series of type x (n) and e ^ (x (n)) must coincide.
But it seems to us that the scale coding will find its application in other areas, in particular Big Data . The processing of symbolic sequences is a well-developed area of knowledge and technology, so the transition from numerical sequences to symbolic sequences allows us to expand the arsenal of applied models and processing algorithms.
The theoretical foundations of scale coding of data in general and time series, in particular, should lie somewhere in data algebra (the question has not yet been worked out by the authors). The basic idea is that if we exclude from consideration any properties of the input data, considering them insignificant due to their nature or features of the measurement procedure, then we should proceed from the representation by numbers to the elements representing the set with the operations and relations defined on it which are valid for data. So, if we say that the absolute values of the differences between samples are insignificant, and you can only trust the signs of these differences, then we immediately get a set isomorphic to some alphabet of characters.
Failure to compare samples remote from each other leads to a partially ordered set, in which not all elements are comparable. So, strictly speaking, for a locally-ranked code, it is necessary to choose not the alphabet (since in it all the elements are comparable), but a set of another type. Such properties have, for example, a set of words, ordered by the relation ≤, specified in such a way that the word A is less than the word B if and only if all the letters in A are less than the corresponding letters of the word B. So the word cbg will be less than dhr (c <d & b <h & g <r), however, the words cbg and bcg are incomparable. The question of data coding by such algebraic constructions is still waiting for its researcher.
Conceptually, all this relates to the theory of information, namely, to the questions of determining the amount of information contained in the data. From the foregoing, it is clear that a simple numerical representation of data, including signals, in certain cases has a great redundancy, since it encodes relationships that are not reliable. This seems to be a new type of redundancy, differing from the well-known statistical or less well-known algorithmic. Under certain restrictions, it is possible to set and solve problems of finding the minimum alphabet, which allows to encode the necessary relations in the signal. For a locally ranked code, this question was partially considered in [3].
It can also be assumed that algebraic data and signal models adapted to Big Data technologies will become the subject of active research, and the reason for this research will be not only the problems we have considered. So, finishing this article, we note that the issues of digital representation of signals are still relevant and go far beyond the Kotelnikov theorem (time to destroy and break stereotypes) and other classical results of the theory of digital signal processing.
Literature
Text writer: Tsvetkov O.V.
Habra Editor: YuliyaCl
P.S. The authors will welcome your comments, as well as thoughts on the use of local-rank coding in your subject areas.
To apply the classic signal processing procedures, the operations of addition and multiplication are required, therefore, the representation of samples in the absolute scale is required. Can other scales be used for signal processing, in which cases and what does it give? This is described in this article.
The authors apologize in advance for a decent amount, but this serves to clarify the issue as clearly as possible. And we have already talked a little about the use of scale coding for entropy estimation here
')
1. The concept of scales
Classical analog-to-digital conversion to each sample of the input signal corresponds to the number of the interval on the amplitude scale in which this sample falls (Fig. 1).
Fig. 1. The principle of analog-digital conversion
For each sample, this procedure can be considered as a single measurement. The width of the ADC interval determines the maximum error of such a measurement. In the theory of measurement (see, for example, [1]), the concept of measuring scales (comparison scales) is introduced. Mention some of them.
- a) Absolute scale. This is a common scale in which measurement is made by comparing with a standard (meter, kg, etc.). This scale corresponds to the classic ADC. The results of measurements in this scale can be added and multiplied.
- b) Spacing scale. In this scale, measurements are made at the selected point of reference and at a given scale. An example is temperature measurement in Celsius and Fahrenheit scales. The results of measurements in the scale of intervals can not be added and multiplied.
- c) Ordinal scale. This scale determines only the relationship between the two values (more, less or equal), and it is impossible to determine how much one value is greater than the other. An example of such a scale is the replacement of a reference with its rank in the sample. Any arithmetic operations are not applicable to the data in this scale, but they are invariant to monotonic transformations of the original signals.
2. Crazy Scale Representations of Numerical Time Series
Relative scales are naturally used for digitizing qualitative data. For example, when the measured characteristics take values from the set {bad, good, very good}. But if the source data are numbers, then what's the point of presenting them on a relative scale? And how then to work with them? Consider answering these two questions.
First, we will determine the motivation for presenting numerical data in relative scales. In the usual analog-digital conversion, the principle of which is shown in Fig. 1, the ratio of input levels and output values is fixed and does not depend on time. From here it follows that any two readings in the sample are comparable with each other, that is, we can determine which one is greater and how much . Are these statements always justified in terms of the nature of the input data? Suppose we estimate the wind speed by the angle of deflection of the tops of the trees (for example, processing records from surveillance cameras). Is it possible to say that twice as much the angle of deviation corresponds to twice the wind speed? Obviously, no, the relationship here is non-linear and its parameters are not exactly known to us.
However, we can compare the wind speeds at two arbitrary points in time at the angles of inclination of the trees and determine which one is greater. Thus, the absolute scale here is redundant , its use not only leads to inefficient coding, but also creates grounds for unfounded judgments (which is fraught with in science). At the same time, to present these data, an ordinal (rank) scale is sufficient, which generates a code of shorter length than the absolute one and encodes only reliable information.
Consider the following example. Let us ask ourselves the question: “How much is a simple pencil worth more today than in 1970?” . Formally, the answer to the question is simple, as prices are known. But this answer will not make any sense, since 1 ruble of 1970 and 1 ruble of 2016 are incomparable (in the sense of real content). Consequently, we cannot determine at all whether it is worth more or less today compared to 1970. However, in 1970 and in 2016 we can compare its cost with the cost of other goods, or compare its cost by the months of the same years. Thus, for some numerical series, the values are comparable only within a certain time interval . For such series, rank coding is not suitable, since it assumes the comparability of all samples of the time series. In this case, a different type of ordinal scale described below (local-rank coding) should be applied.
Before proceeding to consider directly the procedures of rank and local-rank coding, a few words about the practical significance of all these arguments. As is already clear from the above, the use of an absolute scale where it does not correspond to the nature of the data leads to two negative consequences:
- inefficient data expansion;
- creating prerequisites for false judgments about the ratio of samples.
With the volume of data, everything is clear, as for the second problem, we note that these judgments include, for example, estimates of the waveform parameters. So, as a result of monotonous transformations, a sinusoidal signal can be turned into a sawtooth, and vice versa. This will lead to incorrect application, for example, of spectral analysis procedures.
How common is this data? In the economy - almost everything related to prices and different rates. In sociology and statistics, for example, data on the incidence of the population for different periods. They cannot be compared, as the quality of medical diagnostics has changed. In the analysis of statistical series - when we deal with indices that reflect the indicator we are interested in, but, possibly, in a nonlinear way. In electronics and radio engineering, such situations arise where non-compensable non-linear transformations take place and uncontrollable (parasitic, etc.) signal modulations take place. An example is the measurement of potential in electroencephalography, the result, as a rule, is modulated by a variable electrode resistance, so that only time readings can be compared.
How significant are the problems we identified? After all, the cost of data storage with the development of technology falls, and you can simply refrain from incorrect judgments. The fact is that today humanity generates much more data than it can process, and this gap is growing. To overcome it, so-called Big Data Systems and Technologies. The use of scale data coding according to their nature can significantly increase the efficiency of technologies for their automatic processing. First , on this basis, the input flow rate will significantly decrease. Secondly , machine learning procedures, automatic detection of patterns, etc. will work more correctly, relying only on the significant properties of the source data. In general, the procedure for preparing data for automated analysis is of paramount importance, and scale coding can play a role here.
Now consider the specific methods of encoding data.
3. Rank coding of numeric series
Rank coding has been known for a long time and is used, in particular, in statistics for non-parametric testing of hypotheses. For the signal shown in fig. 1, the corresponding rank code is shown in Fig. 2. It is obtained by replacing the reference with its rank, that is, the sequence number in the sample sorted in ascending order.
Fig. 2. Rank coding of the time series. Line with markers - the original signal, the columns - the ranks of samples.
The disadvantage of such coding is its nonlocality in the sense that adding new elements to the sample changes the ranks of all samples. In particular, the rank of the maximum by the value of the reference is always equal to the number of samples in the sample. Pompe et al. [2] proposed to divide the rank values by the number of elements in the sample. As a result, the resulting code is always in the interval [0,1] and the effect of new samples on the ranks of the rest is significantly reduced (Fig. 3).
Fig. 3. Rank coding of the time series using the Pompe et al. Algorithm. [2]. Line with markers - the original signal, the columns - the ranks of samples.
4. Local rank coding of numerical series
The problem of non-locality of the rank code is also solved by another method - using local-rank coding. To do this, we need to set a comparability interval , within which the sample ratios are considered significant and should be preserved. The ratios of samples that are separated from each other by more than a comparability interval are not taken into account in coding.
In the process of local-rank coding, such a code is selected, the elements of which repeat the relationship between the readings of the original series, separated from each other by no more than a comparability interval. For an example in fig. 3 shows such a code with a comparability interval of 2 samples. This means that for each sample, the ratios with the next two samples, left and right, are preserved.
Fig. 4. Local rank coding of the time series. Line with markers - the original signal, the bars - the local ranks of samples.
5. Character representation of time series
The ranks of counts (global, normalized, local) are represented by numbers. In fact, they are not numbers, since the operations of addition and subtraction of ranks have no meaning. The ranks reflect only the sign of the difference between two counts, but not its value. Thus, ranks are a set whose elements are ordered by the relation ≤. Such a set can always be mapped to an alphabet, since the symbols of the alphabet are ordered by the sequence of the sequence, and the sum and difference for them are not determined.
In fig. 5. An example of a character locally ranked code for a time series is presented. It is easy to verify that within the two positions to the left and right for each sample sample, the symbol sequence has the same ratios as the original. For samples that are more than 2 positions apart, the ratios are not maintained (for example, samples with numbers 1 and 5), since such samples are considered incomparable.
Fig. 5. Symbolic local rank coding.
The method of symbolic local-rank coding was proposed in [3], and an algorithm for calculating it is given in [4]. The questions of locally rank coding and its application for estimating the entropy of signals are discussed in detail in the monograph [5].
6. Work with rank data
As already mentioned, the arithmetic operations are not defined over the data presented in the ranking scale. This, however, does not mean that such operations are completely prohibited on such data, in certain cases they can be applied. For example, perform spectral analysis to find hidden periodicities. However, since information about the waveform is lost during coding, only the identified first harmonic can be trusted, the second and subsequent harmonics may appear due to non-linear coding. It is also possible to apply correlation analysis to the ranking data.
However, since the ranking data is essentially symbolic to them it is possible to absolutely correctly apply the following types of analysis:
- statistical analysis of character series (Markov models, etc.);
- searching regularities using regular expressions, forecasting time series on this basis;
- theoretical information analysis (entropy, mutual information, etc.)
These types of data analysis can also give new results when applied to classical problems of signal analysis and recognition, model identification, etc. For this reason, the representation of signals in rank scales is also of interest in cases where the data are quite representable in an absolute scale. In particular, when estimating the entropy of time series, it is advisable to move to the rank scale (see [2,3,5]).
7. A bit of theory (and very soon the end)
Rank codes have a number of interesting properties, for example, invariance to continuous one-to-one transformations. Thus, the series: x (n) and e ^ (x (n)) will have matching rank codes. This makes them attractive, in particular, for solving problems of entropy estimation of time series, since the entropy estimates of series of type x (n) and e ^ (x (n)) must coincide.
But it seems to us that the scale coding will find its application in other areas, in particular Big Data . The processing of symbolic sequences is a well-developed area of knowledge and technology, so the transition from numerical sequences to symbolic sequences allows us to expand the arsenal of applied models and processing algorithms.
The theoretical foundations of scale coding of data in general and time series, in particular, should lie somewhere in data algebra (the question has not yet been worked out by the authors). The basic idea is that if we exclude from consideration any properties of the input data, considering them insignificant due to their nature or features of the measurement procedure, then we should proceed from the representation by numbers to the elements representing the set with the operations and relations defined on it which are valid for data. So, if we say that the absolute values of the differences between samples are insignificant, and you can only trust the signs of these differences, then we immediately get a set isomorphic to some alphabet of characters.
Failure to compare samples remote from each other leads to a partially ordered set, in which not all elements are comparable. So, strictly speaking, for a locally-ranked code, it is necessary to choose not the alphabet (since in it all the elements are comparable), but a set of another type. Such properties have, for example, a set of words, ordered by the relation ≤, specified in such a way that the word A is less than the word B if and only if all the letters in A are less than the corresponding letters of the word B. So the word cbg will be less than dhr (c <d & b <h & g <r), however, the words cbg and bcg are incomparable. The question of data coding by such algebraic constructions is still waiting for its researcher.
Conceptually, all this relates to the theory of information, namely, to the questions of determining the amount of information contained in the data. From the foregoing, it is clear that a simple numerical representation of data, including signals, in certain cases has a great redundancy, since it encodes relationships that are not reliable. This seems to be a new type of redundancy, differing from the well-known statistical or less well-known algorithmic. Under certain restrictions, it is possible to set and solve problems of finding the minimum alphabet, which allows to encode the necessary relations in the signal. For a locally ranked code, this question was partially considered in [3].
It can also be assumed that algebraic data and signal models adapted to Big Data technologies will become the subject of active research, and the reason for this research will be not only the problems we have considered. So, finishing this article, we note that the issues of digital representation of signals are still relevant and go far beyond the Kotelnikov theorem (time to destroy and break stereotypes) and other classical results of the theory of digital signal processing.
Literature
1. Saaty Thomas L. Decision Making with Dependencies and Feedbacks: Analytical Networks. Per. from English / Scientific. ed. A.V. Andreichikov, O.N. Andreichikova. Ed. 4th - M .: LENAND, 2015. -360 p.
2. Pompe B. Ranking and nonlinear time analysis // Nonlinear analysis of physiological data. Springer Berlin Heidelberg, 1998. - p. 67–90.
3. Tsvetkov OV, “Computation of the entropy estimate of a biosignal invariant to a change in its amplitude, using a rank kernel,” Izv. universities. Radio electronics. - 1991. - № 8. - p. 108-110.
4. Tsvetkov OV, “Estimation of the proximity of numerical sequences based on a comparison of their rank kernels,” Izv. universities. Radio electronics. - 1992. - № 8. - p. 28–33.
5. Tsvetkov OV Entropy data analysis in physics, biology and technology. SPb .: Publishing house of Saint-Petersburg Electrotechnical University "LETI", 2015. 202 p.
Text writer: Tsvetkov O.V.
Habra Editor: YuliyaCl
P.S. The authors will welcome your comments, as well as thoughts on the use of local-rank coding in your subject areas.
Source: https://habr.com/ru/post/310526/
All Articles