Ontodia + Caché - an ontology visualizer for navigating InterSystems Caché stored entities
About Ontodia Library
For a start, it makes sense to dwell on what Ontodia is and what the Caché DBMS is. Perhaps we will start with the so far less well-known product - Ontodia. Ontodia is the result of a joint project of the international laboratory ISST of the ITMO University and the company VISmart, which develops software in the field of semantic web (semantic web). The Ontodia service was originally a web application designed to visualize exclusively linked data (linked data) and ontologies. We created this service because we did not manage to find simple, accessible and effective tools for clearly visualizing the associated data of the semantic web.
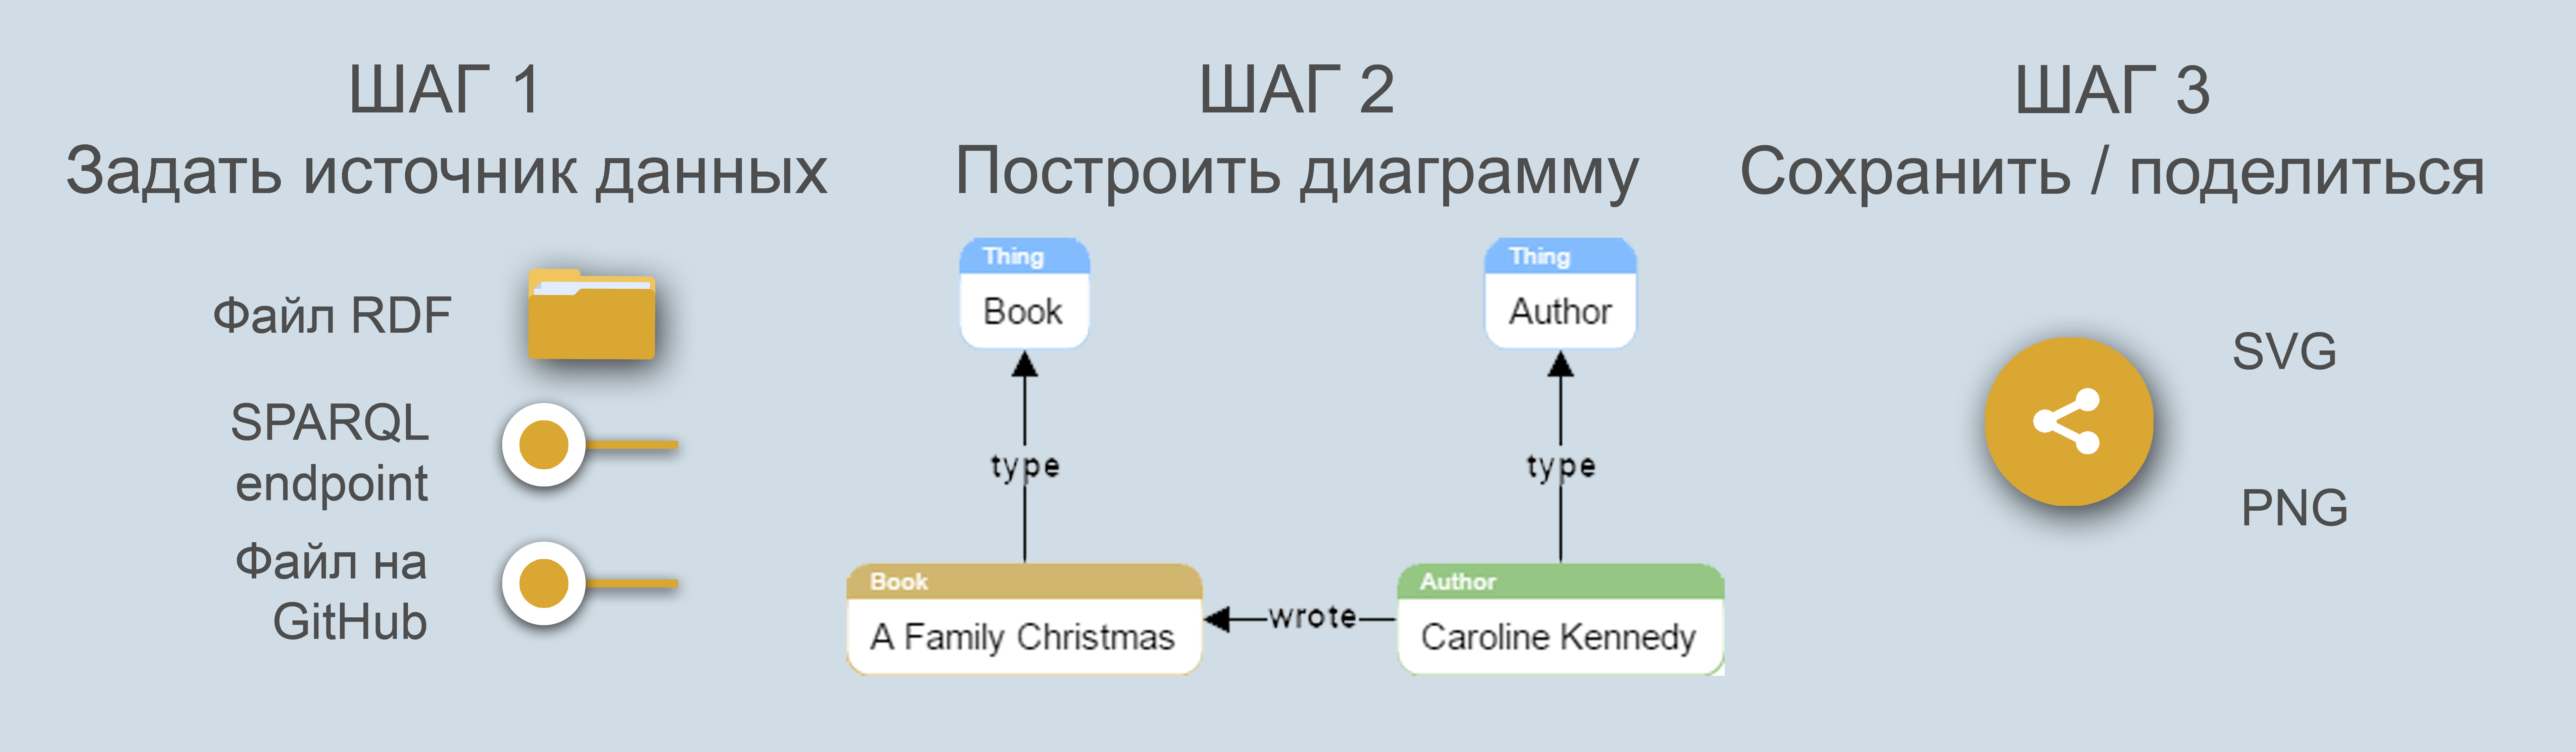
A typical use case for Ontodia was a sequence of 3 steps:
- The user provides a set of data for visualization: an RDF or OWL file, or enters access parameters to an open endpoint.
- The user moves through the data, forms the desired chart
- The user saves the chart, shares it with his colleagues, publishes it with a permanent link or embeds the chart into his page.
')
Ontodia is always available to use and perform the actions described in this scenario - the address of the service www.ontodia.org .
An overview of the basic features in screencast format is available here .
As the service developed and during the collection of feedback on the service, we found out that there is a request for graphical visualization of data stored in relational and object databases. The greatest interest was shown by the Russian team of InterSystems Corporation.
Gradually, the Ontodia service began to expand its functionality and went beyond the boundaries of semantic data. First of all, the ability to work with object DBMS was added (Caché DBMS, by and large, refers to such) through the implemented Rest API, through which data was received.
In the next step, the Ontodia service was allocated to a separate JavaScript library. The library code is now published on github . All server functions, namely access control, user management, storage of created charts, etc. from this point on, platforms were run that used Ontodia as a library. In this particular case, InterSystems Caché has become such a platform.

Allocation of a stand-alone library allowed for simplified integration with platforms. The scenario of interactions between the platform, on the example of the Caché DBMS and the library was as follows:
- Caché DBMS server calls the library code when the user accesses the URL
- The library requests from the Caché DBMS server the necessary data set for it to be displayed on the graph. The server provides the requested data.
- Ontodia restores the data scheme in graph terms (links, vertices, link properties and vertex properties)
- The user initiates the saving of the diagram and Ontodia sends to the JSON server to store the diagram
About InterSystems Caché
Now we need to talk about the platform that has integrated Ontodia into itself. If you look broadly, then InterSystems Caché is a database management system, and if it is even wider, it is an environment for developing applications related to data processing. It is considered that Caché is also a multi-model DBMS, that is, it provides several methods of storing, presenting and accessing data on the basis of these representations at once.
In fact, Ontodia is another way of presenting data in Caché, enabling the user to get an idea of the structure of data organization in terms of stored classes and the relationships between them (including the ranks and semantics of relationships), as well as visualizing the properties of stored instances of classes, their relationships with other instances in the database and navigate the entities in the database.
Ontodia features for Caché
The Ontodia library is able to display the following components of a data set on an interactive graph:
- Classes with their properties;
- Instances with their properties;
- Links between classes;
- Relationship between classes and instances;
- Links between instances.
Display Features
Each vertex of the graph is displayed as a rectangle with rounded corners. Inside each rectangle in large letters indicate the name of the object, and small letters on the color bar indicate which class this object belongs to. The bar at the top allows you to distinguish classes by color.
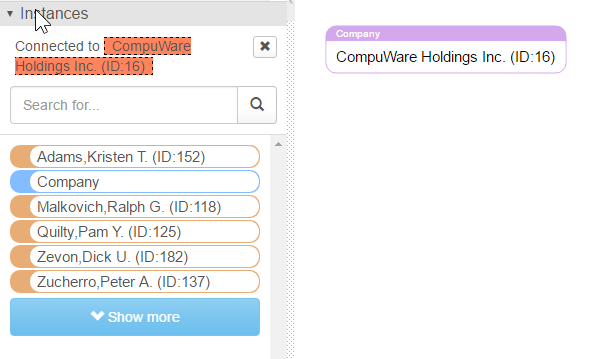
A single click on the vertex of the graph shifts the focus to the vertex and displays all the objects associated with it in the Instances panel.
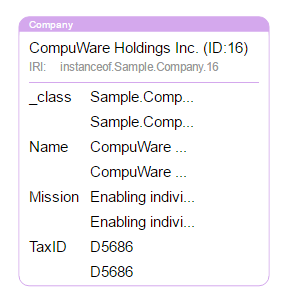
Double-click on the top to open the list of object properties.
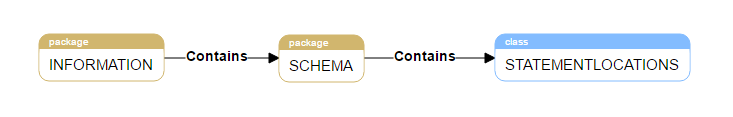
Links are displayed as lines, arrows correspond to the directions of links, each link is labeled with its name.
After a brief acquaintance with the graphic language of Ontodia, it is time to show how the data from Caché is displayed and how Ontodia allows you to interact with the graph.
Graph display control
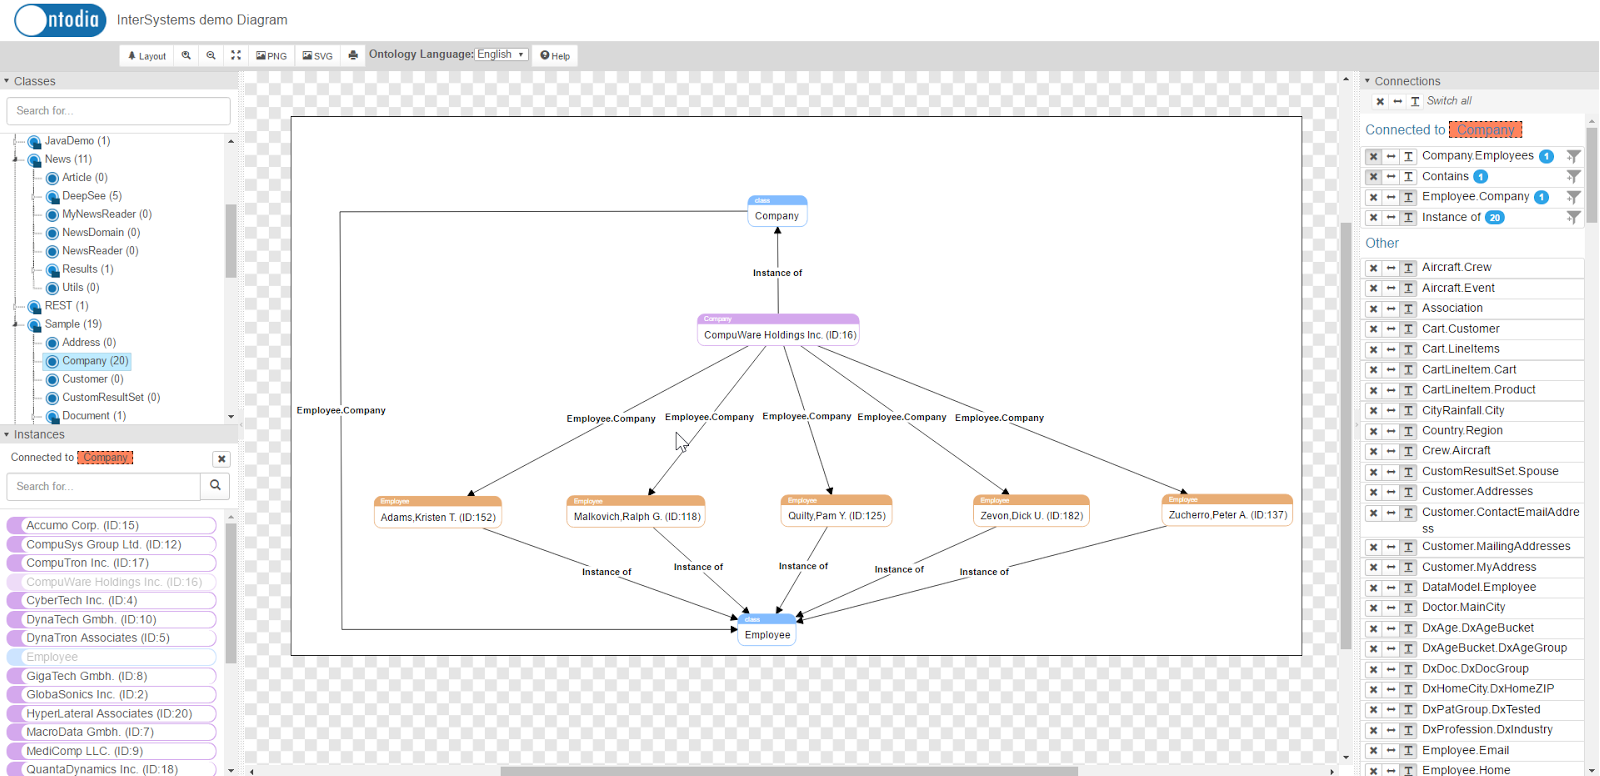
- At the beginning, Ontodia displays the tree of classes, the data set transferred to it in the Class tree panel (see picture) and allows you to drag classes to the graph workspace (in the middle). Supports search in the class tree with filtering results as you type characters.
- The user can view all instances of any of the classes. Instances are filtered in the Instances panel when you click on any of the classes in the tree. If there are too many instances, we have provided a simple search by string.
- The user can drag one or more instances from the Instances panel onto the diagram workspace.
- The user can control the display of links - in the Connections panel, he can choose which types of links to display on the graph, and also indicate whether he needs signatures to the links. This feature allows you to control the “population” of the diagram and to avoid an excessive number of elements and links.
- The user can delete specific vertices as well as links, thereby forming the necessary data set for him to display.
- The user can move to the workspace vertices and communication, achieving the best from a visual point of view, the layout of elements.
- The user can zoom in and out the graph, move it entirely in the workspace and fit the graph into the borders of the screen.
- Double-clicking on any of the vertices will reveal the properties of the selected object.
Below is an example of a chart, which took about 30 seconds to create.
Navigation options
Ontodia makes it possible not only to create any number of data representations (diagrams), but also allows you to explore data and graphically structure its structure. To do this, the user can:
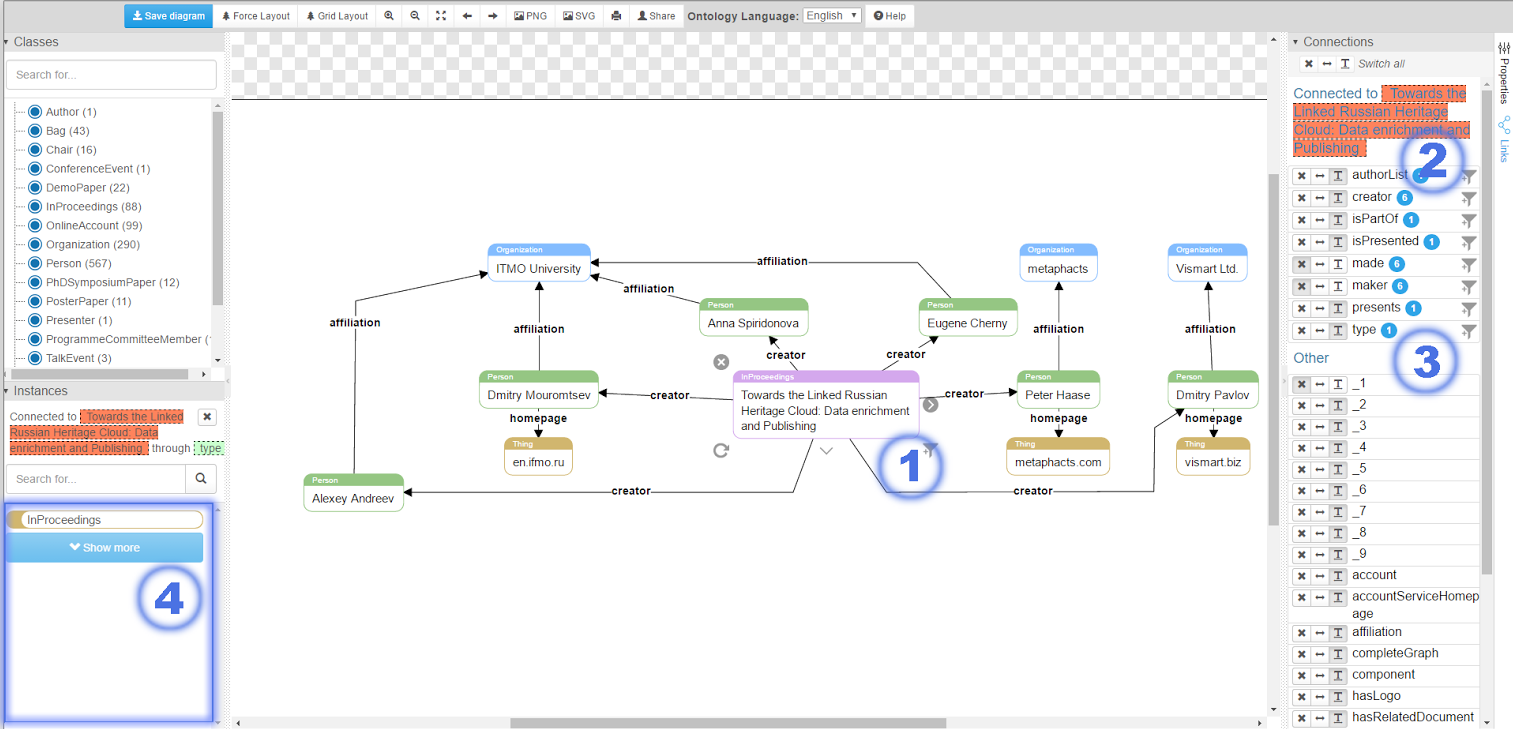
- Click on any vertex of the graph and get in the Instances panel all the objects that are directly connected with it. After that, the user can drag the found objects, thus visually fixing the trajectory of their data navigation.
- Get all the connections that forms the selected node on the graph. Connections will be listed at the top of the Connections panel. The number of objects that are at the opposite end of the link will be indicated to the right of each found connection in the Connections panel. By clicking on the filter icon next to the desired connection, the user will receive in the Instances panel all objects that are in the selected relation with the marked object on the graph.
Where to try and where to find out more
"Link to the demo .
»Link to screencast about Ontodia .
»The project repository is publicly available here .
How to install
To install the latest library running through the Rest API with Caché, you need to import the OntodiaCache package. To do this, download the archive here , and then import the OntodiaCache.xml file (see the archive named ontodia-cache-release.zip) into Caché Studio ( tutorial ). As a result, you get all the necessary resources, and compilation will lead to the creation of a new web application.
How to start
When the installation is complete, go to the Caché server at the following link [server URL] /csp/ontodia-cache/index.html.
In order to specify exactly which namespace to use when rendering data, add the namespace parameter and the value of this parameter to the address bar with the name of the desired namespace.
Example: localhost : 57772 / csp / ontodia-cache / index.html? Namespace = Samples
Building a new version of OntodiaCache.xml
To build a project you need to install the NodeJS platform. If you have NodeJS, clone the source code of the repository and run
npm install in the project root directory. All necessary modules will be installed via NPM.The next step is to install the old version of the OntodiaCache.xml file - see the “How to install” section.
From now on, to build, you will need to run the
npm run webpack in the project root directory. Running the command will create the necessary source code, which should be moved to the InterSystems Caché Studio server directory ({Server folder} \ Cache \ CSP \ {namespace}Example: C: \ InterSystems \ Cache \ CSP \ growth_cache) and on the basis of which you can develop a new version of the library.
Finally, in InterSystems Caché Studio, click on the root element of the Workspace panel and select the item “export to xml” in the context menu, then select the folder in which to place the new version of the .xml file.
What's next
In our plans to expand the functionality of the library, namely:
- Create custom templates for displaying instances of various classes (I would like, for example, to give the opportunity to display an instance of the class “person” in the form of a photo with the name, surname and contact coordinates)
- Implement the possibility of changing data directly on the graph
- Provide support for common notations: UML, IDEF, Archimate, etc.
We understand that creating a new version with the above-listed priority functions takes a lot of time. We ourselves do not want to wait that long, so we will be glad to any help or contribution to the improvement of Ontodia.
Feedback
Latest news about the project can be found in our blog .
You can contact us by mail .
Source: https://habr.com/ru/post/310402/
All Articles