GDB was a tough nut to crack.
 GDB is a hard tool to do without. Of course, as Brooks says, “The quality of software product development is achieved through proper design, not endless testing.” However, proper design does not protect against logical errors, typos, null pointers, and so on. And this is where code debugging tools like GDB help us. My goal is to show that not less useful tools are static code analyzers, which reveal many errors at the very early stages. It is much better if the error is corrected in the code, even before the testing and debugging phase. To demonstrate the benefits of static code analysis, we will look for errors inside GDB using the PVS-Studio analyzer.
Introduction
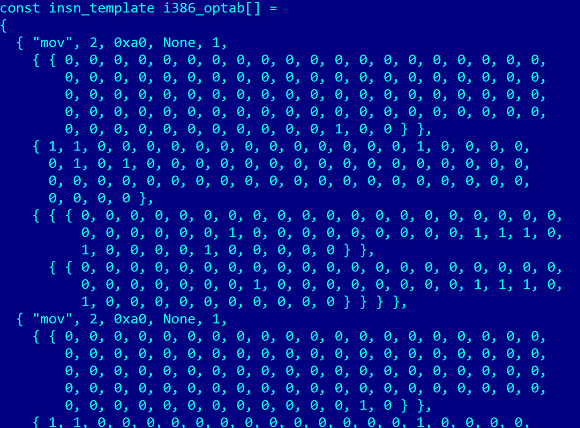
After a recent good article reviewing the GCC, I decided to write an article about GDB as well. This time, writing the article went harder. Apparently affects the size of the projects. However, it is difficult for me to compare the size of the source code. In both projects, there are files containing large data tables. They make a significant contribution to the size of the code and the number of lines of code. For example, in the GDB project, there is an i386-tbl.h file of 5 megabytes in size and containing a table of the following form:
I think that the present code in the GCC project is several times larger than the size of the GDB code. While checking GCC, I easily managed to collect enough errors for an article by skimming through the report and without going into suspicious but difficult to understand third-party code fragments. In the case of GDB, I had to look more carefully and still I was able to find few suspicious places.
Check
The source code for GDB version 7.11.1 has been verified. The code was verified by the PVS-Studio version working under Linux.
')
Quick reference. PVS-Studio is a commercial static analyzer that detects errors in source code written in C, C ++, C #. Works in Linux and Windows environment.
In order to test GDB with the help of the PVS-Studio static analyzer, you need to perform a few simple steps:
0) Read the documentation: " How to run PVS-Studio in Linux ." I chose a way to quickly test a project without integrating the analyzer into the build system.
1) Download the latest version of the source code from the official repository:
$ git clone git://sourceware.org/git/binutils-gdb.git 2) Modify the PVS-Studio.cfg configuration file, namely the output-file and sourcetree-root parameters. In my case:
exclude-path = /usr/include/ exclude-path = /usr/lib64/ lic-file = /home/andr/PVS-Studio.lic output-file = /home/andr/gdb.log sourcetree-root = /home/andr/binutils-gdb 3) Go to the downloaded directory:
$ cd binutils-gdb 4) Create a Makefile:
$ ./configure 5) Start the gdb assembly and the PVS-Studio analyzer:
$ pvs-studio-analyzer trace -- make -j3 6) Run the analysis (specify the path to the PVS-Studio.cfg configuration file):
$ pvs-studio-analyzer analyze --cfg /home/andr/PVS-Studio.cfg After successful completion of the analysis, a log file gdb.log will appear in the home directory, which can be viewed in Windows using the PVS-Studio Standalone utility. This is exactly what I did, since it is more familiar to me.
If you want to study the report in Linux, then the converter utility (plog-converter), whose source code is included in the PVS-Studio distribution kit, will help you. The utility can convert * .plog files to various formats (see the documentation ). You can also independently adapt the converter to your needs.
IMPORTANT. Do not try to watch * .log directly by opening it in some kind of text editor. It will be terrible. This file contains a lot of redundant and duplicate information. And that's why these files are so big. For example, if some kind of warning relates to an h-file, you will see it in the file as many times as this h-file is included in cpp-files. When you use PVS-Studio Standalone or plog-converter, these tools automatically remove such duplicates.
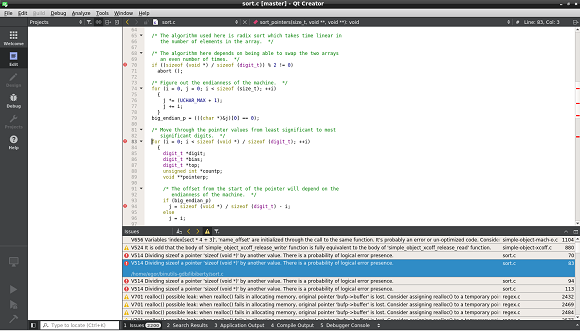
Suppose it is convenient for you to view a report in Qt Creator, after converting the * .log file to the Qt Task List File format. Then we should use the plog-converter utility as follows:
$ plog-converter -t tasklist -o /home/andr/gdb.tasks -r /home/andr/binutils-gdb/ -a GA:1,2,3 /home/andr/gdb.log Although for a start it would be better to use GA: 1.2 . Not the best idea to start dating with the analyzer, including all three levels of warnings.
After executing this command, the report file gdb.tasks will appear in the home directory, which can be viewed with Qt Creator:
View plog-converter options:
$ plog-converter --help Test results
As I said, this time I was able to find few errors demonstrating the capabilities of the PVS-Studio analyzer. The reason I think lies in the high quality of the source code of the GDB project and the fact that it is well tested by a huge number of users who are programmers themselves, and therefore more attentive and demanding than the average users of programs.
We'll see what interesting I could find. Let's start with an error in the comparison function. I highlight this bug in a new error pattern. I encounter similar errors in a large number of projects and soon plan to write a new article on this topic, which will be in the spirit of “ Last line effect ”.
Incorrect comparison function
static int psymbol_compare (const void *addr1, const void *addr2, int length) { struct partial_symbol *sym1 = (struct partial_symbol *) addr1; struct partial_symbol *sym2 = (struct partial_symbol *) addr2; return (memcmp (&sym1->ginfo.value, &sym1->ginfo.value, sizeof (sym1->ginfo.value)) == 0 && sym1->ginfo.language == sym2->ginfo.language && PSYMBOL_DOMAIN (sym1) == PSYMBOL_DOMAIN (sym2) && PSYMBOL_CLASS (sym1) == PSYMBOL_CLASS (sym2) && sym1->ginfo.name == sym2->ginfo.name); } PVS-Studio warning : V549 The first argument of the memcmp function is equal to the second argument. psymtab.c 1580
The first and second arguments of the memcmp () function are the same. Obviously here they wanted to write:
memcmp (&sym1->ginfo.value, &sym2->ginfo.value, sizeof (sym1->ginfo.value)) Wrong code that works correctly.
Static code analyzers work with the source code of the program and can find places where, from the point of view of a person, a mistake is made. What is interesting, despite the error, this code, thanks to luck, can work perfectly correctly. Let's look at one of these interesting cases.
struct event_location * string_to_explicit_location (const char **argp, ....) { .... /* It is assumed that input beginning with '-' and a non-digit character is an explicit location. "-p" is reserved, though, for probe locations. */ if (argp == NULL || *argp == '\0' || *argp[0] != '-' || !isalpha ((*argp)[1]) || ((*argp)[0] == '-' && (*argp)[1] == 'p')) return NULL; .... } PVS-Studio warning : V528 It is odd that the pointer to the 'char' type is compared with the '\ 0' value. Probably meant: ** argp == '\ 0'. location.c 527
We are interested in the following code:
.... const char **argp .... if (argp == NULL || *argp == '\0' || *argp[0] != '-' The literal '\ 0' is a terminal zero , which is used when you want to check the empty string or not. To do this, check the first element of the buffer containing the string, and if there is a terminal zero, then the string is considered empty. This is exactly what the programmer wanted to do here. But he did not take into account that the variable argp is not a pointer to characters, but a pointer to a pointer.
Therefore, the correct check should look like this:
*argp[0] == '\0' Or so:
**argp == '\0' However, if we write this code
if (argp == NULL || *argp[0] == '\0' || *argp[0] != '-' then it is dangerous. We need to add one more check to the null pointer:
if (argp == NULL || *argp == NULL || *argp[0] == '\0' || *argp[0] != '-' Now the code is correct. But note that it is redundant. If the first character is not a dash '-', then it does not matter what character it is. Anyway, the terminal is there zero or any other character. Therefore, we can simplify the code as follows:
if (argp == NULL || *argp == NULL || *argp[0] != '-' Please note that this correct code is equivalent to the code that was originally:
if (argp == NULL || *argp == '\0' || *argp[0] != '-' The difference is in how 0 is written. In the first case, it is NULL . In the second, this is '\ 0' . In essence, this is the same thing and the code behaves in the same way.
Funny. Despite the fact that the code was written incorrectly, it works absolutely correctly.
Wrong buffer size calculation
extern void read_memory (CORE_ADDR memaddr, gdb_byte *myaddr, ssize_t len); void java_value_print (....) { .... gdb_byte *buf; buf = ((gdb_byte *) alloca (gdbarch_ptr_bit (gdbarch) / HOST_CHAR_BIT)); .... read_memory (address, buf, sizeof (buf)); .... } PVS-Studio warning : V579 It is possibly a mistake. Inspect the third argument. jv-valprint.c 111
This error most likely arose in the process of refactoring. I would venture to suggest that at some point the code was approximately as follows:
gdb_byte buf[gdbarch_ptr_bit (gdbarch) / HOST_CHAR_BIT)]; .... read_memory (address, buf, sizeof (buf)); Then the sizeof () operator calculated the buffer size correctly. Then, they began to allocate memory for the buffer using the alloca () function. As a result, the sizeof (buf) operator does not calculate the size of the buffer, but the size of the pointer.
I think the correct code should be:
gdb_byte *buf; const size_t size = gdbarch_ptr_bit (gdbarch) / HOST_CHAR_BIT; buf = ((gdb_byte *) alloca (size)); .... read_memory (address, buf, size); But this is not the end, the most interesting is waiting for us next. I just decided to start to explain the essence of the error and how it could arise. Everything becomes more interesting if you show a few more lines below:
read_memory (address, buf, sizeof (buf)); address += gdbarch_ptr_bit (gdbarch) / HOST_CHAR_BIT; /* FIXME: cagney/2003-05-24: Bogus or what. It pulls a host sized pointer out of the target and then extracts that as an address (while assuming that the address is unsigned)! */ element = extract_unsigned_integer (buf, sizeof (buf), byte_order); As you can see, I am not the first to notice that something is wrong with this code. The error lives in this code at least since 2003. It is not clear why it is still not corrected.
As I understand, this comment relates to the line:
element = extract_unsigned_integer (buf, sizeof (buf), byte_order); When calling the extract_unsigned_integer () function, the same error was made that was considered by me above.
The PVS-Studio analyzer also gives a warning message on this line: V579 It is possibly a mistake. Inspect the second argument. jv-valprint.c 117
The analyzer generates two more warnings for the java_value_print () function code:
- V579 It is possibly a mistake. Inspect the third argument. jv-valprint.c 123
- It is a V579 version. It is possibly a mistake. Inspect the second argument. jv-valprint.c 129
Double assignment
FILE * annotate_source (Source_File *sf, unsigned int max_width, void (*annote) (char *, unsigned int, int, void *), void *arg) { .... bfd_boolean new_line; .... for (i = 0; i < nread; ++i) { if (new_line) { (*annote) (annotation, max_width, line_num, arg); fputs (annotation, ofp); ++line_num; new_line = FALSE; } new_line = (buf[i] == '\n'); fputc (buf[i], ofp); } .... } PVS-Studio warning : V519 The 'new_line' variable is assigned values twice successively. Perhaps this is a mistake. Check lines: 253, 256. source.c 256
Line new_line = FALSE; does not make sense. Immediately after this, the value of the variable new_line is overwritten by another value. Those. The following code snippet is extremely suspicious:
new_line = FALSE; } new_line = (buf[i] == '\n'); Apparently there is some kind of logical error. Or the first assignment is just unnecessary and can be deleted.
Typo
int handle_tracepoint_bkpts (struct thread_info *tinfo, CORE_ADDR stop_pc) { int ipa_trace_buffer_is_full; CORE_ADDR ipa_stopping_tracepoint; int ipa_expr_eval_result; CORE_ADDR ipa_error_tracepoint; .... if (ipa_trace_buffer_is_full) trace_debug ("lib stopped due to full buffer."); if (ipa_stopping_tracepoint) trace_debug ("lib stopped due to tpoint"); if (ipa_stopping_tracepoint) trace_debug ("lib stopped due to error"); .... } PVS-Studio warning : V581 The conditional expressions of the 'if' are agreed alongside each other are identical. Check lines: 4535, 4537. tracepoint.c 4537
If the variable ipa_stopping_tracepoint is TRUE, two debug messages will be printed:
lib stopped due to tpoint lib stopped due to error I am not familiar with how the code works, but it seems to me that in the latter case the condition should not use the ipa_stopping_tracepoint variable, but the ipa_error_tracepoint variable. Then the code will be like this:
if (ipa_trace_buffer_is_full) trace_debug ("lib stopped due to full buffer."); if (ipa_stopping_tracepoint) trace_debug ("lib stopped due to tpoint"); if (ipa_error_tracepoint) trace_debug ("lib stopped due to error"); Break operator forgotten
The classic mistake. In one place inside the switch, the break statement is forgotten.
static debug_type stab_xcoff_builtin_type (void *dhandle, struct stab_handle *info, int typenum) { .... switch (-typenum) { .... case 8: name = "unsigned int"; rettype = debug_make_int_type (dhandle, 4, TRUE); break; case 9: name = "unsigned"; rettype = debug_make_int_type (dhandle, 4, TRUE); case 10: name = "unsigned long"; rettype = debug_make_int_type (dhandle, 4, TRUE); break; .... } .... } PVS-Studio warning: V519 The 'name' variable is assigned values twice successively. Perhaps this is a mistake. Check lines: 3433, 3436. stabs.c 3436
Regardless of whether we are working with the type "unsigned" or "unsigned long", we will give the type the name "unsigned long".
Correct code:
case 9: name = "unsigned"; rettype = debug_make_int_type (dhandle, 4, TRUE); break; Tangled case
In the code shown below, the alt variable is twice assigned a value, since there is no break between two cases . But according to the comment, the programmer does not specifically use break . Consider incomprehensible to me code:
static int putop (const char *in_template, int sizeflag) { int alt = 0; .... switch (*p) { .... case '{': alt = 0; if (intel_syntax) { while (*++p != '|') if (*p == '}' || *p == '\0') abort (); } /* Fall through. */ case 'I': alt = 1; continue; .... } } PVS-Studio warning: V519 The 'alt' variable is assigned values twice successively. Perhaps this is a mistake. Check lines: 14098, 14107. i386-dis.c 14107
So, comment / * Fall through. * / says that the break statement is not needed here. But then it is not clear why the alt variable is assigned the value 0. Anyway, then the value of the variable will be replaced by one. And between these two assignments, the alt variable is not used at all. Unclear…
Here either a logical error, or the first assignment should be deleted.
Conclusion
Long live PVS-Studio for Linux! As you can see, now I can show the benefits of static analysis not only for open Windows projects, but also to help the Linux open source community. I think that soon our list of articles on proven projects will be replenished with a large number of articles about programs from the Linux world.

In order not to miss anything interesting I invite you to subscribe to my twitter @Code_Analysis .

If you want to share this article with an English-speaking audience, then please use the link to the translation: Andrey karpov. Only a few bugs found by PVS-Studio .
Read the article and have a question?
Often our articles are asked the same questions. We collected answers to them here: Answers to questions from readers of articles about PVS-Studio, version 2015 . Please review the list.
Source: https://habr.com/ru/post/310156/
All Articles