Features of the use of machine learning in the protection against DDoS attacks

This post was prepared based on the speech of Konstantin Ignatov , Qrator Labs, at the partner conference "1C-Bitrix" .
Let's say a DDoS attack has started on your site. How do you find out about this? How does your security system determine that you are attacked? What are the ways to protect? What sequence of actions and events should occur in the event of an attack?
')
As a rule, the resource owner learns about the attack only at the moment when dissatisfied users start calling. Most companies find this situation unprepared. At the time of the fire, it is too late to work out a rescue plan, and everyone rushes to find a universal remedy that will be at hand. But the “magic pill” against DDoS, which would instantly fix the problem, no. It is necessary to prepare in advance.
DDoS protection is a process. It is necessary to start it not when the attack happened, but strongly in advance. Obviously, this process is related to information security.
What does the term "information security" mean?
In this context, we are talking about opposition from two parties. Malefactors (competitors, extortionists, dissatisfied users) want your website to stop working at least for a while (went downtime). The owner of the resource wants 100% availability without interruption.
There are two basic principles of information security:
- Try to think like a criminal, that is, mentally try to take the side of those people who want to send the site to downtime. We need to understand how they will do this, what data they may need, what steps they will take.
- As often as possible ask yourself the question: what can go wrong in a given situation; what could break if we do anyway; what problems will lead the connection of a component; what are the disadvantages of used solutions.
DDoS protection process
DDoS-attack is aimed at the exhaustion of limited resources. These can be any resources:
- The number of SMS your phone can receive.
- The size of the RAM.
- Channel capacity.
- Anything.
Fully shift the problem of countering DDoS to the provider of the relevant service will fail. You need to think about it at the design stage of the system. A large team of people should work on the problem of protection:
- Network engineers must ensure that the channel capacity is enough for at least legitimate traffic, and so that at the same time there is a reserve.
- Web application developers must ensure that a single request does not lead to the exhaustion of all RAM. A crookedly written software can play a bad service and lead to the failure of the site, even if you use the most modern system of countering DDoS.
- Information security specialists must protect (make hidden, make sure that it does not light up) the IP address where your server is located.
Let us consider how DDoS attack systems work on the example of Qrator Labs, a 1C-Bitrix partner company, which provides a traffic filtering service. You can find out her secure IP address in your personal account in 1C-Bitrix. Then you can transfer your DNS to this address. The old IP address will continue to work. One of the tasks of the external security service is that no one knows this old IP address. Because as soon as it starts to “glow”, attackers can attack an Internet resource bypassing the Qrator protection. For such cases, there are also solutions, but their cost is higher.
Besides the fact that protection against attacks must be developed in advance, the process of protection itself should be automated. Attackers tend to rarely focus on a specific site. They all put on stream, written universal scripts. They automatically scanned many sites, found some vulnerability on yours and decided to attack. Launched the script, went to sleep - the attack is not difficult. But the development of protection tactics can take several hours, even if you have a very strong team of specialists. You make changes to your site, the attack is reflected. The attacker wakes up after a few hours, changes a couple of lines in his script, and you will probably have to think again how to defend yourself. And so in a circle. It is unlikely that your specialists will withstand more than 48 hours in this mode. After that, you have to resort to expensive means of protection, because the connection under attack always costs more. To neutralize the attack, when it is already in full swing, it is quite possible, but it is much more difficult, and downtime can not be avoided. External providers of such services, as a rule, use automation, since "Manual" means almost never save.
Machine learning for automation
When we talk about automation in modern systems to counter DDoS attacks, the use of machine learning technologies is almost always meant. The use of machine learning is necessary to neutralize application-level attacks (L7). Most other types of attacks can be neutralized using brute force. During an Amplification attack, many identical packets enter the channel. No need to use artificial intelligence to understand where the package is from the legitimate user, and where the garbage. It is enough to have a large channel capacity to skip and filter out all bad traffic. If there is not enough capacity, a third-party geo-distributed network, such as Qrator, which will take on excess traffic, filter garbage and give away “clean” packets from legitimate users, may be useful.
Attack on the application occurs on a different scheme. An application can receive many different requests with a large number of parameters. If there are a lot of them, this thread disables the database. To solve a problem, you need to be able to recognize where requests from real users, and where from bots. This task is extraordinary, because at first glance they are indistinguishable. In her decision the most effective use of machine learning.
What is machine learning?
First of all, it is just a set of algorithms that has two phases:
- The first phase is learning when we tell our algorithms what they should do.
- The second phase is the application of "knowledge" in practice.
Algorithms are of three types:
- With feedback from the person (training with the teacher) - we tell our algorithms what to do, and then they learn. Used for classification and regression tasks.
- With feedback from the data (learning without a teacher) - we simply show the algorithm the data, and he, for example, finds anomalies in them, or groups these or other objects at his own discretion. Used to solve problems of clustering and search for anomalies.
- With feedback from the medium (control theory). For example, when you choose the degree of scaling resources based on the number of links to the site on Twitter today. That is, you maintain a certain constant level of load on one server on average.
As an example of a machine learning task, I took statistics on the level of input traffic from one of our clients (top chart). And on the lower graph there is a forecast based on test data (highlighted in blue area at the beginning of the curve).
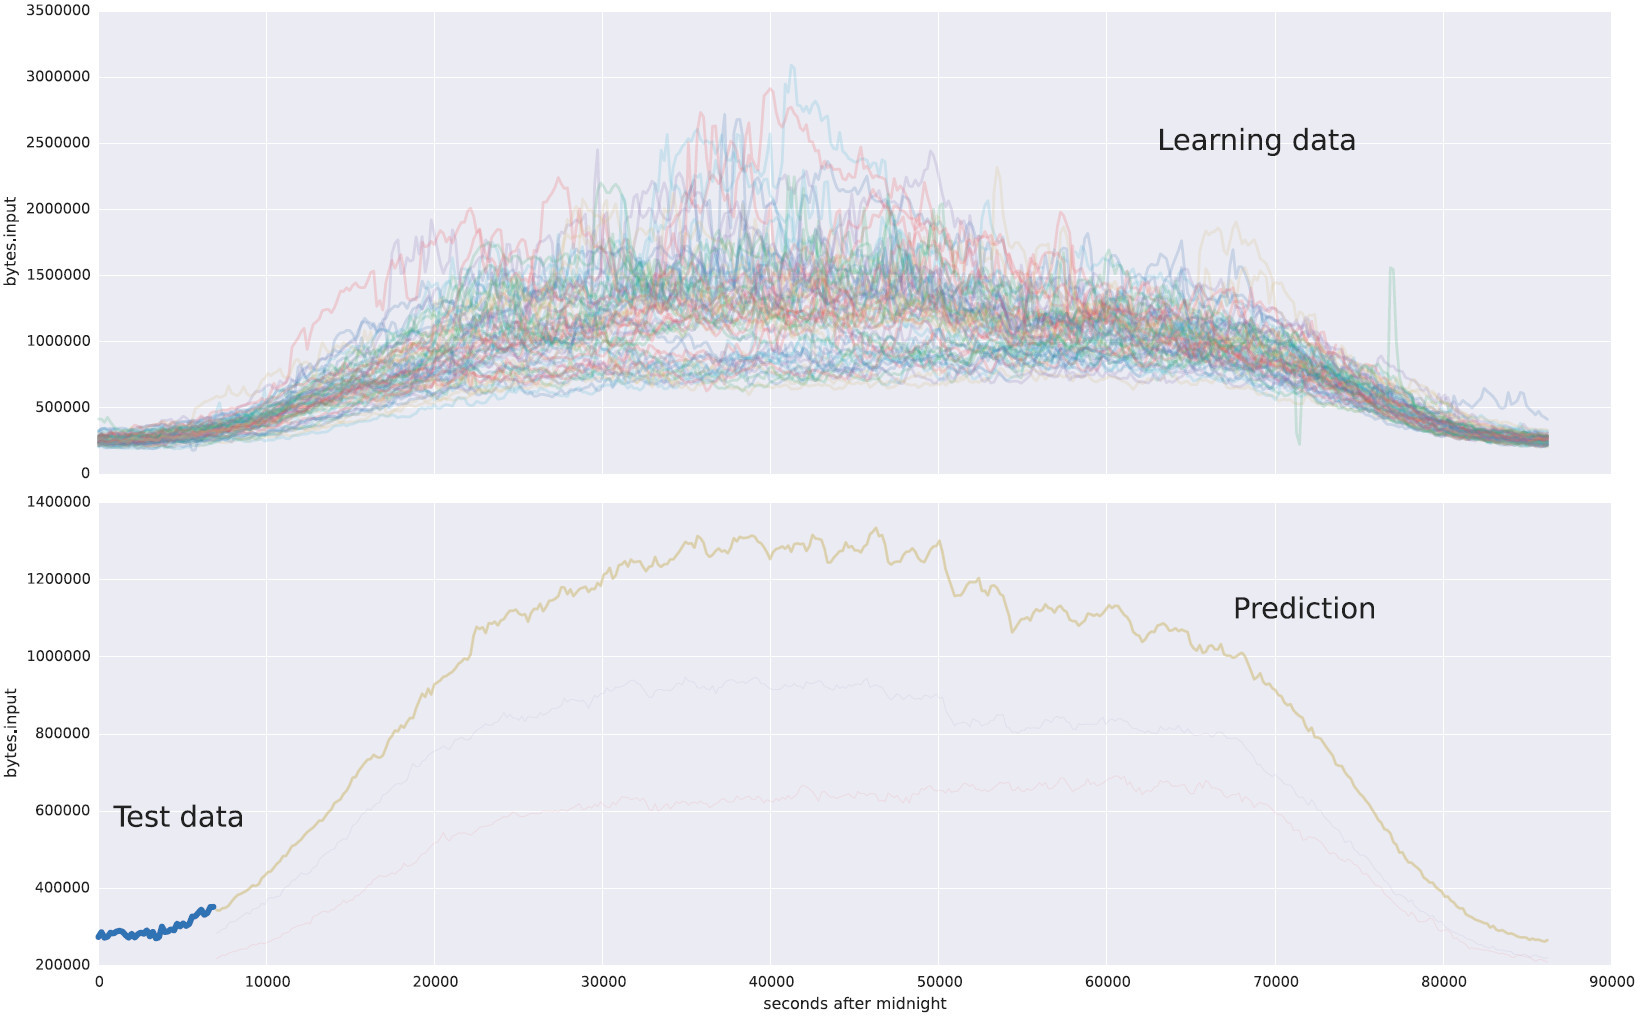
The top shows daily changes in traffic volumes. In the second picture, we look at the load start schedule, the algorithm predicts how traffic will continue. This is an example of regression.
The influence of intruders on the learning process
With the help of machine learning algorithms, an estimate of the expectation, variance, or other numerical characteristics of the distribution of a random variable is calculated.
To comply with the principles of information security, the algorithm must operate in accordance with two basic requirements:
- At the first stage, the algorithm should be able to ignore anomalies that may appear in the original data.
- At the second stage, when the algorithm is already working on our problem, we want to understand why he made this or that decision. For example, why he referred the request to the category of legitimate.
In our case, training data is information about user activity. This means that attackers can affect at least some of the data on which we are going to learn. But what if they get a great idea: to influence the overall statistics so that our algorithms learn exactly what the attackers want? This may well happen, and therefore it is necessary to prevent this possibility in advance.
Here is an example from our internal report on strange activity from one of our clients.
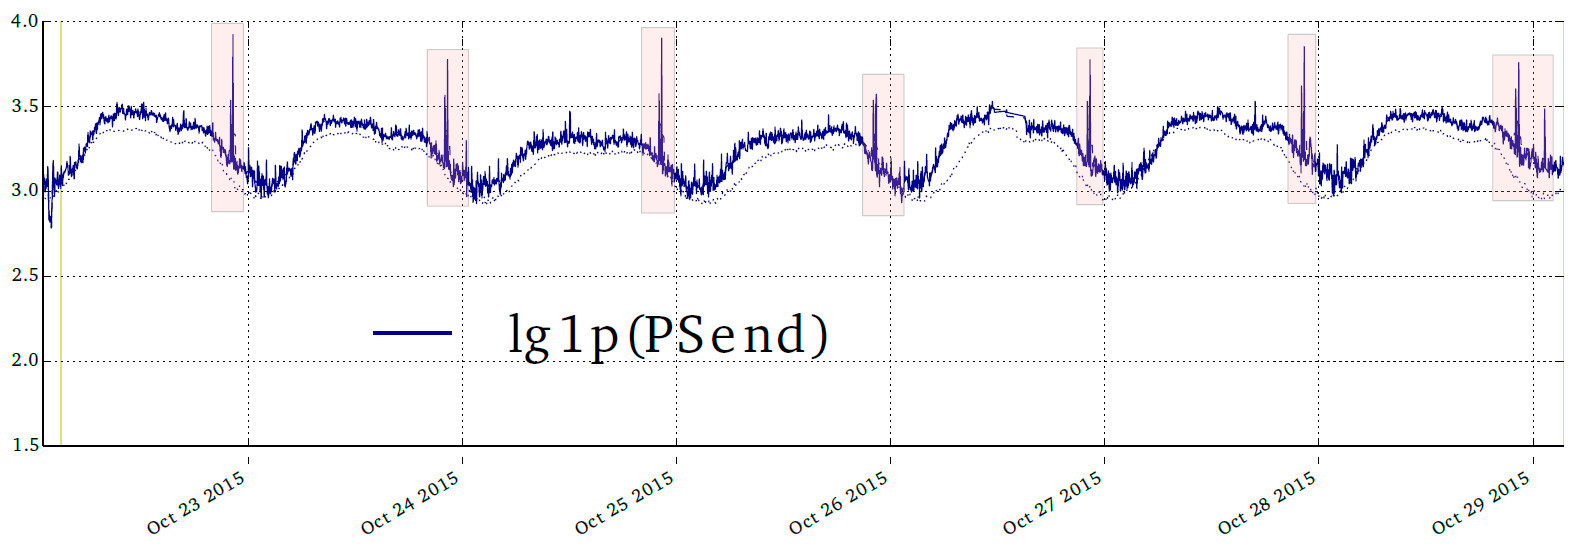
Every evening, at the same time, the number of packages increased. Not deadly, the site continued to open, the load was on the verge of permissible (on the graph is a logarithmic scale). Anything could be the reason for this: most likely, the sysadmin confused something, wrote down the operation of saving daily backups for a certain time to cron. But maybe someone is trying to teach our algorithms to skip illegal traffic.
To be able to do so and to be able to defend oneself from this is not an easy task, the best minds work on solving them, there are already quite a few scientific articles on this topic on the Web. Nobody has yet been able to teach our algorithms to “bad” and we are ready for someone to try. Now I will tell why the attackers did not work.
How to deal with it?
At the first stage (training), such concepts as robustness and breaking point become important.
Robustness is a measure of how easily you can affect a predictable estimate.
Breaking point - the number of samples in the training sample, sufficient to distort the assessment.
Although both terms are very close to each other, the second one is closer to us. It means the number of distorted, incorrect elements in the training sample - those basic data on which we study - allowing to influence the prediction results.
If the breaking point is zero, then the algorithm may break on its own. If the breaking point is equal to one, then it is enough to throw a single incorrect request, and the system will not predict what it should.
The higher the value of the breaking point, the more difficult - and therefore more expensive for the attacker - to affect the learning of algorithms. If we have trained our system in such a way that breaking point is high, the issue of counteraction moves to the economic plane. Wins the one who spent less money.
Ideally, protection should cost very little, and overcoming it should be very much.
At the second stage (testing the algorithm), you need to remember that everything can go wrong, as planned. Sometimes you have to analyze after the fact, and what happened after all. Therefore, it would be nice to be able to force the algorithms to “tell” how they worked and why. The explanation of the actions of the algorithm helps to “look after” the automated process, and also facilitates the tasks of testing, debugging and investigating incidents.
Data collection
Machine learning algorithms need data. Where to get them? Basically, here we have everything at hand ...
What kind of data you need to collect?
First of all, it is necessary to monitor all exhaustible resources:
- number of compounds;
- traffic volume;
- free memory;
- CPU load;
- other exhaustible resources.
It is easy to collect and store such data - there are many tools for this. The amount of such data is predictable. If you record one megabyte of telemetry data every minute, then even after the start of a DDoS attack, you will still record one megabyte. If you are not doing this yet, then it's time to start.
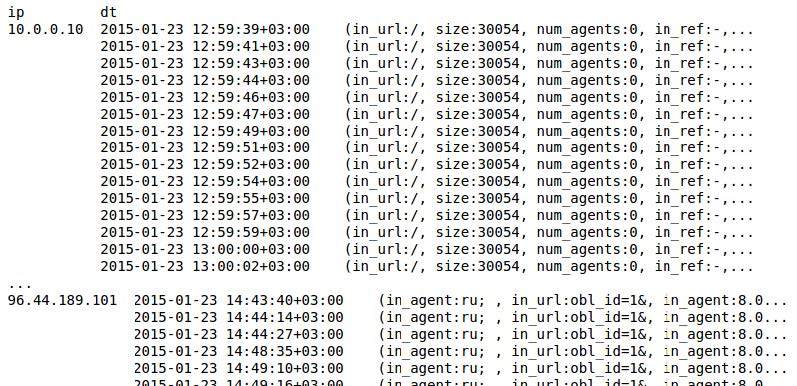
The second type of data for analysis is user behavior, which is reflected in the logs (basically, it is access.log and \ or log, which stores database requests). They should be in a machine-friendly format.
Unlike telemetry, the volume of logs grows at least linearly with the number of requests. This can be especially sensitive during a DDoS attack, when resources are sorely lacking. Your CPU is 100% loaded, and then the system is trying to save 2GB of logs. It is necessary to make so that this task in critical situations either does not start or is interrupted. But not bad after all, that at least some logs are kept even under attack.
Not all logs can be stored, but only a part. But you need to approach this wisely. It makes no sense to record every tenth request, you need to save sessions. For example, you can calculate a non-cryptographic hash from an IP address and save only a certain range of these hashes: let a non-cryptographic hash take values in the range from 1 to 100. We start by saving all queries. If we do not have time, we only save requests from those IP addresses whose hash is in the range of 1-90. Reduce the interval until we can cope with the flow.
Also, at least a small sample of the logs of the "pure behavior" of the system (that is, not under attack) is always needed. Even if you do not keep them, you can periodically record a small dump in order to have an idea of how users behave when there is no DDoS attack on you.
What useful can we learn from the stored telemetry and logs?
Based on telemetry, we can teach the algorithms to determine when server resources are close to exhaustion. If there are logs, we can analyze the difference between the behavior of intruders and ordinary users. We can group users in different ways, for example, choose those who have a greater burden, but do not bring income. Why this may be needed? If the server does not cope with the normal load at all (when there is no attack), then, unfortunately, you have to ban someone from the legitimate users. Whom? Obviously not those who now click "buy."
Examples of tasks
In practice, algorithms are usually not used separately, but put together in a chain of tasks (pipeline): what is obtained from the output of one algorithm is used as input data for another. Or the results of one algorithm are used as parameters for setting another.
Consider examples of tasks that are decomposed into chains.
Task number 1. Estimate future planned load on the site
The task is decomposed into the following steps:
- Understand what the load is and how it changes depending on time, day of the week. As a result, we need to get several types of load. For example, the workload on workdays, on weekends, during and immediately after the presentation of the new IPhone.
- Assess what type the current load level is (we assume that there is no attack at the moment)
- Predict the planned value based on the available data on the current load and its type.
Task number 2. Decide whether to ban someone if we see signs of an attack
At the moment we know for sure that there is an attack. Perhaps you should block some of the IP addresses that are involved in the attack. But aggressive blocking leads to the fact that some legitimate users will be banned. This situation is called False Positive, and you should strive to keep as few cases as possible (the algorithm is wrong - False - assigns the user to the group of people who cause harm - Positive). If the server is able to “digest” the attack (that is, to process all requests) without consequences for users, then nothing needs to be done. Therefore, it is necessary to assess the ability of the server to withstand the attack without downtime. The task is decomposed into the following steps:
- Determine the dependence of the number of errors \ failures on the number of requests.
- Determine how many queries need to be filtered.
Obviously, this task is a part of the chain, which leads to the achievement of the main goal - server availability. In the next step, for example, you need to decide which particular requests to block.
Task number 3. Requests from which real users can be filtered with less loss to the business if the server does not cope with the legitimate load
In this task, we consider a situation where the legitimate load on the server is greater than it is able to withstand (even without taking into account malicious traffic). Such situations, unfortunately, happen. To solve this problem, you need to go through the first two steps of Task 2. That is, this task is also part of a certain chain.
Then we follow these steps:
- Select the signs of the sessions. For example: did a visitor come to the checkout page, did he follow a link from an advertising campaign, did the user log in to the site. We make a table of all sessions and their signs for a long period of time.
- Mark the session in importance.
Ideally, it would be good to calculate the probable profit from each session of the current one in order to ban only those who are least important. But in practice, heuristics are usually used and they simplify the task - they block those users whose sessions have less important features.
Let us dwell on the task number 1
Remember the graph, which shows the input load on one of our clients? In fact, for the sake of beauty, it is purified. The real schedule looks like this:

We see a lot of huge bursts, several orders of magnitude higher than the usual level of load. It also shows that the load is not constant, the days are very different. That is, the task of building a robust model based on such data is nontrivial.
On this topic, written mountains of articles and conducted a lot of research. But there is no generally accepted ideal solution.
The following approaches can be used:
- The use of absolute deviations.
- Robust normalization.
- Nonlinear reversible transformations (sigmoid).
- "Heavy tails" when you need an assumption about the distribution.
- Sampling to reduce the likelihood of “bad” samples entering the training set.
As a rule, you can accept that
- in algorithms based on trees breaking point <minimum leaf size;
- when clustering breaking point <minimum cluster size.
For example, if you apply a robust normalization and nonlinear reversible transformations, you get this:

Above - the original data. The second graph is the result of robust normalization. With its help, we reduce the influence of anomalies. The last plot is the result of a non-linear reversible transform. We already understood that we have an anomaly on the second chart, after which its absolute value does not interest us much anymore. We cut it with a non-linear transform. We get data that is much easier to work with.
This same graph can be visualized as a color picture.

This picture is read line by line from left to right, top to bottom. Horizontally - seconds from the beginning of the day, vertically - dates. Yellow and red (for example, in the upper right corner) show a high load.
After applying the above approaches, we can group different days by load level and cluster them.

We can see three different types of load, which are more clearly reflected in the following illustrations.
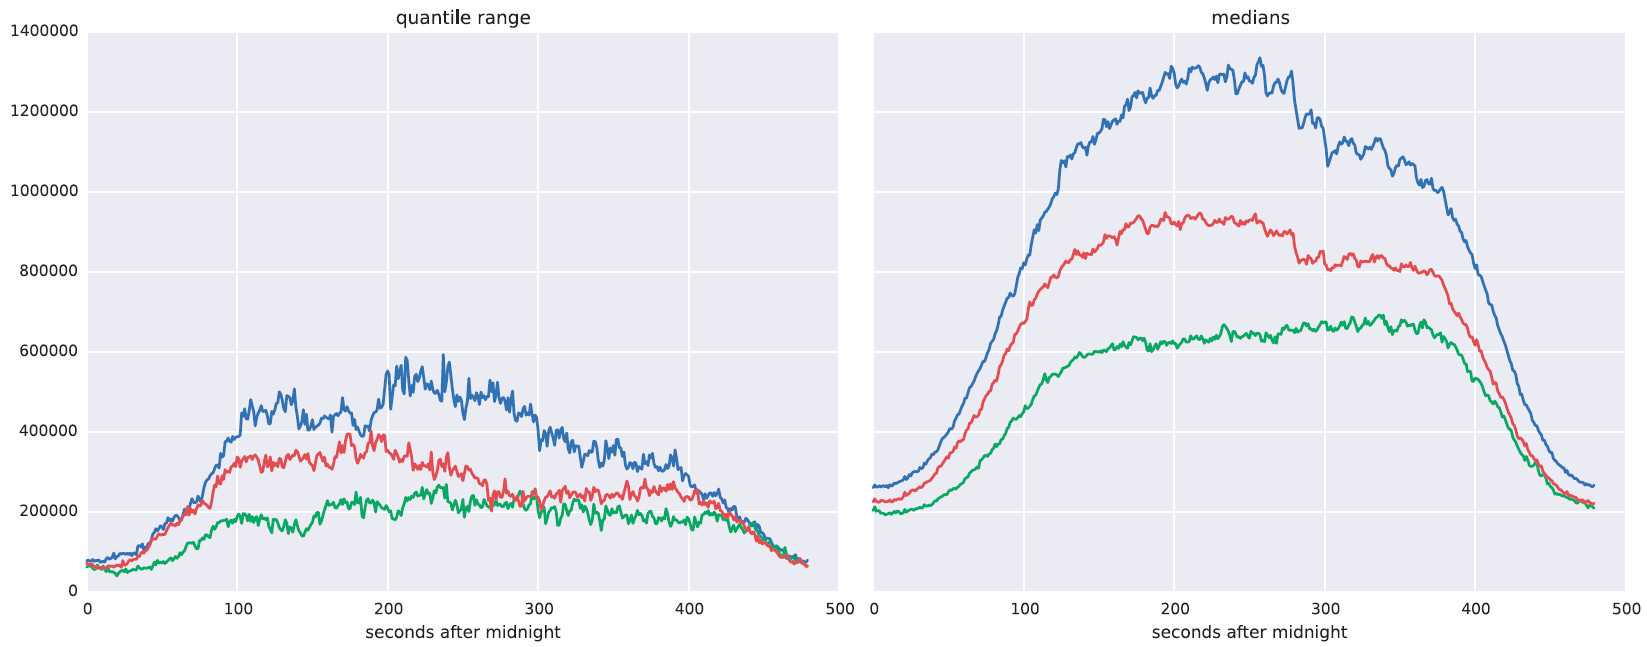
Right - the expected load on different types of days. On the left - a robust analogue of standard deviation (quantile variation).
Apply this to the real situation. The purple line represents the load for a period of time. It is closest to the blue dotted curve. That is, this is the type to which you need to navigate when forecasting the load.

Search for groups of features
Working with logs is more difficult, because the information in them is stored in the form of complex nested structures. Logs for machine learning are not suitable without prior preparation. Depending on what our task is, we can select features either from requests or from sessions.
In the first case, we analyze each request separately, we are looking for, for example, signs of illegitimate bots ... In the second case, we analyze, in fact, the behavior of users.
Examples of feature requests:
- static or dynamic query
- request processing time
- the amount of memory required to process this request
Examples of session signs:
- does the visitor use the latest browser version
- whether the interface language of his browser coincides with the language that he chose in the settings on the site;
- whether the visitor loads statics;
- how many times favicon.ico is requested;
- whether the visitor came to the checkout page.
These are simple signs, we know about them before the beginning of the analysis, and they can be obtained using an elementary function that accepts a request or session and returns an array of values of specific attributes. But in practice, such signs are not enough for analysis. We need to extract more information, that is, it is necessary to learn how to highlight new features that we don’t know yet.
For example, if the log contains a part of requests whose URL ends with / login, then we can select this as a sign and mark each request on this basis (mark one or zero - the request URL for / login ends or not). Or we can mark the requests that came from the site example.com, units, and all the rest - with zeros. Or we can single out a sign by the duration of the request processing: long, fast and medium.
That is, in fact, we look at the data and try to understand what signs we may need. This is the essence of the process of so-called feature extraction. The potential signs are infinitely many. At the same time, any group or set of signs also forms a new sign. This complicates the task.
So, the task is divided into two subtasks:
- important traits are required;
- select groups of signs, each of which is essentially also a sign.
In reality, it might look like this:
In the picture above, requests are turned into signs. In the next picture, we grouped the signs, selected new ones, and calculated how often they occur.
In this problem, we analyzed about 60,000 queries (which is not so much, but this is just an example).

The right column indicates how many requests correspond to this group of features. It can be seen that the number is different, and that one request can fall into several groups. That is, there are requests that do not fall into some groups. We mark each request with an array of ten zeros or ones. A one means that the request matches the group, zero means that it does not fall into it. Thus, we get an array in the form of a matrix of 60 00010. This numeric information can also be operated as described above.
To highlight such signs, special algorithms are used. I will not describe them in detail here.
The general idea is to convert the log to a special database. This database should be able to respond to a number of requests. For example: to find in the log for all elementary characters all their possible combinations satisfying a certain criterion, and sort them by frequency of occurrence.
Another type of database does not work with sets, but with sequences. This is necessary for analyzing sessions, because a session is, in essence, a sequence of requests. Such a database is able to select all the subsequences of a certain type. For example, a query to it: find in the log among all subsequences in all sessions such that satisfy a certain criterion, and sort these subsequences by the number of sessions in which they met.
The third type of database allows you to work with transitions from one part of the site to another within one session. That is, each session is now a graph. The database should be able to find all the subgraphs that meet certain criteria, and sort them by the number of sessions in which they met.
This process is called pattern discovery. The patterns are sets, sequences or graphs.
With this analysis, you can find the user groups of interest. The result of this analysis can be studied even manually.
It is necessary to prepare for all this in advance.
I emphasize once again that all this will take time. DDoS protection cannot simply be taken and turned on (at the time of the attack) - it needs to be prepared in advance.
You need to find the right people and train them. It is necessary to collect data that can be used for training. You may need to study something, look manually, find bottlenecks. Protection algorithms need to be trained. It is necessary to verify that the server or, for example, the mail daemon does not "shine" an unprotected IP.
All of this is part of a large process and cannot happen instantly.
On the other hand, I want to note that the results of the work of the DDOS protection system can be used for business intelligence. For example, to give to the marketing department these groups of users, whom we decided not to ban, because they generate income.
Source: https://habr.com/ru/post/310084/
All Articles