Zabbix 3.2 released
We would like to inform you about the release of a new version of the open source monitoring system Zabbix. The release is fundamentally new features such as:
- Additional event fields (tags)
- Manual closing problems
- Event correlation
- Nested host groups
- Determination of individual conditions for creating accidents and their recovery
- Non-strict calculation of trigger expressions
- Interface in loadable modules for replicating historical data to external storage
…and much more. Under the cut a brief talk about some of the innovations
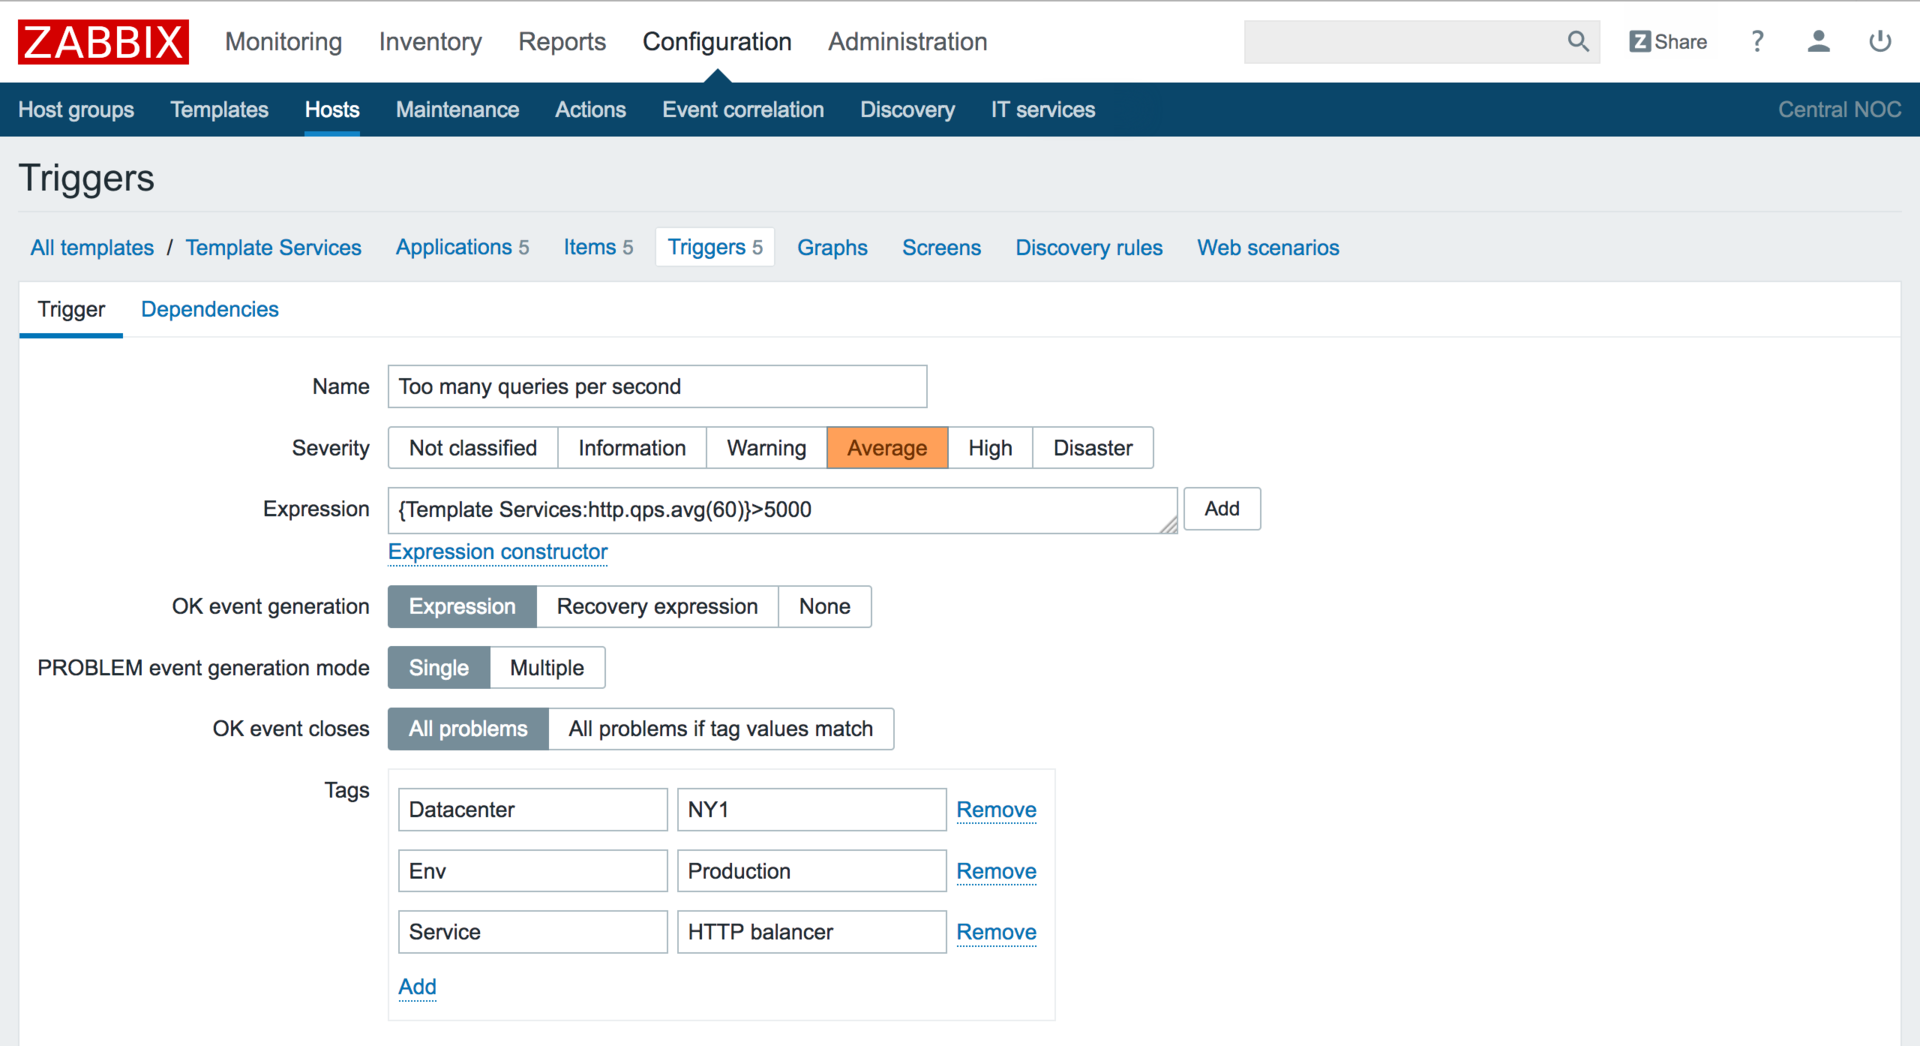
Event tags
The new version has a basis for displaying, filtering and other actions on trigger events - tags. The first time you stumble upon them when setting up triggers:
')
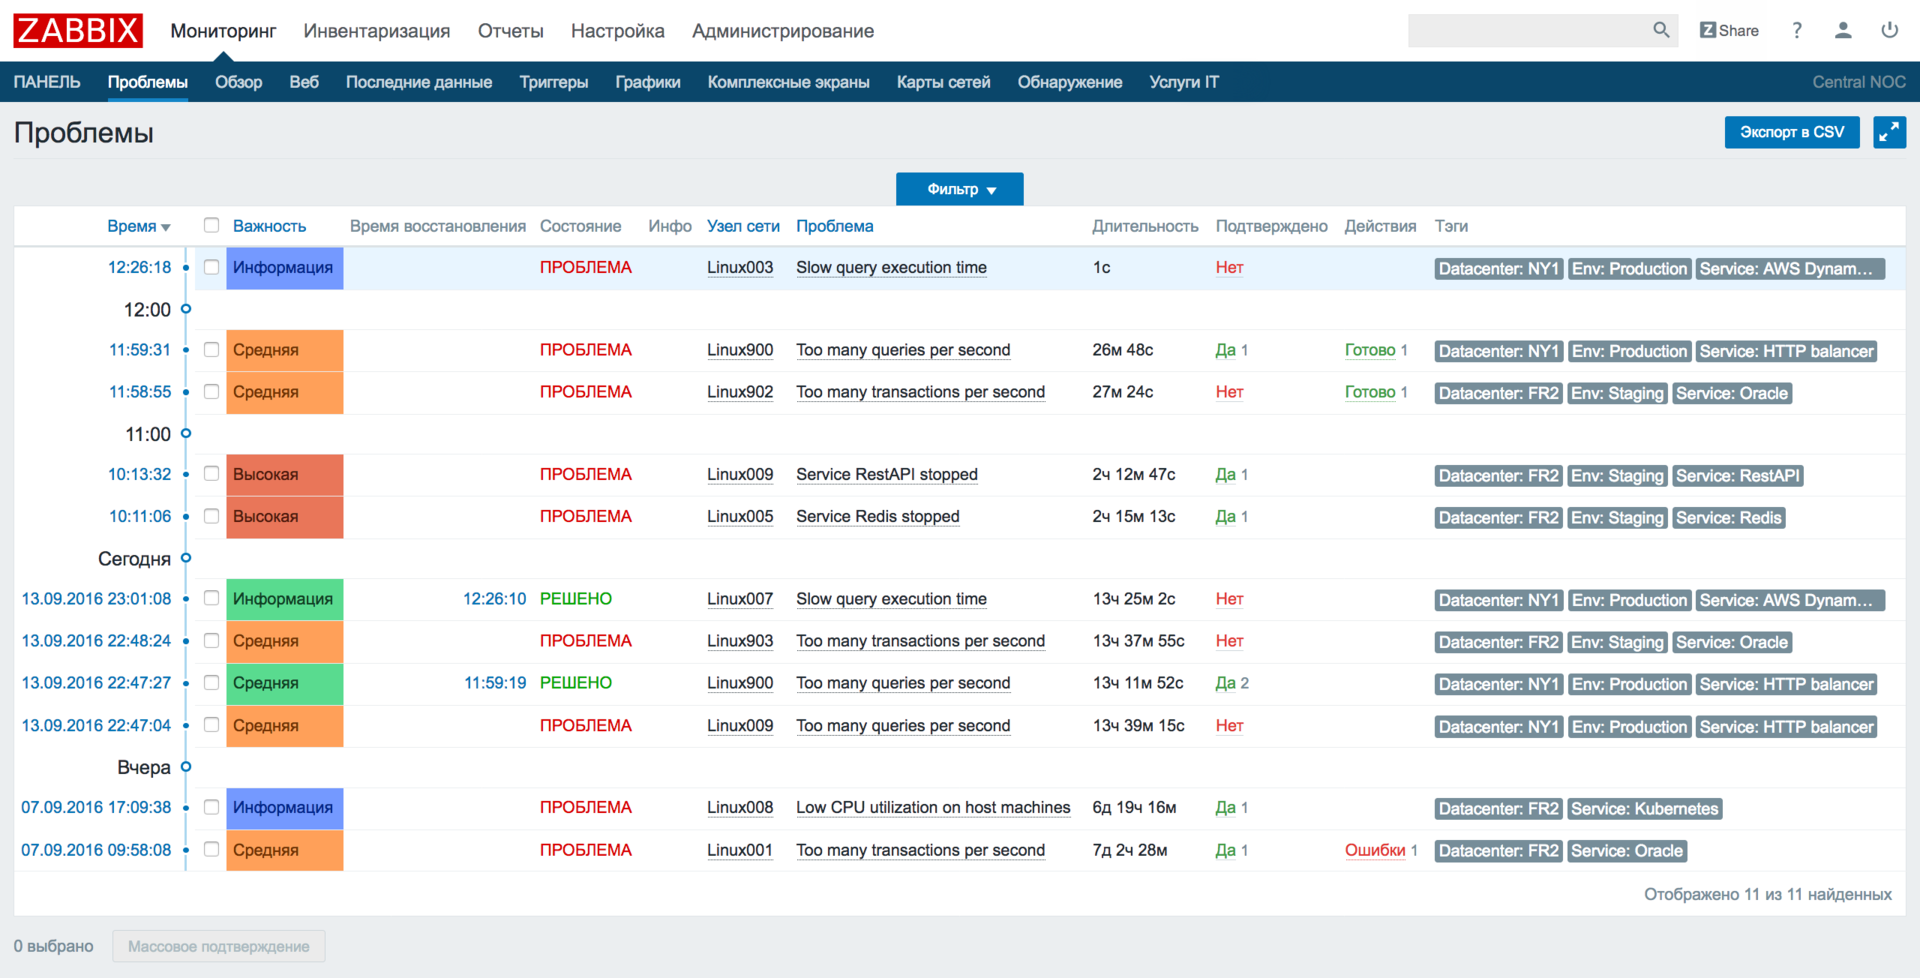
And then you can see them again in the new section Monitoring -> Problems .
Think of tags as additional event fields that can also be used to filter when displayed or under automatic action conditions (and conditions for sending notifications and their escalations), and most importantly, they can be used to correlate various accidents.
Event correlation
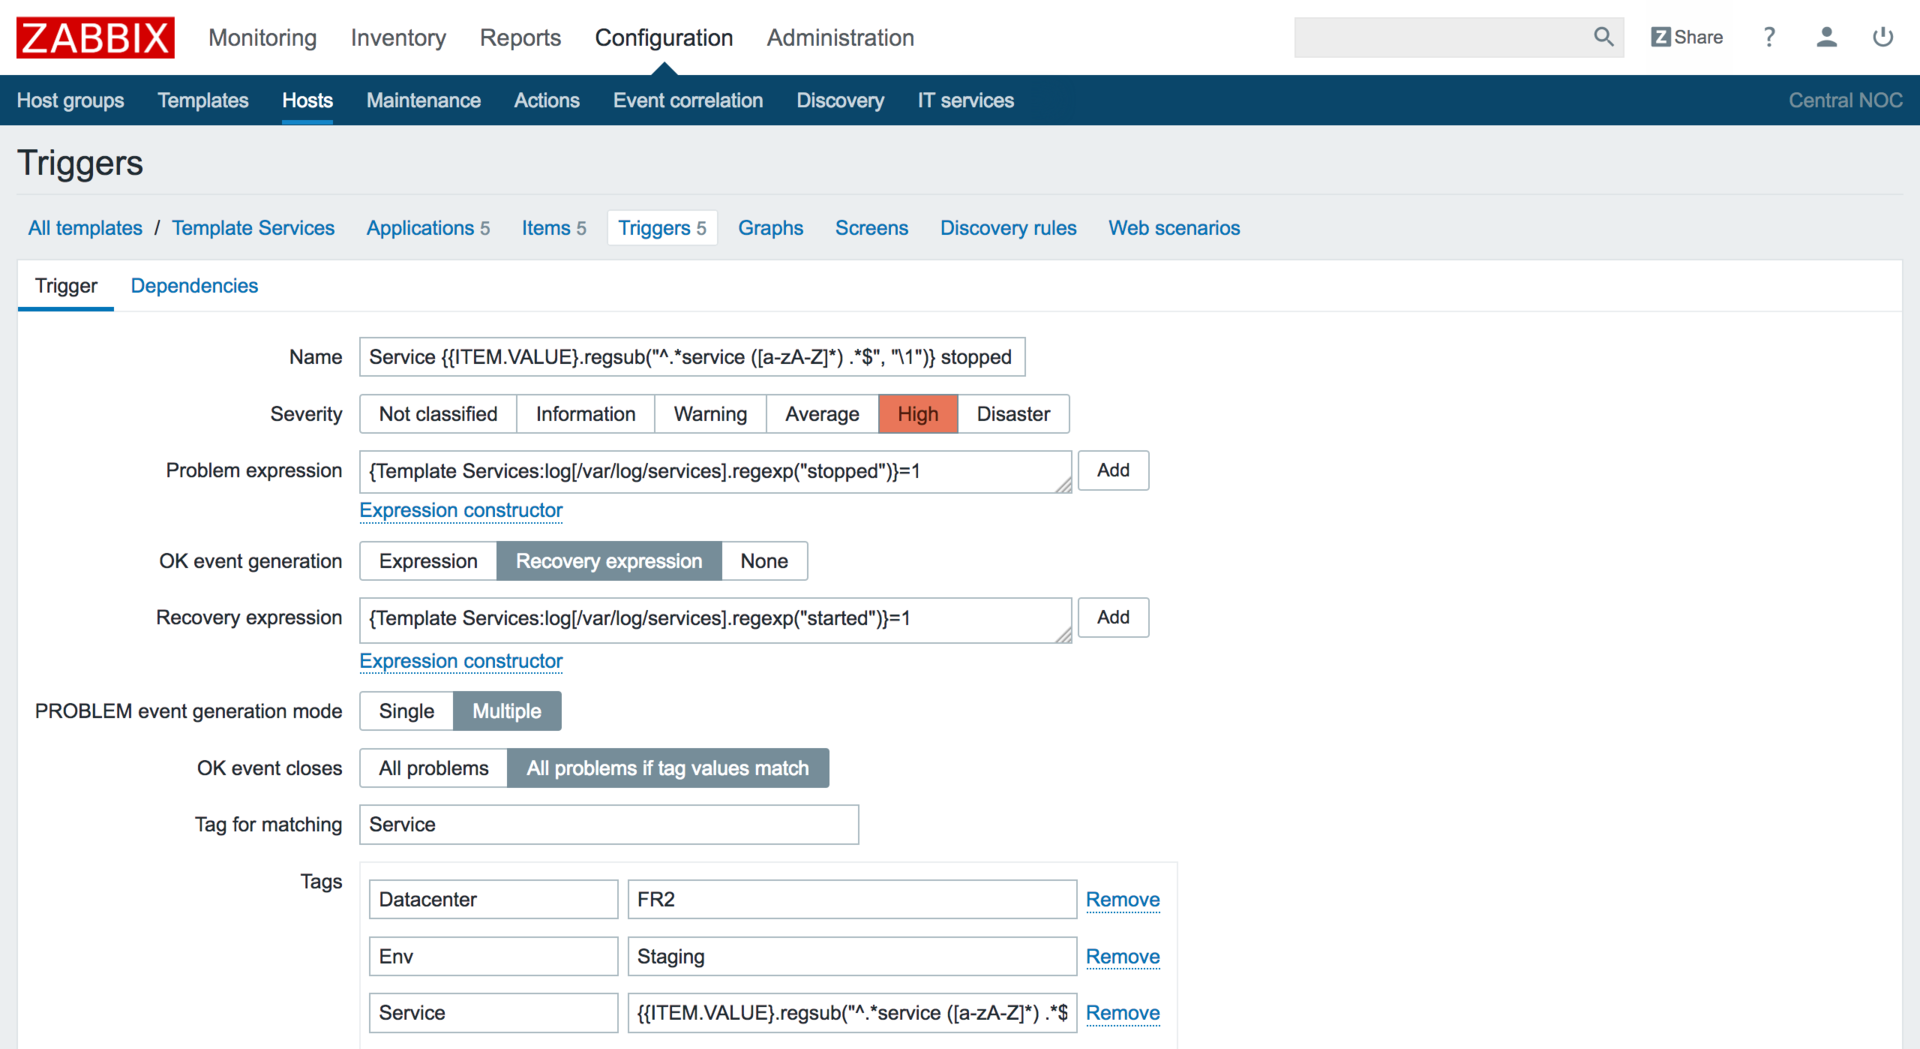
Now it is possible to use a single data element to track a multitude of unrelated events. A unique identifier in Zabbix will be the tag value that will allow you to connect together the occurrence of a specific problem with an event announcing its end. So, it's okay if several applications are written to one log file - the crashes of each application will be created and restored without interfering with each other. Another useful application of this functionality is the processing of SNMP traps.
Global correlation
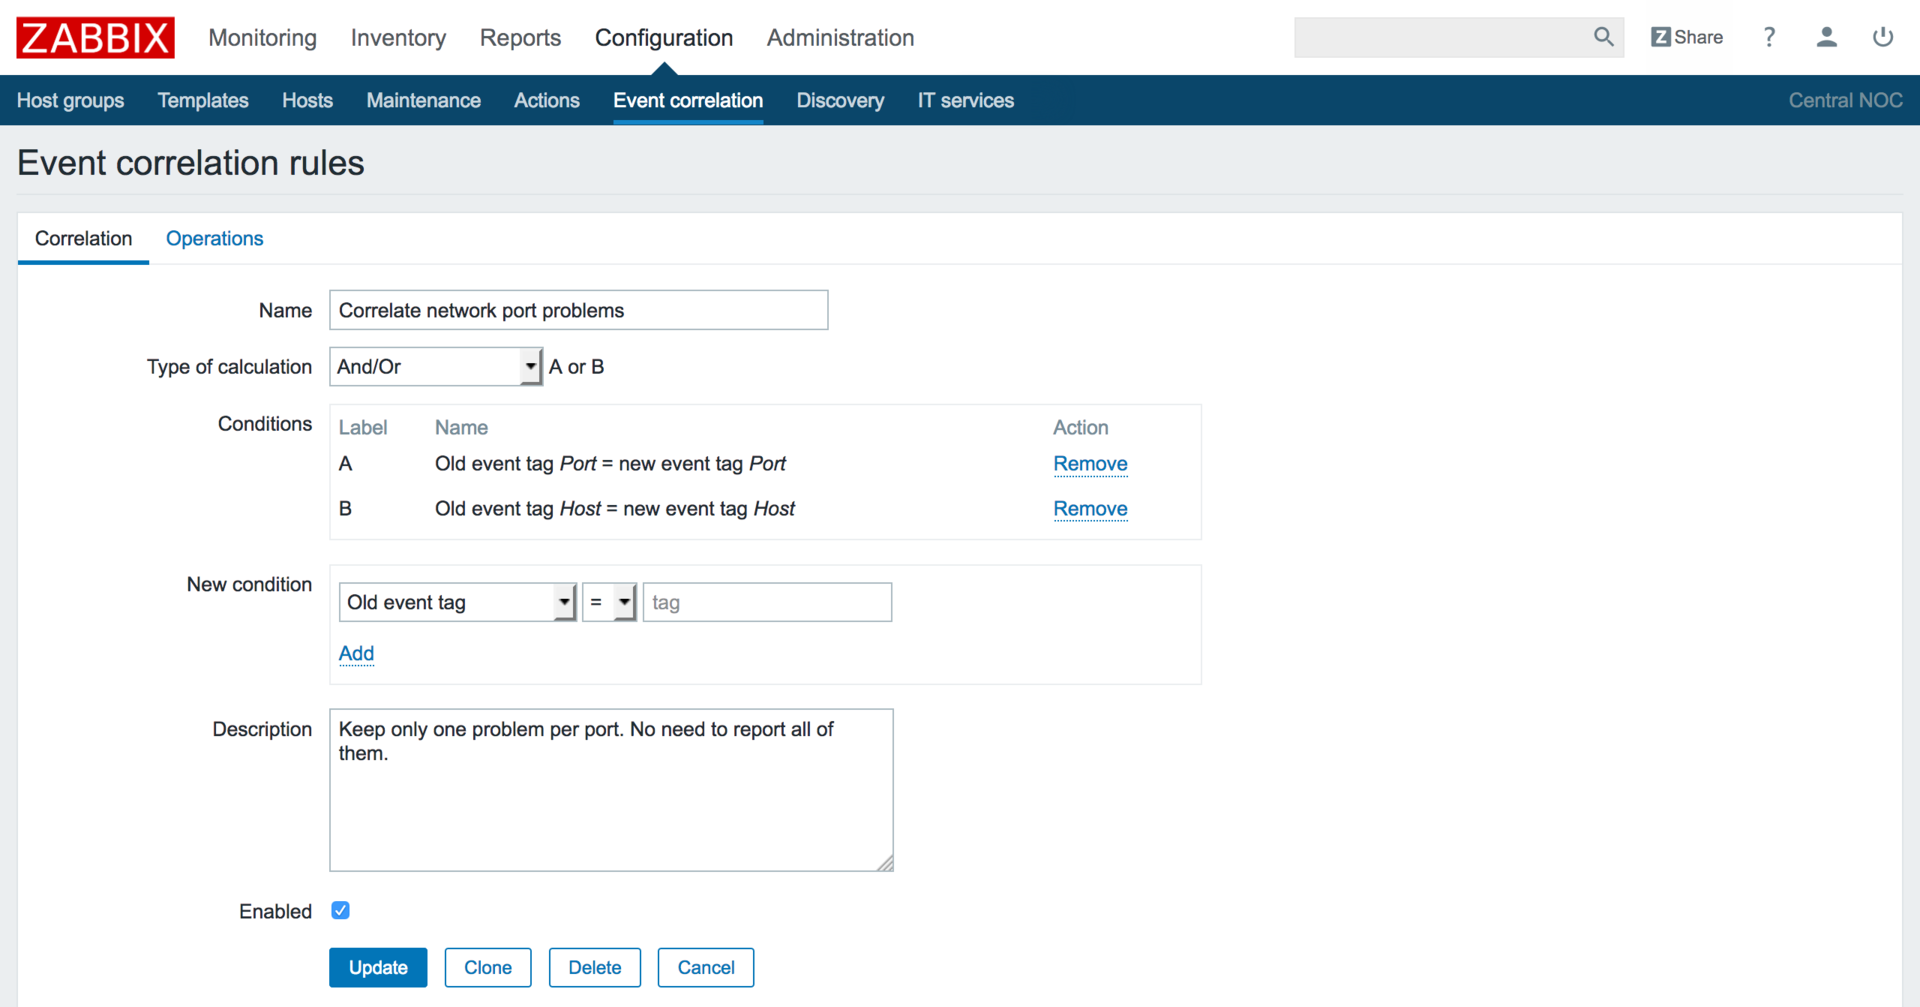
There was also an opportunity to connect among themselves the events arising from completely different triggers and even on different nodes of the network. The new configuration section "Correlation of events" will not allow a critical accident, the very accident that you want to see, and requiring action, to drown in the stream of sprinkled symptoms. All redundant incoming events will be correlated and removed from sight. And yes, this is also customizable based on tags.
Nested host groups
Nested host groups will create a hierarchy of monitoring objects,
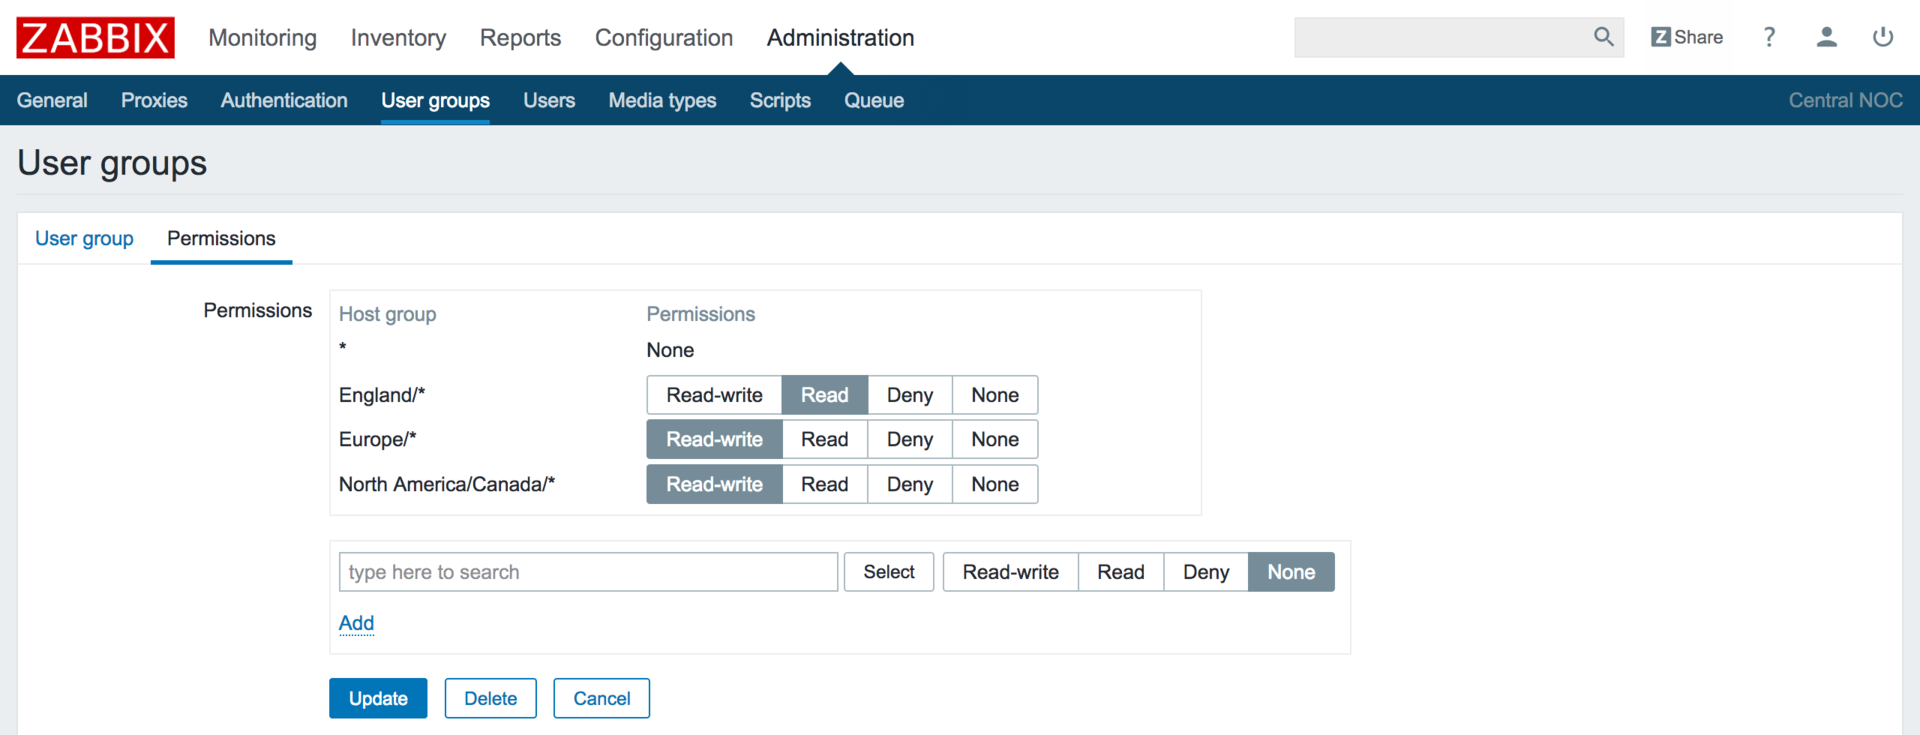
This will simplify both navigation and access rights management inside Zabbix.
New quick open problems screen
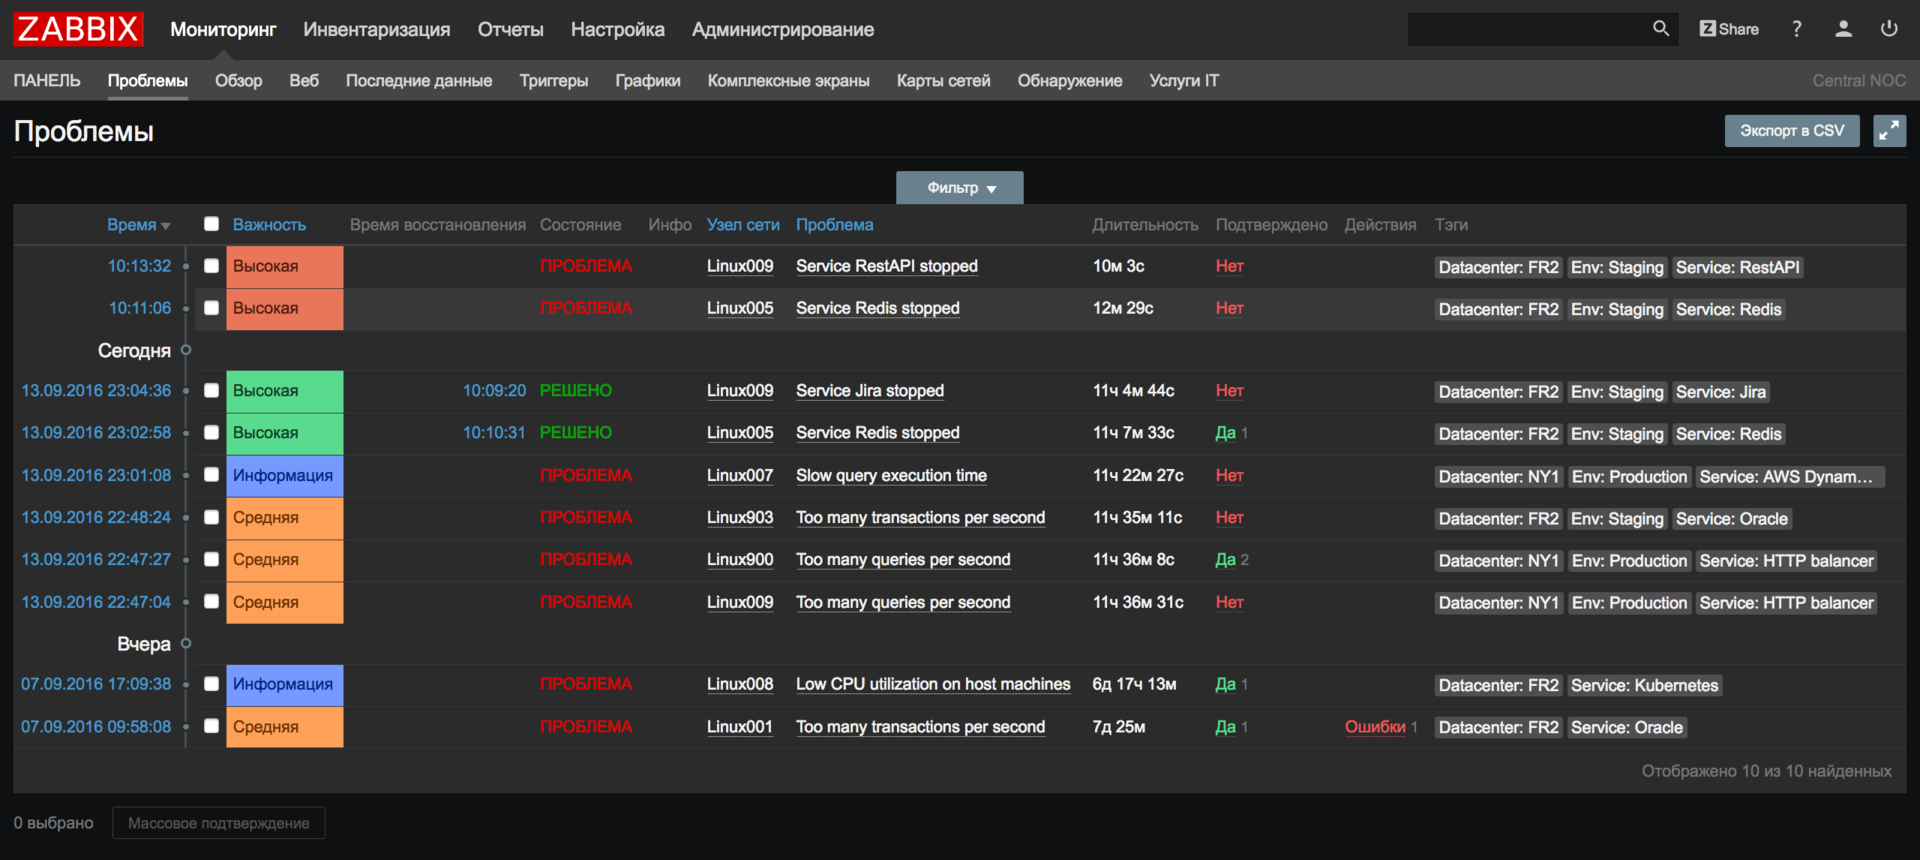
All current and current issues are now available in the new Monitoring-Problems section (instead of Monitoring-Events). The history of problems in the database has moved, and in the new version lies separately from the current problems, which gave an excellent performance boost. A flexible filter will allow you to quickly find the information you need, and the timeline will help you navigate in time.
Manual closure of accidents
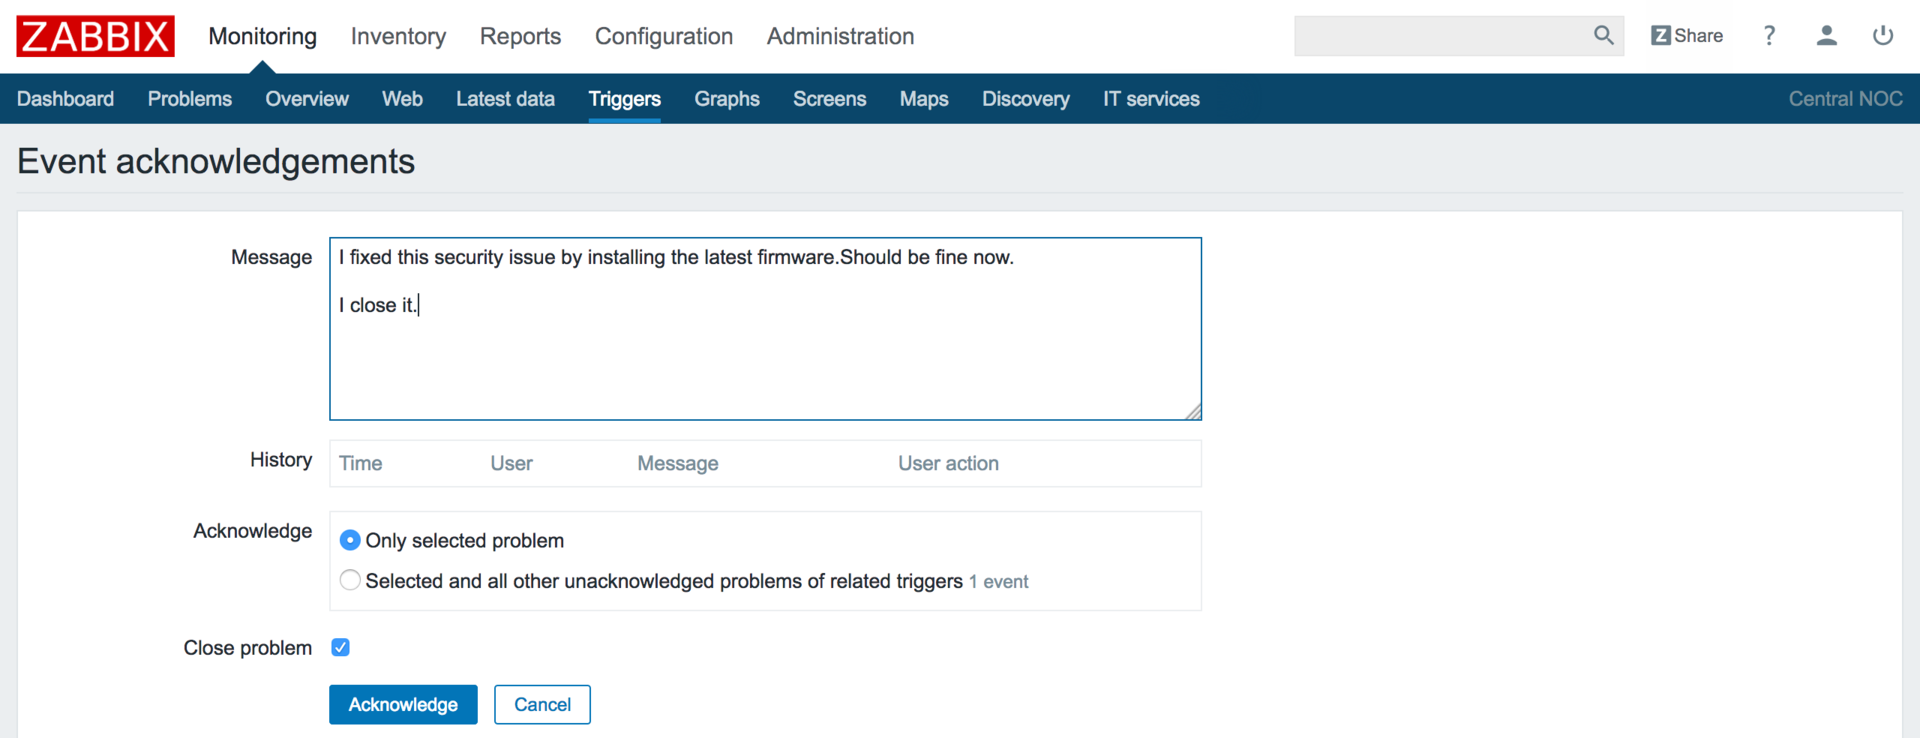
Now this is possible in Zabbix. Remove from the list of problems old or irrelevant events, as well as confirm and close the alarm messages about a backup that did not last at night (after you fixed it, of course) or having read a critical error from the log file. In this case, it will be possible to close only those problems whose triggers were previously marked with the corresponding checkbox when setting up in the template.
Simplified hysteresis and a separate condition for accident recovery
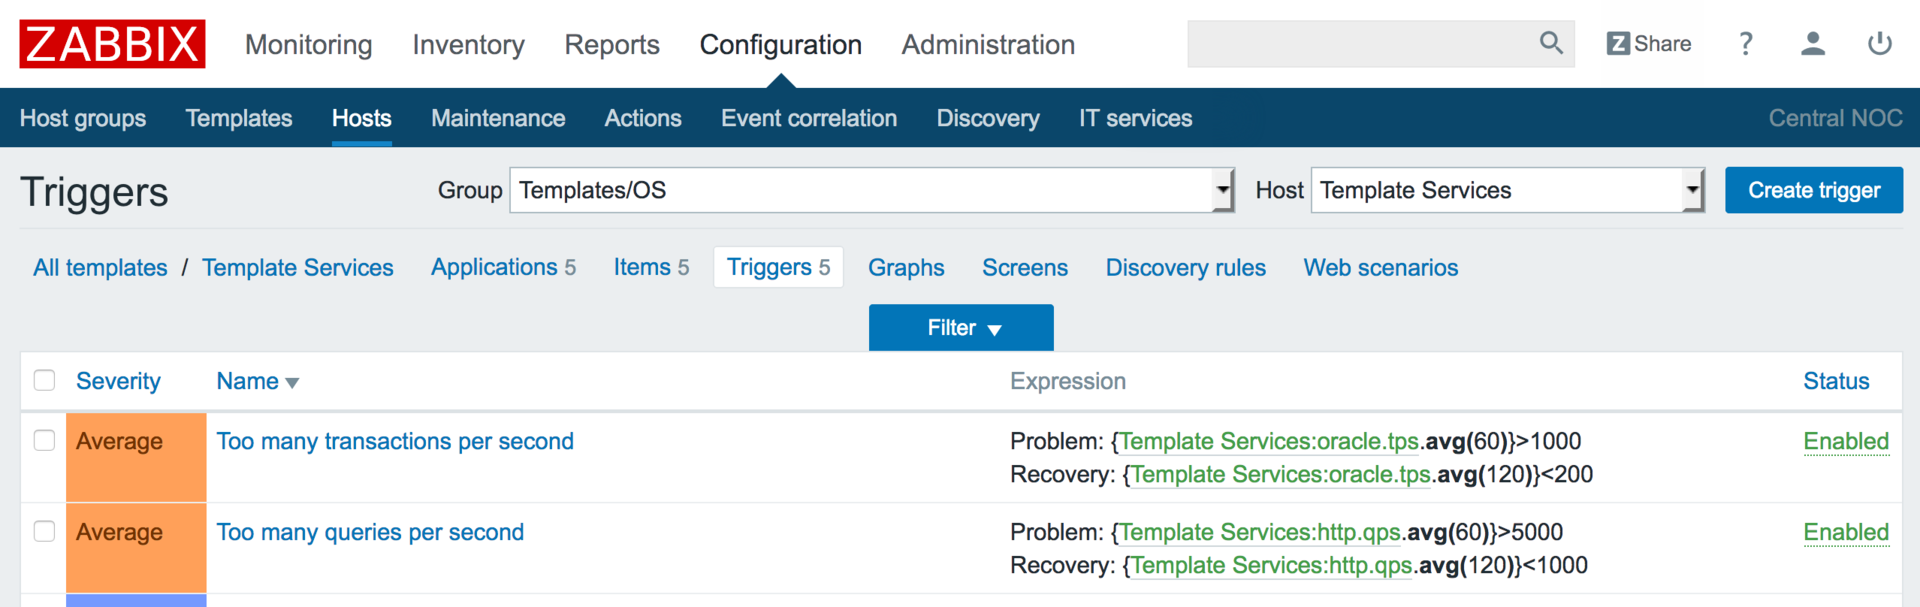
To combat the blinking of problems earlier, Zabbix had to resort to rather difficult to understand trigger expressions, for example, to the expression of the form:
({TRIGGER.VALUE}=0 and {server:temp.last()}>20) or ({TRIGGER.VALUE}=1 and {server:temp.last()}>15) It helped fight the bounce of the accident, when the temperature fluctuated around 20 degrees - the accident was created at 20 degrees, but recovery occurred only after the temperature dropped below 15.
Now everything is easier.
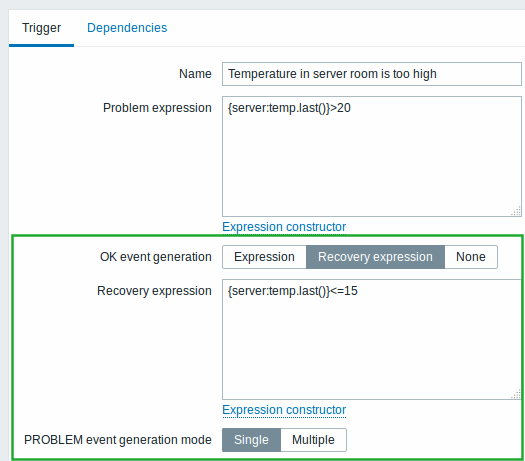
Just a separate optional window in the trigger settings, where the criterion for ending the accident can be declared:
And that's all, and no more logic inside out with {TRIGGER.VALUE}.
View data items, triggers and graphs created via LLD
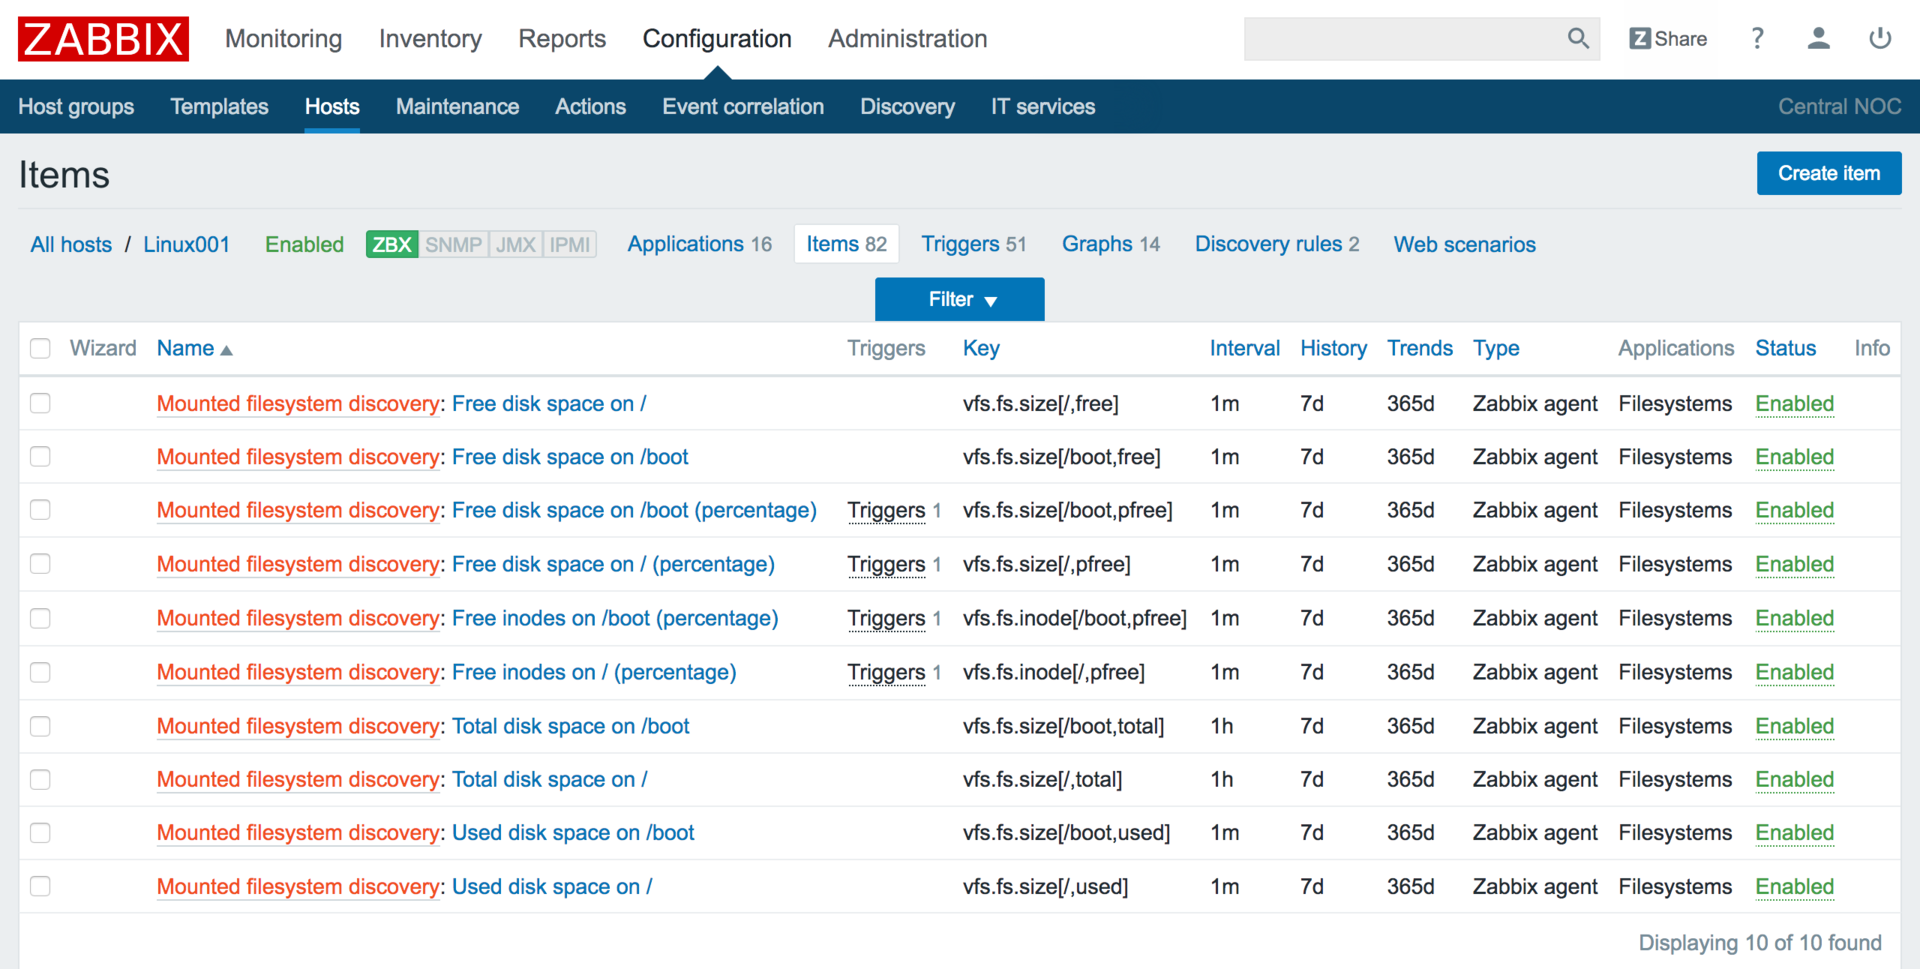
A small but very useful feature that was not enough - the ability to manipulate objects created through low-level detection (LLD) was also implemented. Everything just listed can now be deleted, disconnected and viewed just like ordinary objects.
I think that to many it will save a couple of mouse clicks when setting up, as it will simplify the removal of various debris that could leak through the LLD detection filter.
Redesigned action setup screen
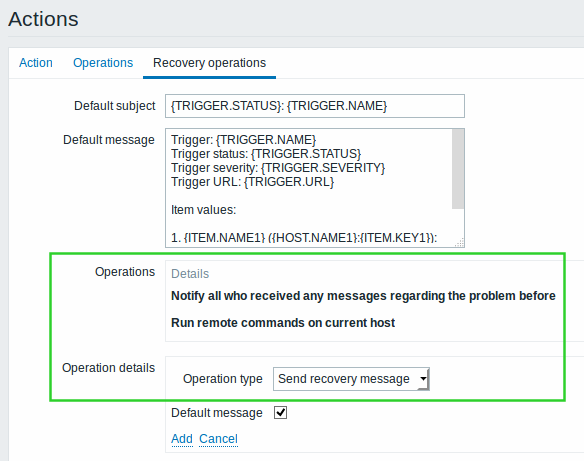
The action settings page has been redesigned. Now, all the operations that need to be performed at the end of the accident (whether it is an alert or script launch) are configured in a separate tab. It also reworked the mechanism for the work of delayed notifications from network nodes, which are in maintenance mode.
Import / export of web monitoring scripts
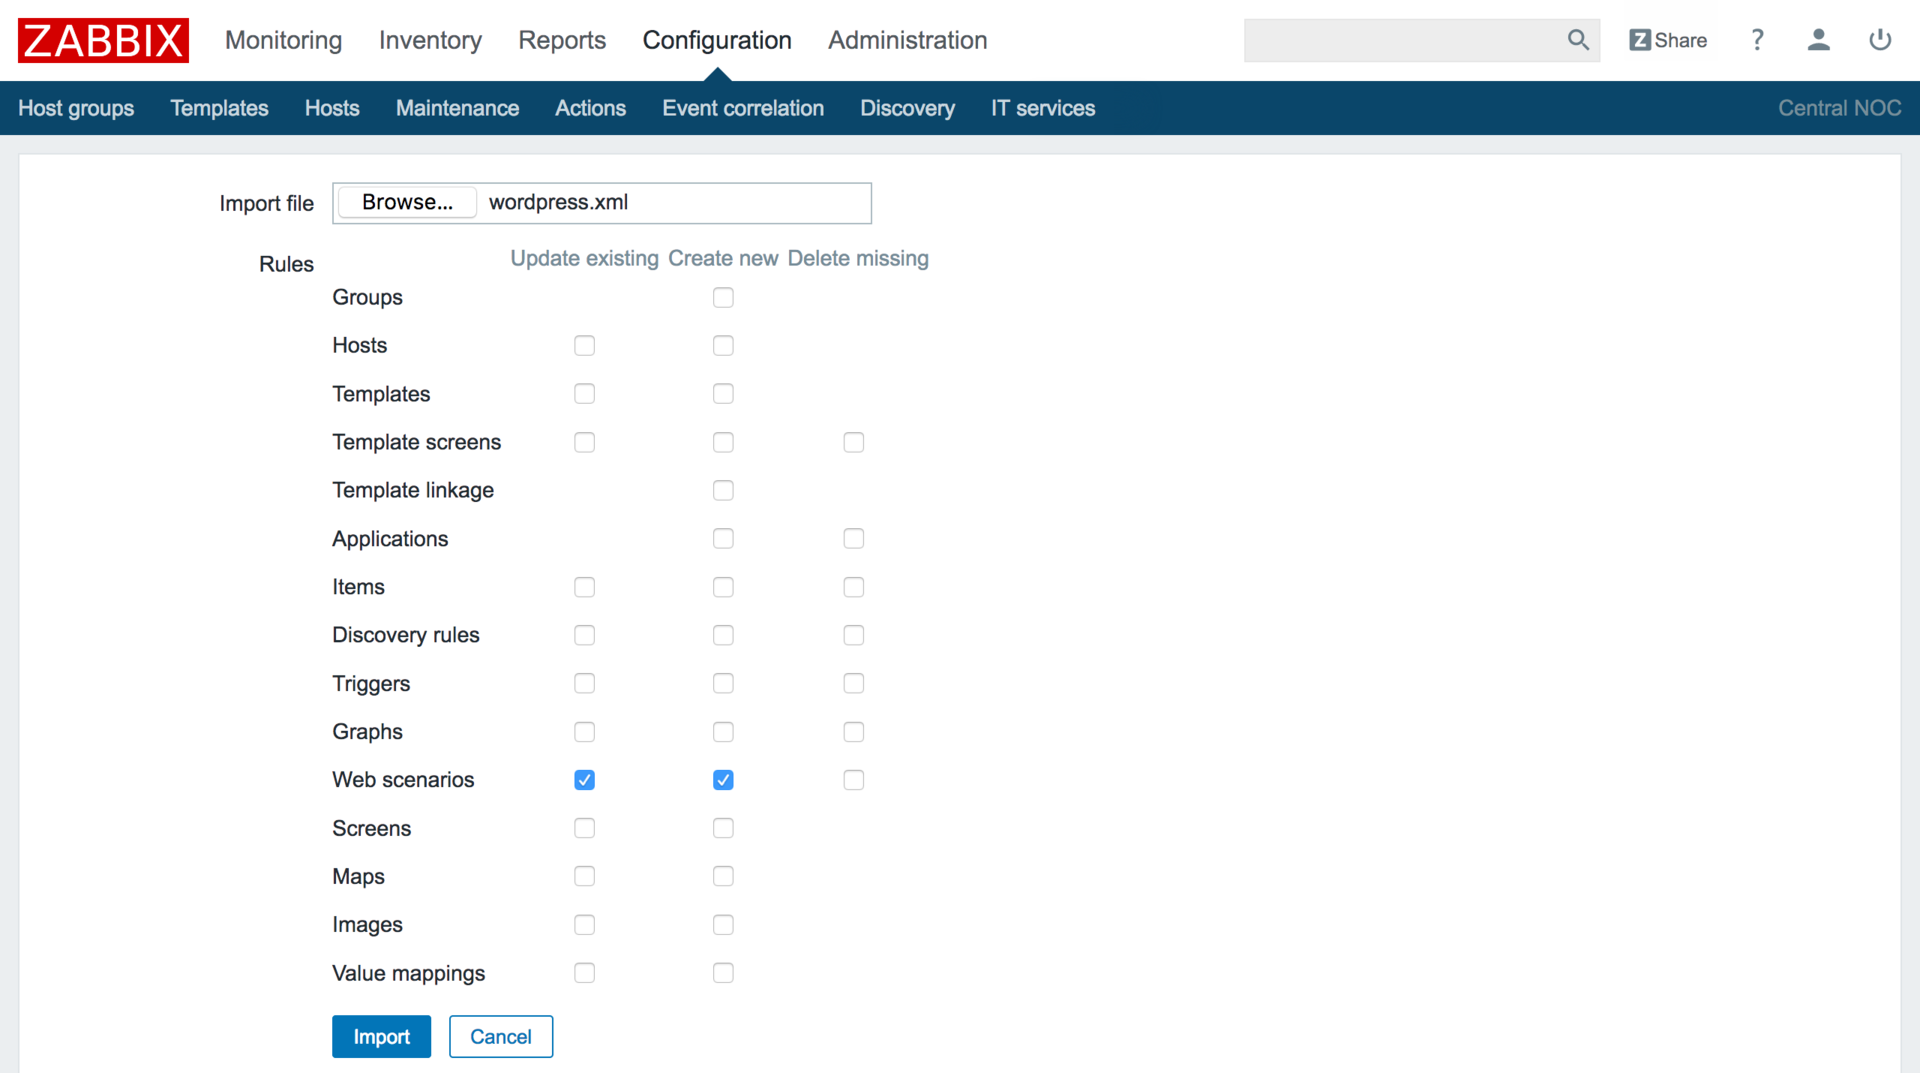
After adding the ability to import / export value maps (value maps) in 3.0, web scripts remained non-downloadable. Today, this unfairness is eliminated, and now web-checking solutions can also be uploaded to XML with all the steps for later uploading to other Zabbix servers. We expect web monitoring templates to appear on share.zabbix.com
Trigger functions for NOTSUPPORTED data items
The nodata () function has been reworked to make triggering easier in cases where the data item becomes unavailable.
In addition, the date () , dayofweek () , dayofmonth () , now () , time () functions, which in general do not really depend on the value of the data element, are now always calculated, regardless of what state the data element is in.
But the most important thing is that now the trigger will not go into the UNKNOWN state until at least one part of the logical OR can be checked. This will allow combining several different data collection methods for the same event (for example, through collecting SNMP counters and reading the log file), or create aggregated crashes without fear that they will not work due to the unavailability of one of the data elements. .
Work with fast-growing log files
Added new options for working with fast-growing log files. The main problem with such files is the huge number of messages that are written to the log in certain situations.
Since all the lines must be analyzed by Zabbix-agent, and the lines matched with the filter are sent to the Zabbix-server, with large volumes there can be significant delays, in addition, a large number of duplicate lines are written to the database.
To work with such logs, a new maxdelay parameter has been added , which sets a time frame for which new incoming messages should be analyzed.
If it turns out that all the lines can not be sorted out within the prescribed period, then the older message is skipped in favor of more recent ones.
Also added are new data elements of Zabbix agent log.count and logrt.count , which return the number of processed lines, instead of them.
Regex support in count () function
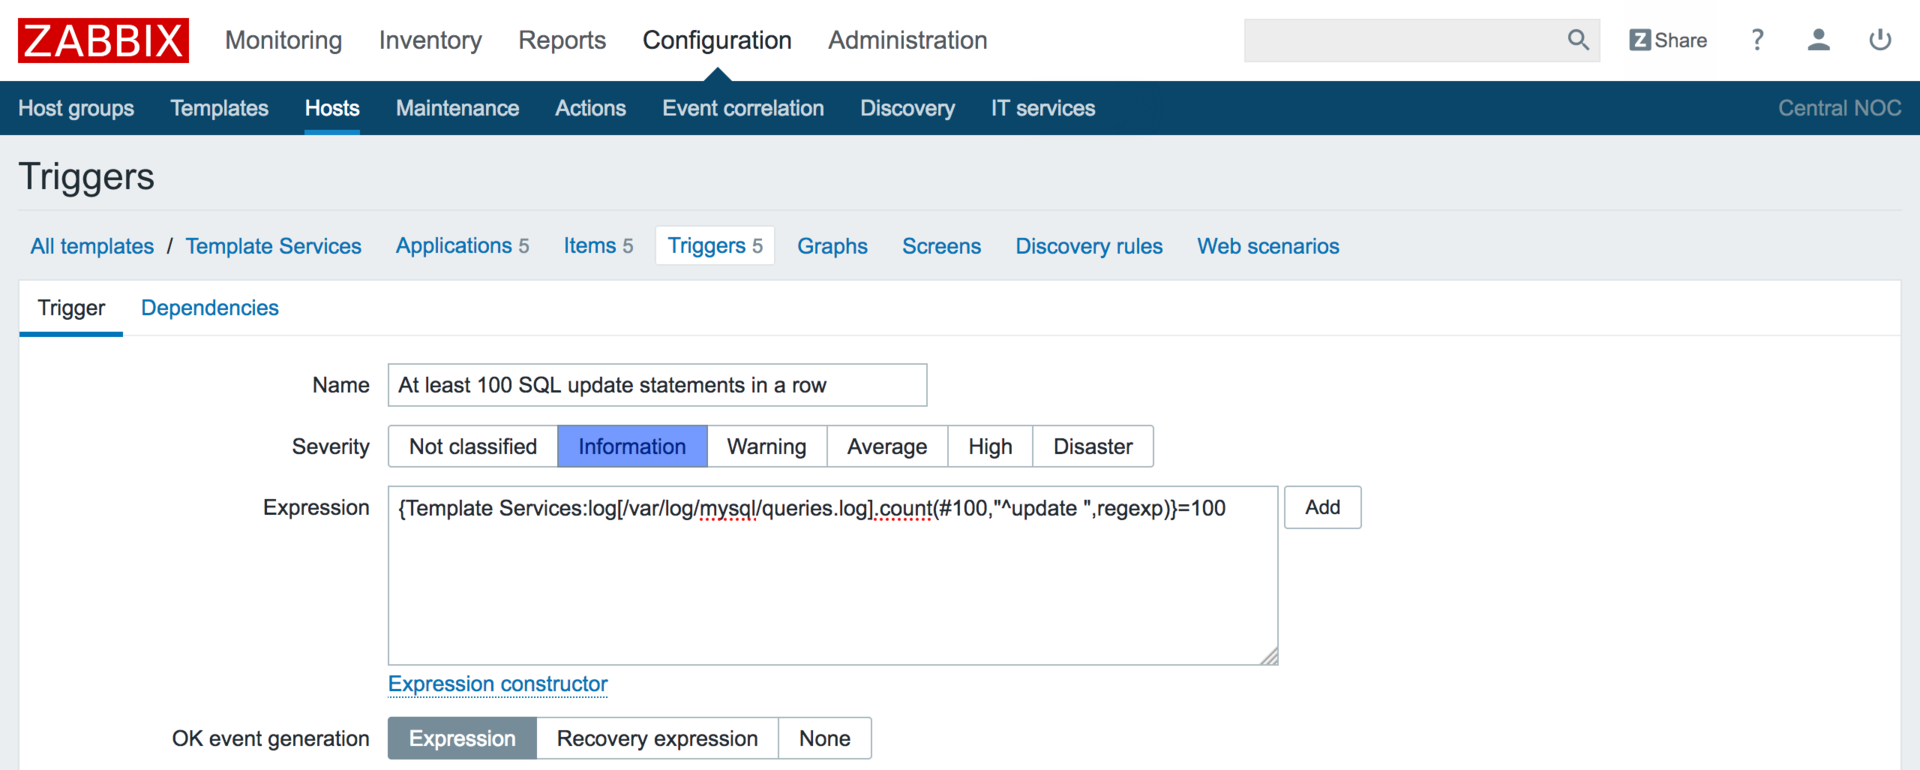
Very small, but nice addition. The count () function has acquired the ability to use regexp and iregexp operators for all types of data elements.
Thus, it is now possible to count the number of values collected for a certain period of time that correspond to a regular expression.
Macro value conversion
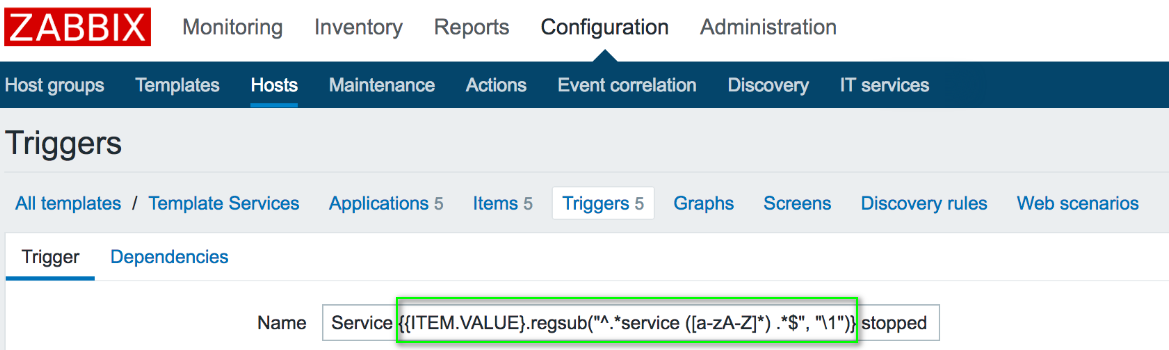
Now you can change the value of a macro, such as, for example, {ITEM.LASTVALUE} . Using the regsub and iregsub functions, you can pull out, for example, a part of a line from a log file and use the result in event tags or in the alert text
Read more
More information about these and other innovations can be found by following the links below in the documentation:
- Event tags
- New screen Monitoring-> Problems
- Manual closing problems
- Macro value conversion
- Work with fast-growing log files
- Simplified hysteresis and a separate condition for accident recovery
- Setup actions for recovery
- Maintenance Mode Escalation Rules
- View data items, triggers and graphs created via LLD
- Import / export of web monitoring scripts
- Various frontend improvements
- Zabbix process improvements
- New data items log.count, logrt.count
- New VMware Data Items
- New Trigger Functions
- Changes in the database
- Non-strict calculation of trigger expressions
- Historical modules
The version is already available for download here . The update procedure is very simple, you can read it here . Additional actions may be needed only by those who use partitioning in MySQL and PostgreSQL — the changes made to the schema in the new version may not be compatible with the current table partition settings.
Source: https://habr.com/ru/post/309964/
All Articles