Monitoring the linux network stack
 Often, the monitoring of the network subsystem of the operating system ends at the packet, octet, and network interface error counters. But this is only the 2nd level of the OSI model !
On the one hand, most of the problems with the network arise just at the physical and data link levels, but on the other hand, applications working with the network operate at the TCP session level and do not see what is happening at the lower levels.
I’ll tell you how fairly simple TCP / IP stack metrics can help deal with various problems in distributed systems.
Netlink
Almost everyone knows the netstat utility in linux, it can show all current TCP connections and additional information on them. But with a large number of connections, netstat can work for quite a long time and significantly load the system.
There is a cheaper way to get connection information - the ss utility from the iproute2 project.
For comparison:
$ time netstat -an|wc -l 62109 real 0m0.467s user 0m0.288s sys 0m0.184s $ time ss -ant|wc -l 62111 real 0m0.126s user 0m0.112s sys 0m0.016s Acceleration is achieved by using the netlink protocol for querying information about connections from the kernel. Our agent uses netlink directly.
Consider connections
Disclaimer: to illustrate working with metrics in different slices, I will show our interface (dsl) work with metrics, but this can be done on opensource repositories .
First of all, we divide all connections into inbound and outbound with respect to the server.
Each TCP connection at a certain point in time is in one of the states , the breakdown by which we also save (this can sometimes be useful):
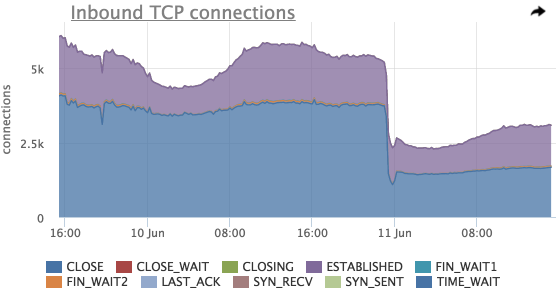
Using this graph, you can estimate the total number of incoming connections, the distribution of compounds by states.
Here you can also see a sharp drop in the total number of connections shortly before 11 Jun , we will try to look at the connections in the context of listen ports:

This graph shows that the most significant drop was on port 8014, we will see only 8014 (in the interface we can simply click on the desired element of the legend):

Let's try to see if the number of incoming connections for all servers has changed?
Select servers by mask “srv10 *”:
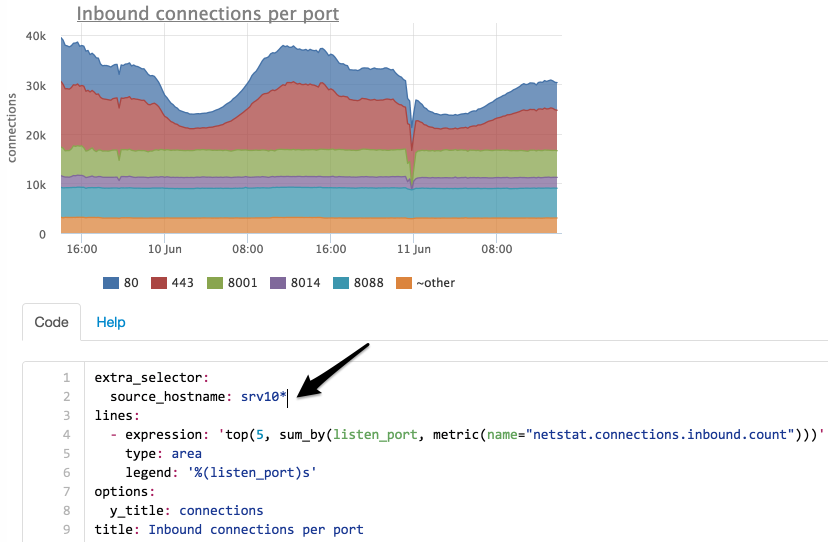
Now we see that the number of connections to port 8014 has not changed, we will try to find on which server they migrated:

We limited the selection to only port 8014 and did grouping not by port, but by servers.
Now it is clear that the connections from the srv101 server have switched to srv102 .
IP breakdown
It is often necessary to see how many connections there are from different IP addresses. Our agent removes the number of TCP connections not only broken down by listen ports and states, but also by remote IP if this IP is in the same network segment (for all other addresses, the metrics are summed up and instead of IP we show “~ nonlocal”).
Consider the same time period as in the previous cases:
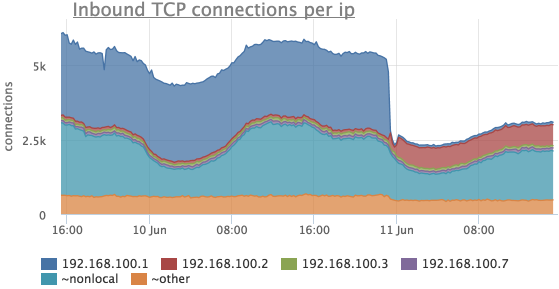
Here it can be seen that the number of connections from 192.168.100.1 has become much smaller, and at the same time connections from 192.168.100.2 have appeared.
Detailing taxis
In fact, we worked with one metric, it was just very detailed, the identifier of each instance looks like this:
{name="netstat.connections.inbound.count", state="<TCP_STATE>", listen_ip="<IP>" listen_port="<PORT>" remote_ip="<REMOTE_IP>"} For example, at one of the clients on the loaded front-end server, ~ 700 instances of this metric are removed.
TCP backlog
Using the metrics of TCP connections, you can not only diagnose network operation, but also identify problems in the operation of services.
For example, if a service serving clients across a network fails to cope with the load and stops processing new connections, they are queued ( backlog ).
There are actually two queues:
- SYN queue - the queue of unset connections (the SYN packet has been received, the SYN-ACK has not yet been sent), the size is limited according to the sysctl net.ipv4.tcp_max_syn_backlog ;
- Accept queue - the queue of connections for which the ACK packet was received (as part of the triple handshake ), but was not accepted by the application (the queue is limited by the application)
When the accept queue ACK limit is reached, the remote host packet is simply discarded or sent to the RST (depending on the value of the sysctl variable net.ipv4.tcp_abort_on_overflow ).
Our agent removes the current and maximum accept queue for all listen sockets on the server.
For these metrics, there is a graph and a pre-set trigger that will notify if any service’s backlog is used by more than 90%:

Counters and protocol errors
Once the site of one of our clients underwent a DDOS attack, only an increase in traffic on the network interface was visible in the monitoring, but we showed absolutely no metrics on the content of this traffic.
At the moment, an unequivocal answer to this question cannot still be given by okmetre, since we have just begun to master sniffing, but we have made some progress in this matter.
Let's try to understand something about these emissions of incoming traffic:

Now we see that this is incoming UDP traffic, but the first of the three outliers is not visible here.
The fact is that packet counters by protocol in linux increase only if the packet is processed successfully.
Let's try to look at the errors:
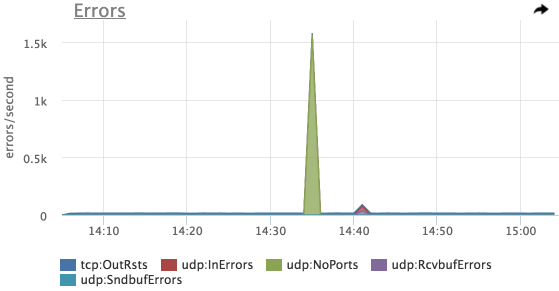
And here is our first peak - UDP errors : NoPorts (the number of datagrams that came to UPD ports that no one listens to)
We emulated this example using iperf, and in the first run we didn’t turn on the packet receiving server on the correct port.
TCP retransmit
Separately, we show the number of TCP retransmit ( retransmission of TCP segments ).
The mere presence of retransmit does not mean that there are packet losses on your network.
A segment retransmission occurs if the transmitting node has not received an acknowledgment (ACK) from the receiving entity within a certain time (RTO).
This timeout is calculated dynamically based on measurements of data transfer time between specific hosts (RTT) in order to ensure guaranteed data transfer while maintaining minimal delays.
In practice, the number of retransmitters is usually correlated with the load on the servers and it is important to look not at the absolute value, but at various anomalies:

On this graph, we see 2 retransmit spikes, at the same time the postgres processes utilized the server’s CPU:

We get protocol counters from / proc / net / snmp .
Counterrack
Another common problem is the overflow of the ip_conntrack table in linux ( iptables is used), in which case linux starts to just drop packets.
This is seen in the dmesg post:
ip_conntrack: table full, dropping packet The agent automatically removes the current size of this table and the limit from servers using ip_conntrack.
There is also an automatic trigger in the meter, which will notify you if the ip_conntrack table is more than 90% full:
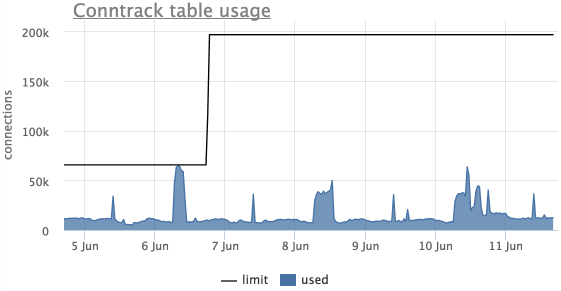
This chart shows that the table was full, the limit was raised and it was not reached any more.
Instead of conclusion
- Metric granularity is very important.
- if somewhere something may overflow, it is imperative to monitor such places
- we remove a lot of things different over TCP / IP (RTT, connections with non-empty send / recv queues), but have not yet figured out how to work properly with this
Examples of our standard charts can be found in our demo project .
There you can also see Netstat graphics.
')
Source: https://habr.com/ru/post/309600/
All Articles