The analysis of data from the Eastron SDM220 electric meter by means of ThingSpeak
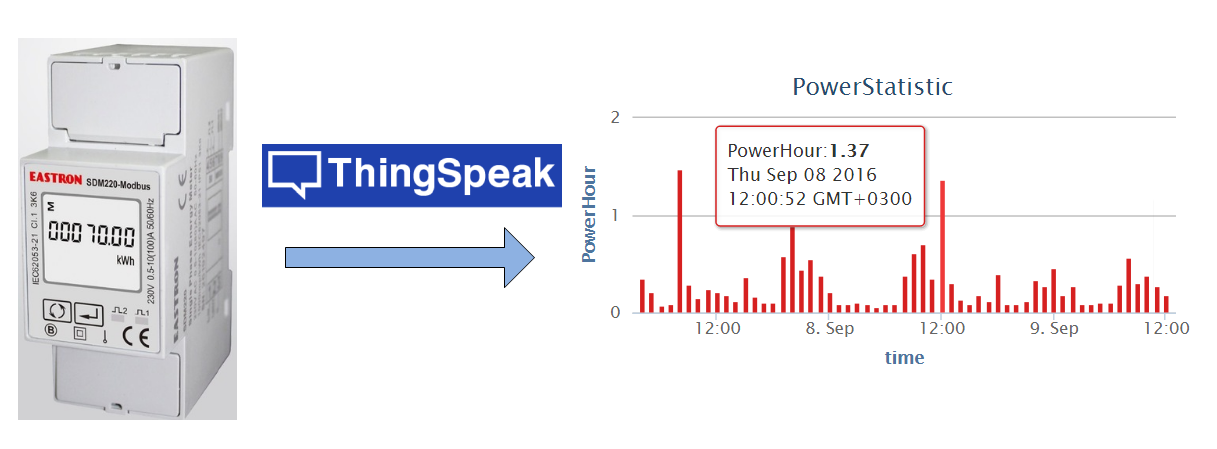
Hello. In an article on geektimes, I told you how to connect to an Eastron electric meter SDM220-Modbus and collect data from it on the RS-485 bus. Today I want to tell you about the collection and analysis of statistics on the consumption of electricity in the house.
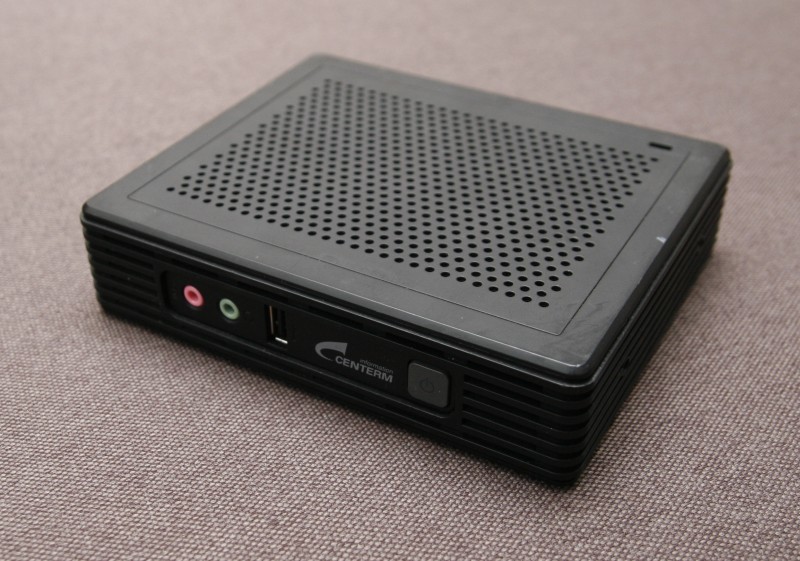
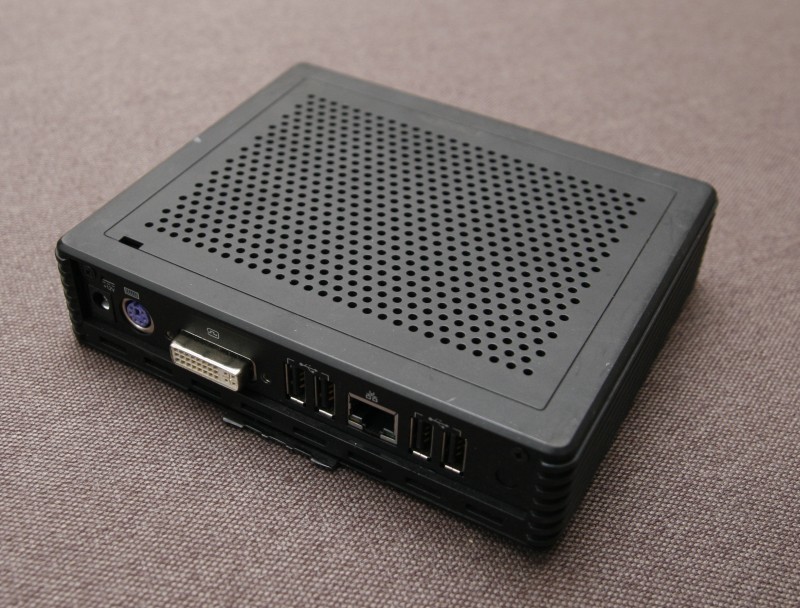
As a home hub for data collection, I used the Centerm GI-945 thin client. Its advantages are x86 architecture (atom 1,6 GHz), 5 USB, 1G Ethernet, mini-pcie (put a wifi card in it). From the USB stick is loaded Ubuntu Server 14.04.
')
Through USB-RS485 adapter to the "server" is connected to the meter. Poll counter makes the script in Python, the basis for this example . The script requires the pyModbus library .
The script is run on cron once a minute, takes data (voltage, current, power and energy taken into account) from the meter and sends them to the ThingSpeak website.
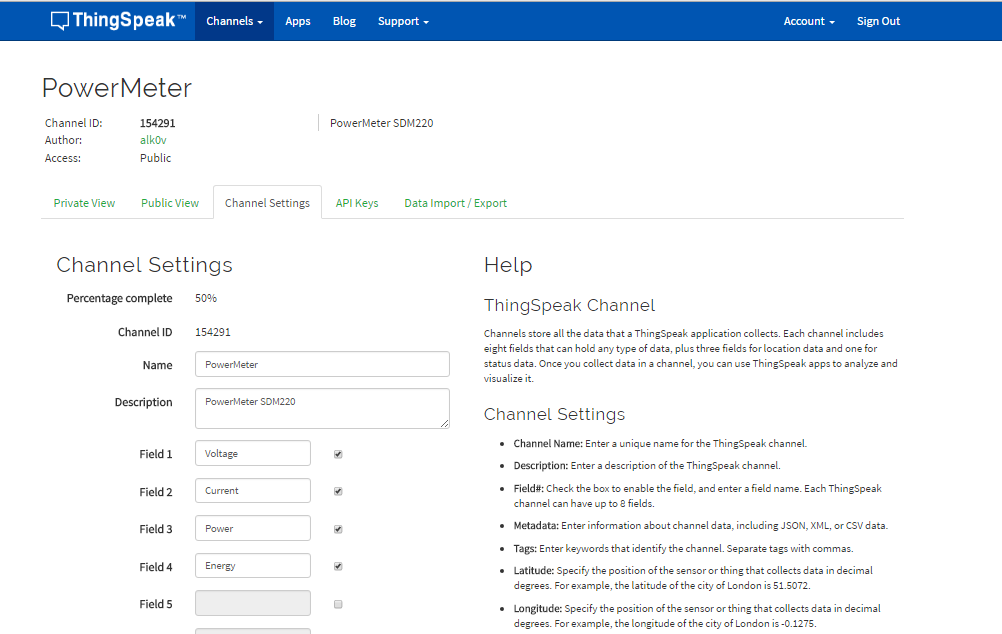
On the site, you first need to register, create your channel data channel and name the fields . Also, to write data to the channel, you need the write API key .
The script takes all the available parameters from the meter, but only the main ones are transmitted to the site, if you wish, you can transfer everything.
The result will be immediately displayed on the site (the screen shows statistics for some time, the first survey will contain only one point with a value)

By default, the graphs display the last 60 readings, which, when polled once a minute, gives the result for the last hour. For each graph, you can customize the display
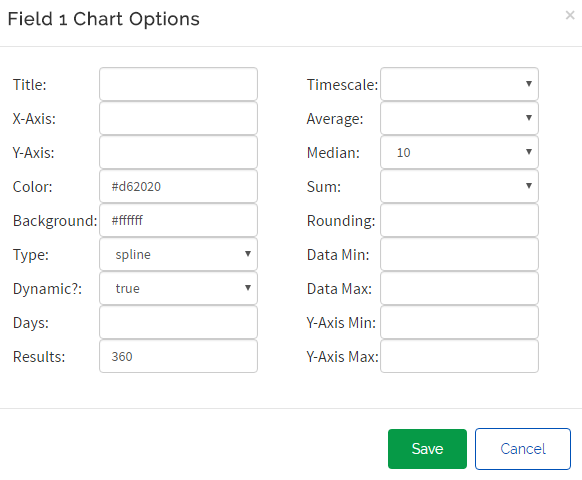
For voltage, I adjusted statistics for 6 hours with averaging over 10 values and smoothing the curve (spline).
It can be seen that the graph of energy consumption is an ever-increasing curve, and I would like to see the flow per hour, day and month, for this the site has an analyst based on the MATLAB engine and the ability to run events over time.
To collect hourly statistics, did the following:
There is an unpleasant cant on the site, there is a Save & Run button for applying the script, which makes an entry to the channel every time, so it’s better to comment out the record line until full debugging, however, even when the script is ready, you can’t just save it without launching, but running the script immediately records the data into the channel. Delete individual data from the channel is also impossible. This question has already been raised on the project forum , but has not yet been fixed.
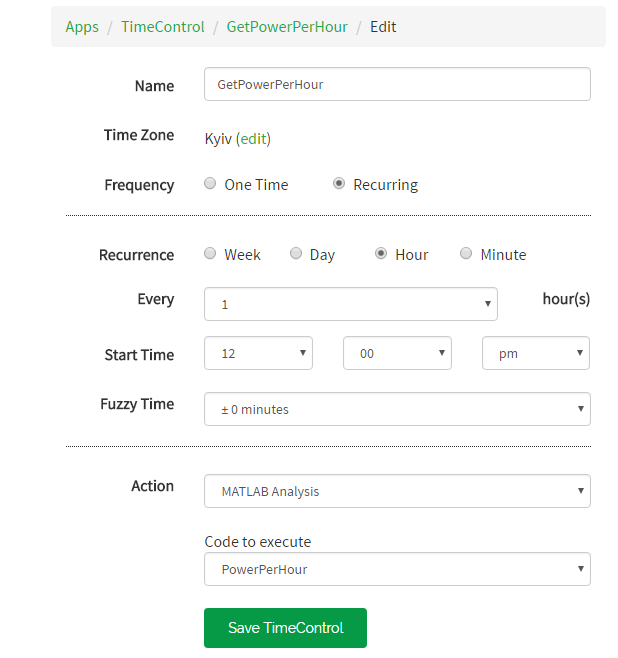
The launch settings on a schedule, the script runs every hour. The fact that the start of the launch at 12.00 can be ignored.
We look in the channel result:
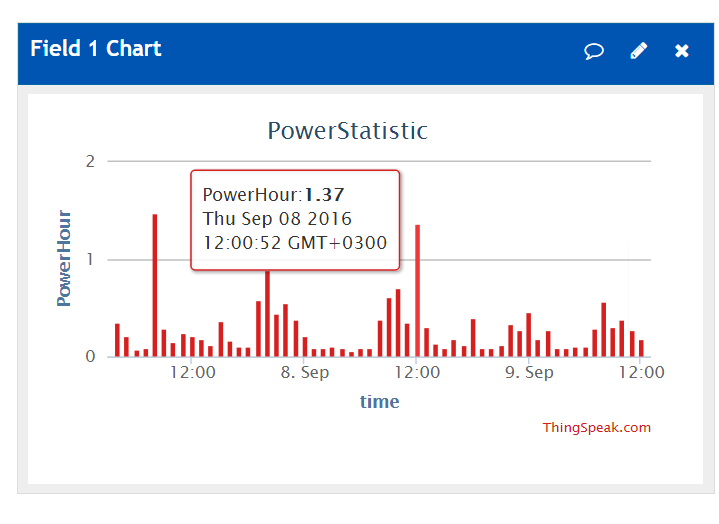
For this graph in the settings specified Type column to display the power consumption by the hour. The pop-up window corresponds to the peak of consumption at 12 o'clock (the cursor on the screen was not displayed).
Similarly, the script that collects statistics for the day. The script runs at 00:01 of each day and summarizes the 24 readings from the hourly archive.
ThingSpeak also has Android apps. To view the latest values, I liked Pocket IoT , and for charts, ThingView . There are also a couple of widgets, but they are some kind of curves.
»Channel PowerMeter
» PowerStatistic Channel
On this, perhaps, everything. The article does not claim to be a tutorial, since I just started to get acquainted with the possibilities of ThingSpeak, any additions, comments and edits are welcome.

As a home hub for data collection, I used the Centerm GI-945 thin client. Its advantages are x86 architecture (atom 1,6 GHz), 5 USB, 1G Ethernet, mini-pcie (put a wifi card in it). From the USB stick is loaded Ubuntu Server 14.04.

')

Through USB-RS485 adapter to the "server" is connected to the meter. Poll counter makes the script in Python, the basis for this example . The script requires the pyModbus library .
Library installation
sudo add-apt-repository ppa: fkrull / deadsnakes-python2.7
sudo apt-get update
sudo apt-get upgrade
apt-get -y install python-pip
apt-get install python2.7-dev
pip install -U pymodbus
sudo apt-get update
sudo apt-get upgrade
apt-get -y install python-pip
apt-get install python2.7-dev
pip install -U pymodbus
The script is run on cron once a minute, takes data (voltage, current, power and energy taken into account) from the meter and sends them to the ThingSpeak website.
On the site, you first need to register, create your channel data channel and name the fields . Also, to write data to the channel, you need the write API key .

Python Script Code
#! / usr / bin / python2
import struct
import pymodbus.client.sync
import binascii
import time
import sys
import urllib
def read_float_reg (client, basereg, unit = 1):
resp = client.read_input_registers (basereg, 2, unit = 1)
if resp == None:
return none
# according to spec, each pair of registers returned
# encodes a IEEE754 float where the first register carries
# the most significant 16 bits
# least significant 16 bits.
return struct.unpack ('> f', struct.pack ('> HH', * resp.registers))
def fmt_or_dummy (regfmt, val):
if val is None:
return '.' * len (regfmt [2]% (0))
return regfmt [2]% (val)
def main ():
regs = [
# Symbol Reg # Format
('V:', 0x00, '% 6.2f'), # Voltage [V]
('Curr:', 0x06, '% 6.2f'), # Current [A]
('Pact:', 0x0c, '% 6.0f'), # Active Power ("Wirkleistung") [W]
('Papp:', 0x12, '% 6.0f'), # Apparent Power ("Scheinl.") [W]
('Prea:', 0x18, '% 6.0f'), # Reactive Power ("Blindl.") [W]
('PF:', 0x1e, '% 6.3f'), # Power Factor [1]
('Phi:', 0x24, '% 6.1f'), # cos (Phi)? [one]
('Freq:', 0x46, '% 6.2f'), # Line Frequency [Hz]
('Wact:', 0x0156, '% 6.2f'), # Energy [kWh]
('Wrea:', 0x0158, '% 6.2f'), # Energy react [kvarh]
]
cl = pymodbus.client.sync.ModbusSerialClient ('rtu',
port = '/ dev / ttyUSB0', baudrate = 9600, parity = 'N', stopbits = 1,
timeout = 0.8)
values = [read_float_reg (cl, reg [1], unit = 1) for reg in regs]
outvals = list (('' .join ([fmt_or_dummy (* t) for t in zip (regs, values)])). split ())
params = urllib.urlencode ({'key': 'xxxxxxxxxxxxxxxxxx', 'field1': outvals [0], 'field2': outvals [1], 'field3': outvals [2], 'field4': outvals [8] })
f = urllib.urlopen (“ api.thingspeak.com/update ”, data = params)
print (outvals)
sys.stdout.flush ()
if __name__ == '__main__':
main ()
The script takes all the available parameters from the meter, but only the main ones are transmitted to the site, if you wish, you can transfer everything.
The result will be immediately displayed on the site (the screen shows statistics for some time, the first survey will contain only one point with a value)

By default, the graphs display the last 60 readings, which, when polled once a minute, gives the result for the last hour. For each graph, you can customize the display

For voltage, I adjusted statistics for 6 hours with averaging over 10 values and smoothing the curve (spline).
It can be seen that the graph of energy consumption is an ever-increasing curve, and I would like to see the flow per hour, day and month, for this the site has an analyst based on the MATLAB engine and the ability to run events over time.
To collect hourly statistics, did the following:
- Created a second channel PowerStatistic ;
- In Apps -> MATLAB Analysis, I created a script that takes the current energy value and subtracts the value an hour ago. The result is entered into the channel field;
- In Apps -> Time Control, I created a GetPowerPerHour event that will run a Matlab script every 00 hours.
PowerPerHour Script
% ID of the source channel, in which data from the counter are placed, if the channel is private, you need to specify Read API Key
readChannelID = 154291;
% Channel ID to record processed data (PowerStatistic)
writeChannelID = 157182;
writeAPIKey = 'xxxxxxxxxxxxxxxxxx';
%% Read Data %%
data1 = thingSpeakRead (readChannelID, 'Fields', 4);
data2 = thingSpeakRead (readChannelID, 'Fields', 4, 'NumMinutes', 60);
value = data1-data2 (1);
% in data1 read the last value from the 4th field (Energy)
% reading in data2 is done crookedly, but I haven’t yet come up with another, read the last 60 values (per hour) and take the first one
%% Analyze Data %%
% had to add rounding to two characters, because despite the fact that in the original array the values are rounded to two decimal places, the result of the subtraction for some reason looked like this: 0.2700000000000031
analyzedData = round (value, 2);
% disp can be used to debug data
% disp (analyzedData);
If analyzedData has one value, not a vector, it will be recorded in the first field of the channel. To write to other fields you need to add 'Fields', 2, for example.
%% Write Data %%
thingSpeakWrite (writeChannelID, analyzedData, 'WriteKey', writeAPIKey);
There is an unpleasant cant on the site, there is a Save & Run button for applying the script, which makes an entry to the channel every time, so it’s better to comment out the record line until full debugging, however, even when the script is ready, you can’t just save it without launching, but running the script immediately records the data into the channel. Delete individual data from the channel is also impossible. This question has already been raised on the project forum , but has not yet been fixed.

The launch settings on a schedule, the script runs every hour. The fact that the start of the launch at 12.00 can be ignored.
We look in the channel result:

For this graph in the settings specified Type column to display the power consumption by the hour. The pop-up window corresponds to the peak of consumption at 12 o'clock (the cursor on the screen was not displayed).
Similarly, the script that collects statistics for the day. The script runs at 00:01 of each day and summarizes the 24 readings from the hourly archive.
PowerPerDay Script
readChannelID = 157182;
readAPIKey = 'zzzzzzzzzzzzzzzzzzzzz';
writeChannelID = 157182;
writeAPIKey = 'xxxxxxxxxxxxxxxxxxxx';
%% Read Data %%
% read the last 24 values from the first field of the channel
data = thingSpeakRead (readChannelID, 'ReadKey', readAPIKey, 'Fields', 1, 'NumPoints', 24);
%% Analyze Data %%
% sum
analyzedData = sum (data);
% disp (analyzedData);
%% Write Data %%
thingSpeakWrite (writeChannelID, analyzedData, 'WriteKey', writeAPIKey, 'Fields', 2);
ThingSpeak also has Android apps. To view the latest values, I liked Pocket IoT , and for charts, ThingView . There are also a couple of widgets, but they are some kind of curves.
»Channel PowerMeter
» PowerStatistic Channel
On this, perhaps, everything. The article does not claim to be a tutorial, since I just started to get acquainted with the possibilities of ThingSpeak, any additions, comments and edits are welcome.
Source: https://habr.com/ru/post/309580/
All Articles