Analytics for game designers and producers. Part I
Why do we need analytics for game designers, producers and other employees who are responsible for the product component, the quality of the game and its content, the success in the market and business indicators? In this article I will tell you what statistics are taken to analyze in order to prevent possible problems and increase revenue .
At once I will make a reservation that for each project the set of reports will be unique. Nevertheless, there are several graphs, the analysis of which is important for almost any game.
')
This article is based on my presentation on DevGamm in May 2016. If you are more comfortable with viewing the material through video, you can watch the recording of the report here . Its content is 70% intersected with the content of the article. Without restrictions on timing, I added a few additional cases to the article and divided it into two parts so as not to pour text on the reader. In the first part, we will discuss the most popular and useful KPI game projects and player retention indicators, which need to be thought about during the development phase, and secondly, we will look at game design metrics and their connection to game balance, economics and game perception .
Let's start with whether we need an analyst at all. What benefits can it bring? As an illustration, we can give a vivid example, when a simple reference to statistics allowed us to solve the critical problem of the Dungeon game:
Among other statistical indicators there is a group called conversion. Let's start with her. In short, these are characteristics that indicate what percentage of users performed the action we need. For example, the conversion of all who launched the game in those who played one battle.
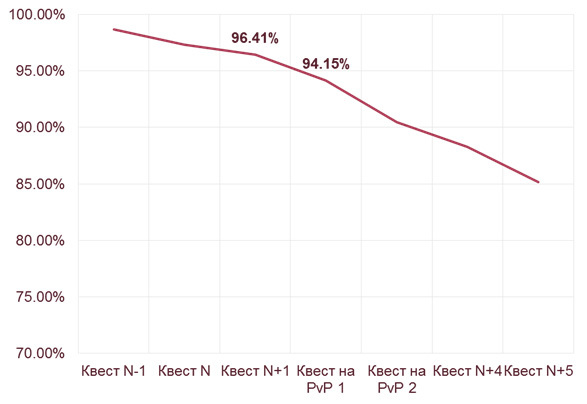
In order to understand where our players “fall off”, the developers cover with metrics each stage of the tutorial (aka tutorial) and all the player’s first steps. In a normal situation, a drop happens smoothly: the farther away a game event is in the chain, the less people will reach it. Usually at each stage we lose 1-5% of players. But in one of the PvP quests in the Undergrounds “Overcoming two opponents in the PvP” there was a 20% drop.

Thanks to simple analytics, or rather a banal reference to statistics, this moment was quickly detected, and the conversion increased by almost 15%. Effective was the simple solution to split this quest into two, each of which needed to cope with one opponent in the PVP.
It is important to understand that analytical reports are not made for the sake of reports as such, but as a tool to help solve problems arising from marketers, producers and game designers. No matter how beaten it may sound, but before requesting certain data, it is necessary to formulate a hypothesis that you want to test.
To build a good analytics system, I recommend answering the following questions in the sequence indicated:
After giving yourself the answers to these questions, the developer thinks about how to collect and visualize this data? To solve this problem there are two ways:
I saw very cool own development of domestic gaming companies. They cost years of work for small teams of 3-5 people. If you are an indie developer or have not yet reached significant financial momentum, the use of third-party services will be the best solution. However, in each case, the decision is yours. There are many different solutions on the market for integrating internal analytics. From external systems, I can recommend DevToDev, MixPanel and Amplitude . Also do not forget about the long-proven Google Analytics .
Turning to external systems, it is important to understand what purpose you are pursuing: product analytics, marketing and business analytics, market analytics, and maybe attribution of users. If you need attribution (tracking of refs on a mobile platform, allowing you to determine which advertising channel a particular user came from), they will help you:
We now turn to the reports. They are divided into categories, depending on the "consumer" - a specialist who will monitor and analyze the relevant indicators. Further I will give them in the form of a list of metrics that are visualized on the charts of the relevant reports.
For more subtle analytics, the financial statements are segmented by traffic and by various aspects of the game balance.
I will focus your attention on the calculation of return on investment. This indicator is important not only to see in fact, but also to predict. There are various methods of its calculation. Often use Classic ROI - a value that characterizes how many percent of the money invested in traffic will return for the entire life of the player (Lifetime). Besides him, many executives and financiers are looking at rolling ROI . This metric shows what percentage of the money invested in traffic beats off every month.

These reports are most in demand by marketers. I’ll note right away that for financial procurement (User Acquisition) both financial reports and attraction metrics are needed. This is due to the fact that traffickers need to see the ROI of each purchase channel in order to be able to decide whether to increase the purchase through the selected channel or “shoot it off”.
A good example is the purchase of traffic in RJ Games. Colleagues analyze daily long-term prediction of ROI, which builds an analytical system for the first days of purchase. In the end, they optimize advertising campaigns to maximize revenue, ROI and LTV.
In small companies, traffickers and marketers often do not have their own internal analytics to attract or do not use it. In such cases, they rely on data from external systems: all procurement services in one form or another give statistics on the efficiency of attracting traffic for each of the channels used. At a basic level, this is enough, especially for browser / social games. However, when a company enters large (industrial) volumes of traffic purchases, the need to optimize and maximize ROI becomes critical.
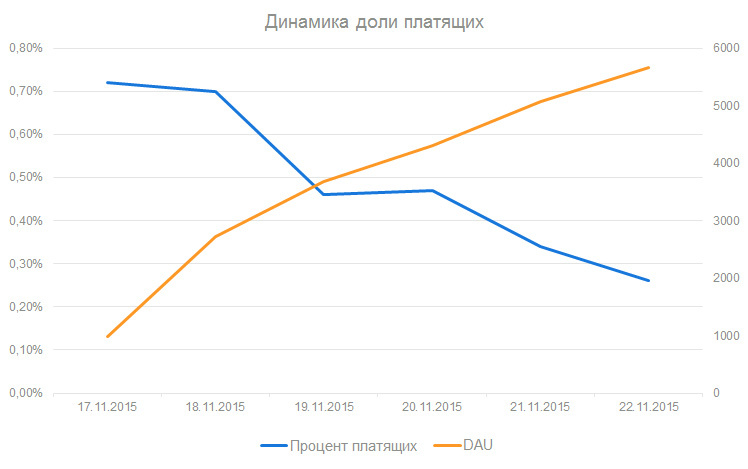
And now an example of using these indicators in practice. I was lucky to take part in the development of the mobile game "Evolution: Heroes of Utopia" (My.Com). Having launched the project in Soft Launch, we closely followed its metrics. For a while, the percentage of paying players was close to a constant value. And it was good. But at one moment it began to fall, although we did not fill in any updates. What happened? We put forward two hypotheses:
Before we looked at the complex reports on the absorption of content by players, and segment the audience into cohorts by traffic sources and fill dates, we made a very simple observation. I imposed the dynamics of DAU on the PPU fall chart by days and saw a clear correlation: the more the DAU grew, the more PPU fell (even taking into account the delay). A sure sign that pouring gives traffic with a lower percentage of people paying than they did before. More sophisticated analysis confirmed this version. Specifically, in the case of “Evolution”, this was the right procurement decision, which made it possible to optimize costs. The fact is that the main task of testing was the analysis of the dynamics of retention and sticky-factor, and the monetization indicators of the project were analyzed later.
I also note that PPU is useful to count not only in the whole game, but also in segments, for example, in levels. Such segmentation will immediately show at what levels or on what day people pay money. It often happens that it is interesting for players to buy something completely different from what the developers hoped to make a profit.
The key measure of retention can be calculated in different ways. I want to share this information with you, because in different situations you may need different methods of calculation.
Depending on your needs and situation, you should choose the appropriate method of calculating the retention.
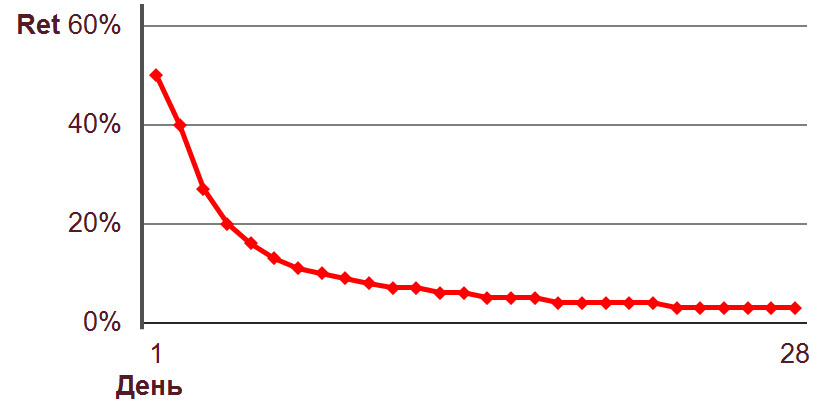
To understand the difference in visualization of retention by day (Day by Day) and by cohorts, we present two graphs . Below is an example of a Classical Retention graph of one of the real projects, built by days. It is clearly seen that the farther the day from registration, the fewer players remain.

The logic of its construction is as follows. We take every day and rewind X days ago (1, 7, 14, etc.), displaying the percentage of people who registered X days ago and reached the current day.
Next, consider the cohort rolling retention . The logic of its construction is different. We take a cohort of players who have registered some time ago, and see what percentage of them come back every day from the day of registration to the current moment.
Even before the actual launch of the project, it makes sense to predict retention, focusing on data from similar games. The area under the Rolling Retention schedule is Live Time (LT). If we multiply this value by the daily revenue (ARPDAU), then we get LTV. Read more about this here .
These were key product metrics that I analyzed while working in different gaming companies. Once again, I note that this is not the only version of the reports, and there are still a lot of other metrics. If in your practice there were graphs with business indicators that I did not mention for one reason or another in the article, I would be glad if you share them in the comments .
In the next article I will talk about game design reports and metrics that are responsible for the economy, balance and state of the game. Also in our blog " Management of online gaming projects " will soon be published interesting material on game analytics from our partners, the devtodev company and the resource "Game Design Cuffs". Subscribe not to miss!
Well, if you want to talk in person and listen to our lectures live, then come on the 21st of September for an open lecture from our program , which will be free to attend. Log in only by registering, register and learn more about the lecture here .
If you have questions about working with analytics games - ask, I will answer in the comments.
At once I will make a reservation that for each project the set of reports will be unique. Nevertheless, there are several graphs, the analysis of which is important for almost any game.
')
This article is based on my presentation on DevGamm in May 2016. If you are more comfortable with viewing the material through video, you can watch the recording of the report here . Its content is 70% intersected with the content of the article. Without restrictions on timing, I added a few additional cases to the article and divided it into two parts so as not to pour text on the reader. In the first part, we will discuss the most popular and useful KPI game projects and player retention indicators, which need to be thought about during the development phase, and secondly, we will look at game design metrics and their connection to game balance, economics and game perception .
Why do we need analytics?
Let's start with whether we need an analyst at all. What benefits can it bring? As an illustration, we can give a vivid example, when a simple reference to statistics allowed us to solve the critical problem of the Dungeon game:
Among other statistical indicators there is a group called conversion. Let's start with her. In short, these are characteristics that indicate what percentage of users performed the action we need. For example, the conversion of all who launched the game in those who played one battle.
In order to understand where our players “fall off”, the developers cover with metrics each stage of the tutorial (aka tutorial) and all the player’s first steps. In a normal situation, a drop happens smoothly: the farther away a game event is in the chain, the less people will reach it. Usually at each stage we lose 1-5% of players. But in one of the PvP quests in the Undergrounds “Overcoming two opponents in the PvP” there was a 20% drop.
Thanks to simple analytics, or rather a banal reference to statistics, this moment was quickly detected, and the conversion increased by almost 15%. Effective was the simple solution to split this quest into two, each of which needed to cope with one opponent in the PVP.
It is important to understand that analytical reports are not made for the sake of reports as such, but as a tool to help solve problems arising from marketers, producers and game designers. No matter how beaten it may sound, but before requesting certain data, it is necessary to formulate a hypothesis that you want to test.
What analytics system to choose?
To build a good analytics system, I recommend answering the following questions in the sequence indicated:
- What game features do we want to analyze? Where can problems arise?
- What do you need to measure? What are KPIs? What are game design metrics?
- What should the diagrams with selected metrics look like to make them easy to read?
After giving yourself the answers to these questions, the developer thinks about how to collect and visualize this data? To solve this problem there are two ways:
- Write your own internal analytics.
- Connect an external data collection and processing system.
I saw very cool own development of domestic gaming companies. They cost years of work for small teams of 3-5 people. If you are an indie developer or have not yet reached significant financial momentum, the use of third-party services will be the best solution. However, in each case, the decision is yours. There are many different solutions on the market for integrating internal analytics. From external systems, I can recommend DevToDev, MixPanel and Amplitude . Also do not forget about the long-proven Google Analytics .
Turning to external systems, it is important to understand what purpose you are pursuing: product analytics, marketing and business analytics, market analytics, and maybe attribution of users. If you need attribution (tracking of refs on a mobile platform, allowing you to determine which advertising channel a particular user came from), they will help you:
- Tune (strong but expensive)
- AppsFlyer (practically not inferior to Tune and developing faster, optimal for medium-sized companies),
- Yandex AppMetrica (optimal for indie, because free).
Report Categories
We now turn to the reports. They are divided into categories, depending on the "consumer" - a specialist who will monitor and analyze the relevant indicators. Further I will give them in the form of a list of metrics that are visualized on the charts of the relevant reports.
Financial (Financial & Audience)
- Revenue - project revenue.
- MAU, DAU - the volume of the active audience (per month, per day).
- LTV - Live Time Value , lifetime income per player (the simplest payback criterion : LTV> CPI, the amount of money earned from a player exceeded the cost of attracting this player).
- ROI - Return On Investment , the rate of return on investment (how many dollars earned for each dollar invested in the project). It is often understood as ROMI - return of marketing investments, since product development costs are usually fixed, and marketing spends huge amounts of money every month.
For more subtle analytics, the financial statements are segmented by traffic and by various aspects of the game balance.
I will focus your attention on the calculation of return on investment. This indicator is important not only to see in fact, but also to predict. There are various methods of its calculation. Often use Classic ROI - a value that characterizes how many percent of the money invested in traffic will return for the entire life of the player (Lifetime). Besides him, many executives and financiers are looking at rolling ROI . This metric shows what percentage of the money invested in traffic beats off every month.
Acquisition
These reports are most in demand by marketers. I’ll note right away that for financial procurement (User Acquisition) both financial reports and attraction metrics are needed. This is due to the fact that traffickers need to see the ROI of each purchase channel in order to be able to decide whether to increase the purchase through the selected channel or “shoot it off”.
- CPI, CPA - Cost Per Install, Cost Per Action , cost of attraction (for installation, for some specified action).
- CAC - Customer Acquisition Cost - the amount paid to attract a new customer
- Conversions - conversion progress of the milestones of the game.
- Day by day Retention by channels - retention by segments and various channels of attraction (traffic sources, referrals, organic).
A good example is the purchase of traffic in RJ Games. Colleagues analyze daily long-term prediction of ROI, which builds an analytical system for the first days of purchase. In the end, they optimize advertising campaigns to maximize revenue, ROI and LTV.
In small companies, traffickers and marketers often do not have their own internal analytics to attract or do not use it. In such cases, they rely on data from external systems: all procurement services in one form or another give statistics on the efficiency of attracting traffic for each of the channels used. At a basic level, this is enough, especially for browser / social games. However, when a company enters large (industrial) volumes of traffic purchases, the need to optimize and maximize ROI becomes critical.
Engagement
- Cohort Rolling Retention is a key metric of retention. I will tell in more detail below.
- Sticky Factor - as far as the player "sticks" in the game, the ratio of DAU / MAU.
- PU, PPU - Paying Users (number of paying audience), Percentage of Paying Users (share of paying audience relative to DAU).
- APRU, ARPDAU - Average Revenue per User, the average amount of money that an active user brings (per month, per day). In this block, they also watch ARPPU - the monthly average revenue per payer.
And now an example of using these indicators in practice. I was lucky to take part in the development of the mobile game "Evolution: Heroes of Utopia" (My.Com). Having launched the project in Soft Launch, we closely followed its metrics. For a while, the percentage of paying players was close to a constant value. And it was good. But at one moment it began to fall, although we did not fill in any updates. What happened? We put forward two hypotheses:
- Out of content for high-level players.
- The traffic has become less paying audience.
Before we looked at the complex reports on the absorption of content by players, and segment the audience into cohorts by traffic sources and fill dates, we made a very simple observation. I imposed the dynamics of DAU on the PPU fall chart by days and saw a clear correlation: the more the DAU grew, the more PPU fell (even taking into account the delay). A sure sign that pouring gives traffic with a lower percentage of people paying than they did before. More sophisticated analysis confirmed this version. Specifically, in the case of “Evolution”, this was the right procurement decision, which made it possible to optimize costs. The fact is that the main task of testing was the analysis of the dynamics of retention and sticky-factor, and the monetization indicators of the project were analyzed later.
I also note that PPU is useful to count not only in the whole game, but also in segments, for example, in levels. Such segmentation will immediately show at what levels or on what day people pay money. It often happens that it is interesting for players to buy something completely different from what the developers hoped to make a profit.
Types of retention
The key measure of retention can be calculated in different ways. I want to share this information with you, because in different situations you may need different methods of calculation.
- Classic Retention - the percentage of people who started the game, for example, a week ago, went to a particular day. This indicator is highly dependent on the game: its genre and platform. For example, for client games, the monthly retention can reach 40%. In mobile and social games, this figure is usually much less - 2-5%.
- Rolling Retention - the proportion of people who returned to the game on the selected day or any subsequent one. This indicator reflects retention more precisely, because covers the entire time interval. For example, the 28th day Rolling Retention will be taken into account in the calculation of people who did not enter the game on the 28th day, but returned to the 35th day. The subtlety in the calculation of this value is to select the interval during which we assign the user to the category of those who returned independently. The fact is that special promotions, events or a special marketing company could contribute to the return. In this case, the user must be classified as reengagement, because funds were spent on his decision to return, and they should be taken into account when calculating ROI.
- Full Retention - the percentage of people entering the game every day from the day of registration.
- Return retention - the return from rolling, how many people came in on any of the days up to a certain inclusive.
- Bracket-dependent Return Retention - identifies users who entered the game at a certain interval.
Depending on your needs and situation, you should choose the appropriate method of calculating the retention.
To understand the difference in visualization of retention by day (Day by Day) and by cohorts, we present two graphs . Below is an example of a Classical Retention graph of one of the real projects, built by days. It is clearly seen that the farther the day from registration, the fewer players remain.
The logic of its construction is as follows. We take every day and rewind X days ago (1, 7, 14, etc.), displaying the percentage of people who registered X days ago and reached the current day.
Next, consider the cohort rolling retention . The logic of its construction is different. We take a cohort of players who have registered some time ago, and see what percentage of them come back every day from the day of registration to the current moment.
Even before the actual launch of the project, it makes sense to predict retention, focusing on data from similar games. The area under the Rolling Retention schedule is Live Time (LT). If we multiply this value by the daily revenue (ARPDAU), then we get LTV. Read more about this here .
These were key product metrics that I analyzed while working in different gaming companies. Once again, I note that this is not the only version of the reports, and there are still a lot of other metrics. If in your practice there were graphs with business indicators that I did not mention for one reason or another in the article, I would be glad if you share them in the comments .
In the next article I will talk about game design reports and metrics that are responsible for the economy, balance and state of the game. Also in our blog " Management of online gaming projects " will soon be published interesting material on game analytics from our partners, the devtodev company and the resource "Game Design Cuffs". Subscribe not to miss!
Well, if you want to talk in person and listen to our lectures live, then come on the 21st of September for an open lecture from our program , which will be free to attend. Log in only by registering, register and learn more about the lecture here .
If you have questions about working with analytics games - ask, I will answer in the comments.
Source: https://habr.com/ru/post/309444/
All Articles