Ecosystem R as a tool for automating business tasks
This article is a continuation of the previous publication , DataScience Tools as an Alternative to the Classical Integration of IT Systems . The main goal is to focus the attention of both developers and middle managers on a wide range of opportunities provided by modern tools from Data Science beyond the framework of classical problems of statistical calculations and current machine learning topics. In particular, the capabilities of the R ecosystem as of August 2016 and the application of these capabilities on the example of two tasks: one from applied science, the other from medium-sized business.
The choice was not random, but was the result of a weighted analysis. My previous experience of executing projects in various branches and fields of human activity, as a rule, was accounted for interdisciplinary junctions, therefore the situation with the absence of a specially created tool was familiar and required an operational decision.
The key points on which the selected instrument was evaluated were as follows:
If you really have to invest time in studying the system, then you need to do it as efficiently as possible, choosing systems that have the flexibility and breadth of possible applications. Looking ahead, I will say, for this class of problems it was a decisive argument in favor of winning R in the final. Although Python, although ranked second, was and will remain an active universal tool.
')
Evaluation and comparison of approaches to solving the problem was carried out from the point of view of the business, for which the primary indicator is the achievement of the result in a given period of time for a minimum cost. Since on the way to the final, technically incomplete solutions were eliminated themselves, we will assume that the final decision satisfies the needs of both business customers and technical implementers.
The minimum set that completely satisfied us is the R language, IDE is RStudio , the integration gateway is DeployR , and the client web application server is Shiny .
Naturally, R, being a programming language, is practically unlimited in its possibilities for creating logically and mathematically complex components. It all depends on the depth of knowledge, skills and packages used.
The classic design and production problem, when for the formation of prototypes of complex layered structures, it is necessary to determine a number of parameters necessary for technological production. To determine the parameters, it is necessary to carry out very nontrivial quantum-mechanical calculations. And from various combinations to choose a set of parameters that optimally satisfy the set of initial optical requirements for the sample. The Wolfram Mathematica package was used directly for the analytical calculations themselves.
All anything, but there was a significant problem - the complexity of the calculations led to very time-consuming and lengthy calculations. And to analyze the characteristics of the material, it was necessary to analyze, first of all, visually, the spectral characteristics of the object at different wavelengths, obtained as a result of the calculation cycle. The maximum that was achieved by optimization in the computational part within the available set of calculators and licenses for the Wolfram software is to parallelize the calculation on several computers and achieve a calculation time of one configuration of parameters 4-6 hours.
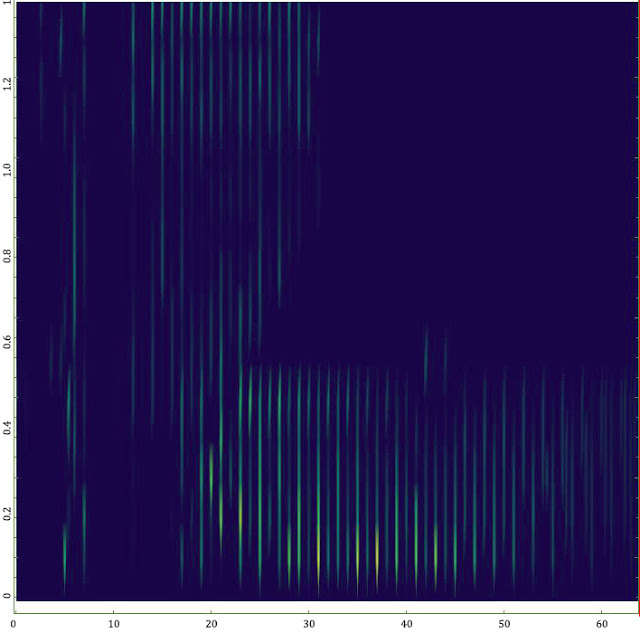
But at the second stage, which includes the post-processing of the obtained data set, visualization and interactive analysis of the spectra, it was extremely difficult to cope with Wolfram Mathematica only. Preparation of one spectrum took ~ 20 hours and required additional routine manual labor (the probability of introducing errors!). The graphic results are non-representative, and they were very poorly read visually (see figure).
The application of a known spectrum of functions, mantras and recommendations from the forums did not lead to a useful result. I will not argue that the Wolfram Mathematica package definitely does not have the necessary tools, especially since the just released 11th version has many improvements in this particular area. But in conditions of limited time to solve the problem and the need to get a result by a given date, it was physically no time to do code profiling and memory optimization without a transparent understanding of the internal principles of the complex proprietary mathematical core. As a matter of fact, the tasks of the Mathematica package, as well as its strengths, are somewhat different.
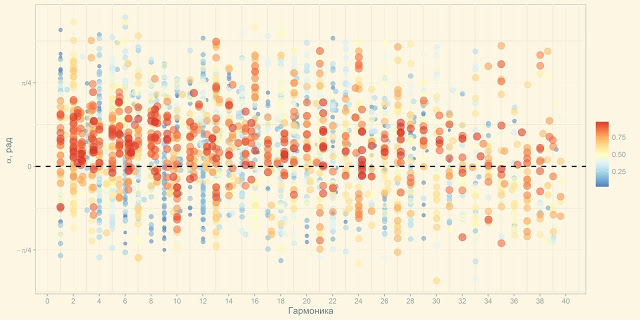
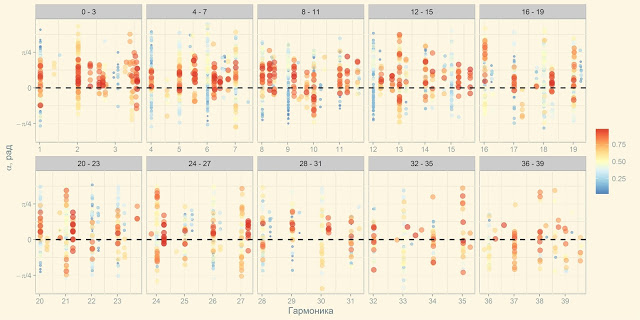
Exactly therefore, in a couple of days, a module was written on the R framework for assembling, processing visualization and express analysis of the calculated data. According to the results of the analysis, a file was formed with the parameters for the new calculation. As a result, the process of preprocessing and visualization was reduced from 20 hours to 5-7 seconds, the visualization was completely changed in 3-4 dozens of iterations and acquired the following look, clear and obvious to all performers:
The GUI was built on the basis of Shiny RStudio, thanks to the use of packages for high-level integrated data processing and visualization, elements of streaming values and functional programming, the content code on R fit in less than 100 lines.
If you look only from a technical point of view, the task may seem small. There is no Big Data, no machine learning, not even a stat. methods are not used.
From a business point of view, the effect of the application is impressive and indicative. Under the conditions of hard temporary pressure, the work was completed on time. At the same time, no money was spent on this, except for the time of the employees, which one way or another is already included in the payroll.
Task setting is quite simple and classic for any monitoring tasks - to collect data and notify responsible persons of any problems. And, of course, display it all in a friendly web user interface. The classic manual processing in Excel has long lost its relevance, because it required constant human costs, was extremely slow, mistakes were made, the analysis was carried out using simple models and through a close look at the data.
There were also a few nuances that make work very difficult:
Since the primary task was data processing and predictive analytics, the language R. was chosen to solve the problem. To ensure continuous operation, it was possible to go the classic version - R scripts to run on a schedule. But we went the other, more elegant way.
As required, it was necessary to provide a Web-based GUI. To create it, we used Shiny Server. And the specificity of Shiny applications is such that they are reactive (react to events) and, once launched, the application instance remains active. And here we remember the mantra of classic Windows API applications:
Here is the answer. Our application itself will act as a scheduler. We hang the timer handler + using event-triggered recalculation of reactive data structures and disability of graphic elements. We add exception handling and we write logging. Everything, including data collection, data processing, mathematical algorithms, uploading and launching external actuators, GUI and interactive visualization are implemented in the framework of the R language and RStudio environment. Also, advanced tools for profiling and analyzing objects allow you to optimize programs for execution time and amount of used memory.
The prototype GUI on synthetic data appeared within 1.5 weeks. The final portal, stably operating 24x7 was finalized within 1.5 months. So far there is no special need, but in case of need we will be able in a couple of clicks to issue all analytics to the outside for a mobile application through the REST API using DeployR.
In 2014, we used the R language only as a tool for performing calculations on complex mathematical algorithms on a limited set of structured data.
In 2016, we successfully applied the R ecosystem to solve local, but complex tasks of data automation and we can confidently assert that the R tools in the 2016 configuration have all the necessary properties to successfully solve these problems.
The intensive development of R packages for working with data and interactive visualization tools, Microsoft’s acquisition of a commercial R branch, gives every reason to believe that in the next 2-3 years, the capabilities of the R ecosystem will increase many times. In particular, the active development of PowerBI and the inclusion of R in SQL Serever 2016, mandatory support for leading visualization systems (from Qlik and Tableau, popular in Russia) close integration with R, support for cluster computing, work with Big Data platforms in enterprise editions, and other interesting initiatives clearly indicate a large potential of the R ecosystem in business problems.
But waiting for miracles for a few more years makes no sense. Already, you can roll up your sleeves and try to automate business tasks on R, which in any company there may be more than a dozen. Saving money for the company is provided; fun and challenge for the performers is provided in the square.
Previous post: "Data Science Tools as an Alternative to the Classical Integration of IT Systems"
Next post: “Gentleman's Pack of R for Automating Business Tasks”
The choice was not random, but was the result of a weighted analysis. My previous experience of executing projects in various branches and fields of human activity, as a rule, was accounted for interdisciplinary junctions, therefore the situation with the absence of a specially created tool was familiar and required an operational decision.
The key points on which the selected instrument was evaluated were as follows:
- The main content of the tasks was reduced to a standard cycle: data collection - cleaning and preprocessing - mathematical processing of varying degrees of complexity - visualization - issuing control commands to external systems.
- All information was exchanged with the outside world using standardized protocols (ODBC, REST) and files of various formats. Information is not very much (maximum, tens of gigabytes per day), ~ 70% is presented in a structured form, streaming processing in real time is absolutely not required.
- There must be an interactive web user interface with tools for express analytics of the data being processed.
- The budget for the purchase of anything = 0. Time to implement = Yesterday. User requirements will appear after the first demonstration of the prototype.
- Any system, purchased or open-source, takes time to learn. Even with the presence of “intuitive” user interfaces, a step left-right will require deep immersion and binding to the ideology of the architecture of the chosen system. And, unfortunately, there are no guarantees that after a while the limitations of this system will not be a brake.
If you really have to invest time in studying the system, then you need to do it as efficiently as possible, choosing systems that have the flexibility and breadth of possible applications. Looking ahead, I will say, for this class of problems it was a decisive argument in favor of winning R in the final. Although Python, although ranked second, was and will remain an active universal tool.
')
Evaluation and comparison of approaches to solving the problem was carried out from the point of view of the business, for which the primary indicator is the achievement of the result in a given period of time for a minimum cost. Since on the way to the final, technically incomplete solutions were eliminated themselves, we will assume that the final decision satisfies the needs of both business customers and technical implementers.
R framework
The minimum set that completely satisfied us is the R language, IDE is RStudio , the integration gateway is DeployR , and the client web application server is Shiny .
Naturally, R, being a programming language, is practically unlimited in its possibilities for creating logically and mathematically complex components. It all depends on the depth of knowledge, skills and packages used.
Task # 1. Calculation of the optical properties of materials
The classic design and production problem, when for the formation of prototypes of complex layered structures, it is necessary to determine a number of parameters necessary for technological production. To determine the parameters, it is necessary to carry out very nontrivial quantum-mechanical calculations. And from various combinations to choose a set of parameters that optimally satisfy the set of initial optical requirements for the sample. The Wolfram Mathematica package was used directly for the analytical calculations themselves.
All anything, but there was a significant problem - the complexity of the calculations led to very time-consuming and lengthy calculations. And to analyze the characteristics of the material, it was necessary to analyze, first of all, visually, the spectral characteristics of the object at different wavelengths, obtained as a result of the calculation cycle. The maximum that was achieved by optimization in the computational part within the available set of calculators and licenses for the Wolfram software is to parallelize the calculation on several computers and achieve a calculation time of one configuration of parameters 4-6 hours.
But at the second stage, which includes the post-processing of the obtained data set, visualization and interactive analysis of the spectra, it was extremely difficult to cope with Wolfram Mathematica only. Preparation of one spectrum took ~ 20 hours and required additional routine manual labor (the probability of introducing errors!). The graphic results are non-representative, and they were very poorly read visually (see figure).
The application of a known spectrum of functions, mantras and recommendations from the forums did not lead to a useful result. I will not argue that the Wolfram Mathematica package definitely does not have the necessary tools, especially since the just released 11th version has many improvements in this particular area. But in conditions of limited time to solve the problem and the need to get a result by a given date, it was physically no time to do code profiling and memory optimization without a transparent understanding of the internal principles of the complex proprietary mathematical core. As a matter of fact, the tasks of the Mathematica package, as well as its strengths, are somewhat different.
Exactly therefore, in a couple of days, a module was written on the R framework for assembling, processing visualization and express analysis of the calculated data. According to the results of the analysis, a file was formed with the parameters for the new calculation. As a result, the process of preprocessing and visualization was reduced from 20 hours to 5-7 seconds, the visualization was completely changed in 3-4 dozens of iterations and acquired the following look, clear and obvious to all performers:
The GUI was built on the basis of Shiny RStudio, thanks to the use of packages for high-level integrated data processing and visualization, elements of streaming values and functional programming, the content code on R fit in less than 100 lines.
If you look only from a technical point of view, the task may seem small. There is no Big Data, no machine learning, not even a stat. methods are not used.
From a business point of view, the effect of the application is impressive and indicative. Under the conditions of hard temporary pressure, the work was completed on time. At the same time, no money was spent on this, except for the time of the employees, which one way or another is already included in the payroll.
Task # 2. Monitoring data sources for anomalies and predicted deviations
Task setting is quite simple and classic for any monitoring tasks - to collect data and notify responsible persons of any problems. And, of course, display it all in a friendly web user interface. The classic manual processing in Excel has long lost its relevance, because it required constant human costs, was extremely slow, mistakes were made, the analysis was carried out using simple models and through a close look at the data.
There were also a few nuances that make work very difficult:
- The sources were very heterogeneous, including github, local files, json REST API responses.
- Time stamps in the sources could go in random order, data for already “closed” periods could arrive (shipments came in batches).
- Missing data, different data formats, irregular time series, obtaining aggregate metrics instead of raw data (for example, a moving average instead of a value).
- This is not a one-time calculation, but a constant process of 24x7.
Since the primary task was data processing and predictive analytics, the language R. was chosen to solve the problem. To ensure continuous operation, it was possible to go the classic version - R scripts to run on a schedule. But we went the other, more elegant way.
As required, it was necessary to provide a Web-based GUI. To create it, we used Shiny Server. And the specificity of Shiny applications is such that they are reactive (react to events) and, once launched, the application instance remains active. And here we remember the mantra of classic Windows API applications:
WHILE(GETMESSAGE(&MSG, NULL, 0, 0) > 0) { TRANSLATEMESSAGE(&MSG); DISPATCHMESSAGE(&MSG); } Here is the answer. Our application itself will act as a scheduler. We hang the timer handler + using event-triggered recalculation of reactive data structures and disability of graphic elements. We add exception handling and we write logging. Everything, including data collection, data processing, mathematical algorithms, uploading and launching external actuators, GUI and interactive visualization are implemented in the framework of the R language and RStudio environment. Also, advanced tools for profiling and analyzing objects allow you to optimize programs for execution time and amount of used memory.
The prototype GUI on synthetic data appeared within 1.5 weeks. The final portal, stably operating 24x7 was finalized within 1.5 months. So far there is no special need, but in case of need we will be able in a couple of clicks to issue all analytics to the outside for a mobile application through the REST API using DeployR.
Conclusion
In 2014, we used the R language only as a tool for performing calculations on complex mathematical algorithms on a limited set of structured data.
In 2016, we successfully applied the R ecosystem to solve local, but complex tasks of data automation and we can confidently assert that the R tools in the 2016 configuration have all the necessary properties to successfully solve these problems.
The intensive development of R packages for working with data and interactive visualization tools, Microsoft’s acquisition of a commercial R branch, gives every reason to believe that in the next 2-3 years, the capabilities of the R ecosystem will increase many times. In particular, the active development of PowerBI and the inclusion of R in SQL Serever 2016, mandatory support for leading visualization systems (from Qlik and Tableau, popular in Russia) close integration with R, support for cluster computing, work with Big Data platforms in enterprise editions, and other interesting initiatives clearly indicate a large potential of the R ecosystem in business problems.
But waiting for miracles for a few more years makes no sense. Already, you can roll up your sleeves and try to automate business tasks on R, which in any company there may be more than a dozen. Saving money for the company is provided; fun and challenge for the performers is provided in the square.
Previous post: "Data Science Tools as an Alternative to the Classical Integration of IT Systems"
Next post: “Gentleman's Pack of R for Automating Business Tasks”
Source: https://habr.com/ru/post/309350/
All Articles